Lecture 11: Chapter 7: Analysis of Variance (ANOVA) | Trường Đại học Quốc tế, Đại học Quốc gia Thành phố Hồ Chí Minh
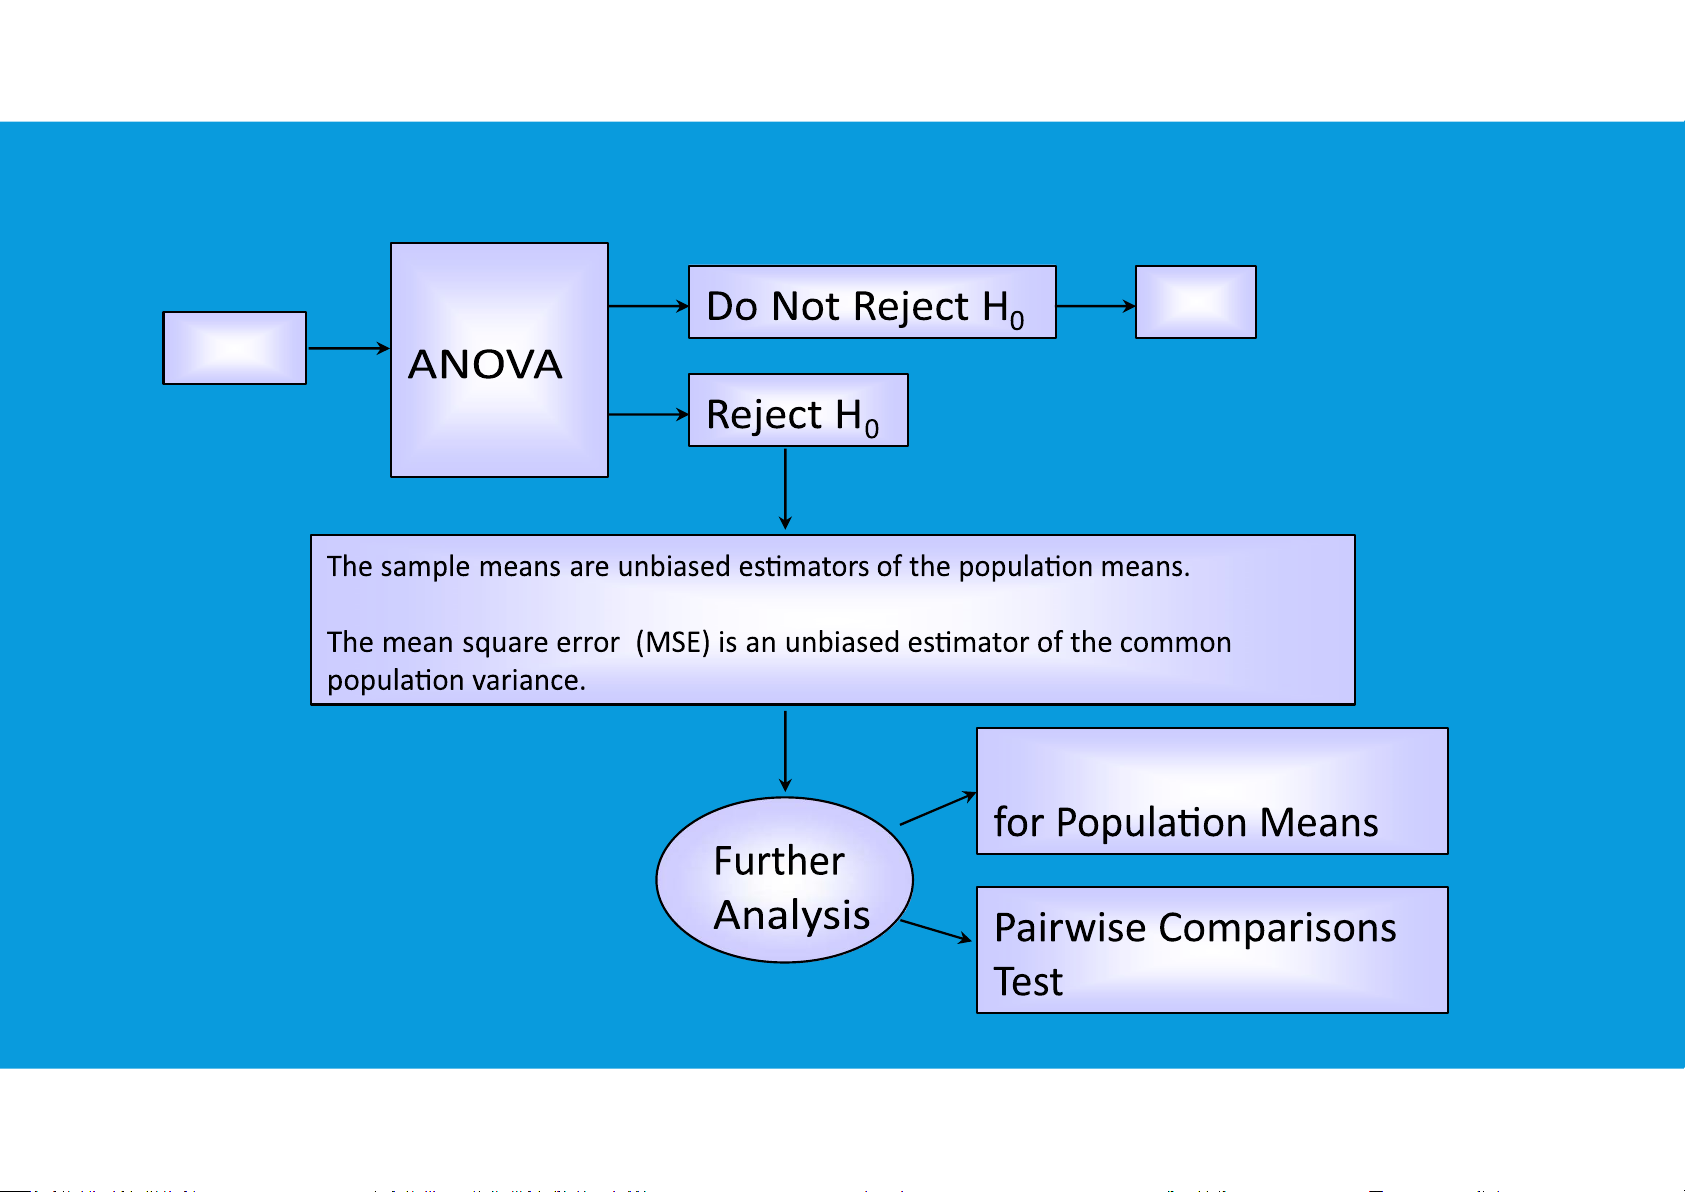
ANOVA (ANalysis Of VAriance) is a statistical method for determining the existence of differences among several population means. ANOVA is designed to detect differences among means from populations subject to different treatments (or set-up). ANOVA is a joint test. The equality of several population means is tested simultaneously or jointly. ANOVA tests for the equality of several population means by looking at two estimators of the population variance (hence, analysis of variance). Tài liệu giúp bạn tham khảo, ôn tập và đạt kết quả cao. Mời bạn xem đón đọc!
Môn: Applied statistics (ENEE1006IU) 47 tài liệu
Trường: Trường Đại học Quốc tế, Đại học Quốc gia Thành phố Hồ Chí Minh 1.9 K tài liệu
Tác giả:


Preview text:
lOMoAR cPSD| 45903860 APPLIED STATISTICS COURSE CODE: ENEE1006IU Lecture 11:
Chapter 7: Analysis of Variance (ANOVA)
(3 credits: 2 is for lecture, 1 is for lab-work) 1 lOMoAR cPSD| 45903860
CHAPTER 7: ANALYSIS OF VARIANCE (ANOVA)
•ANOVA (ANalysis Of VAriance) is a statistical method for determining the
existence of differences among several population means. ANOVA is designed
to detect differences among means from populations subject to different treatments (or set-up) ANOVA is a joint test
The equality of several population means is tested simultaneously or jointly. ANOVA
tests for the equality of several population means by looking at two estimators of
the population variance (hence, analysis of variance). 2 lOMoAR cPSD| 45903860
CHAPTER 7: ANALYSIS OF VARIANCE (ANOVA)
•In an analysis of variance:
We have k independent random samples, each one corresponding to a population subject to a different treatment. We have:
n = n1+ n2+ n3+ ...+nk total observations.
k sample means: 1, 2 , 3 , ... , k
These k sample means can be used to calculate an estimator of the population variance.
If the population means are equal, we expect the variance among the sample means to be small. 3 lOMoAR cPSD| 45903860 k sample variances: s 2 2 2 2 1 , s2 , s3 , ...,sk
These sample variances can be used to find a pooled estimator of the population variance σ 2 k . 4 lOMoAR cPSD| 45903860
CHAPTER 7: ANALYSIS OF VARIANCE (ANOVA) Stop Data Confidence Intervals 5 lOMoAR cPSD| 45903860
CHAPTER 7: ANALYSIS OF VARIANCE (ANOVA)
•7.1. Inferences about a population variance
•7.2. Inferences about two population variances
•7.3. Assumptions for analysis of variance •7.4. A conceptual overview •7.5. ANOVA table •7.6. ANOVA procedure
7.1. INFERENCES ABOUT A POPULATION VARIANCE
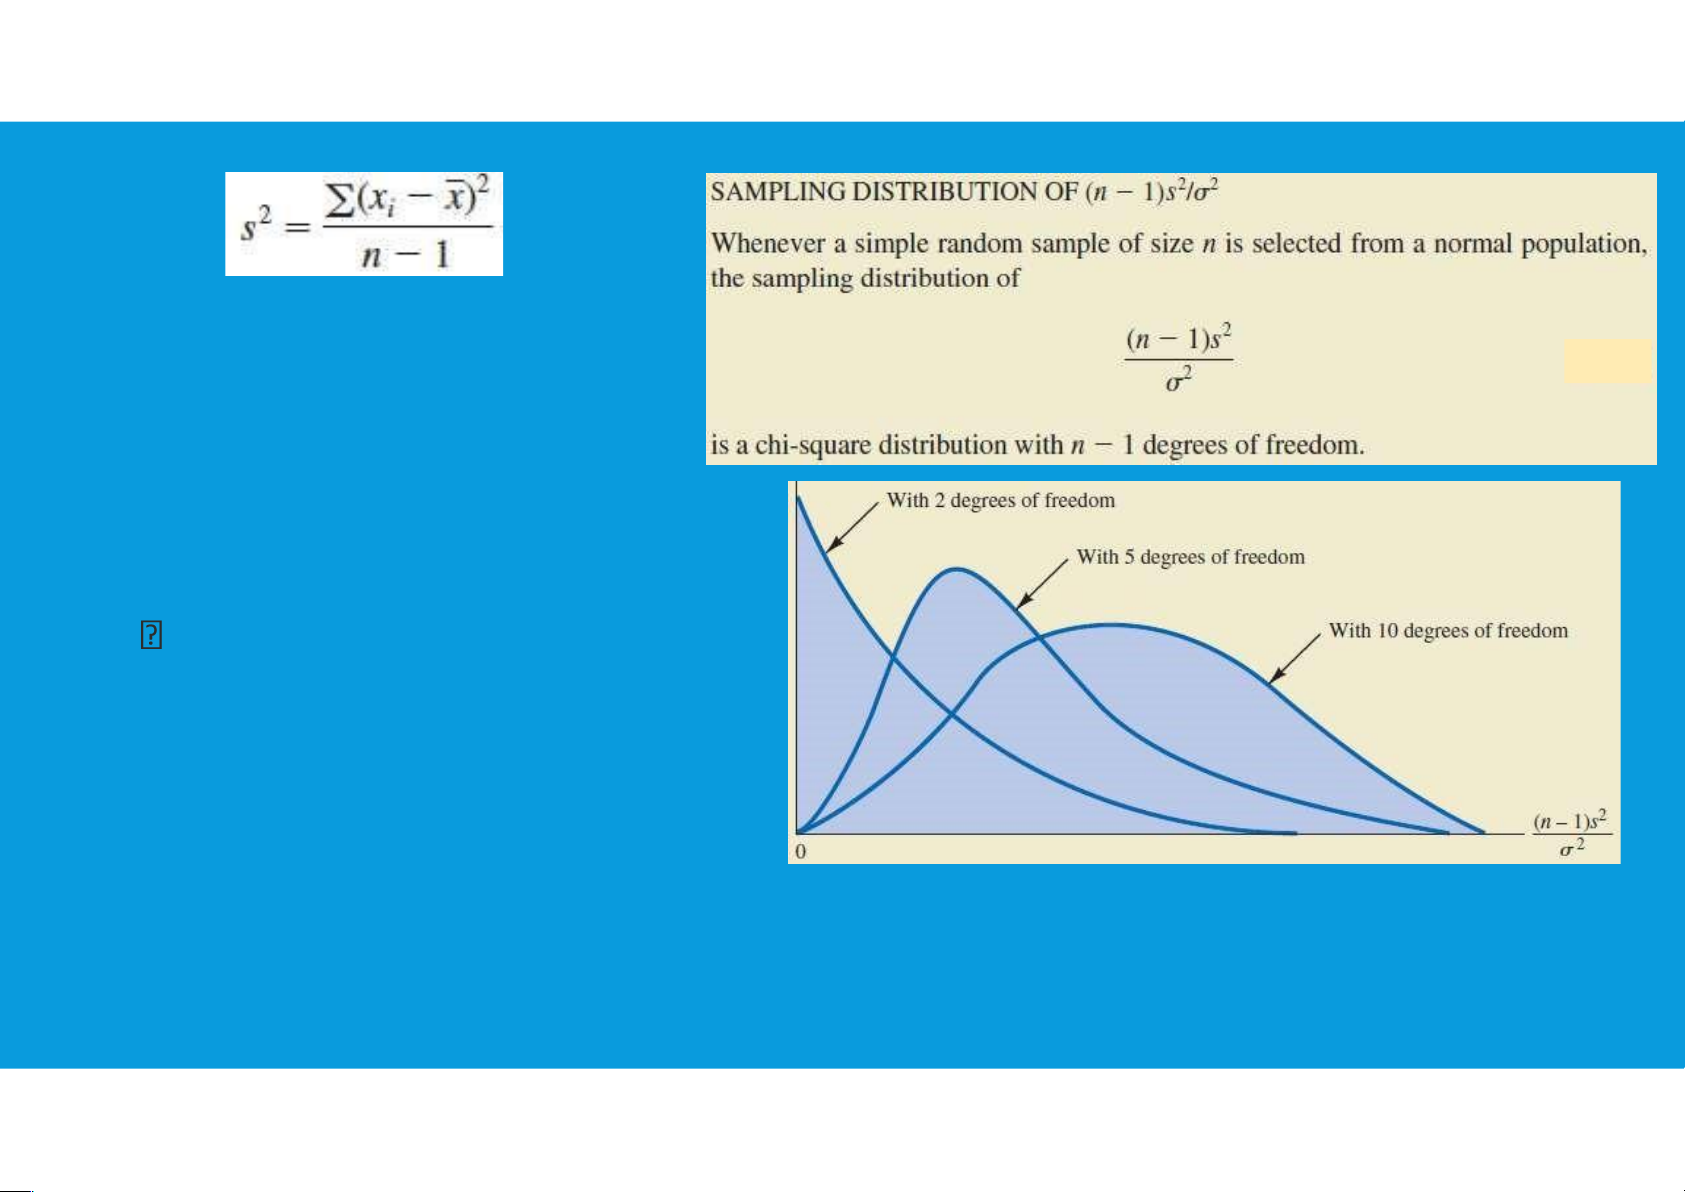
•The sample variance s2 is the point estimator of the population variance σ2 6 lOMoAR cPSD| 45903860 - nonnegative - is skewed to the right
- as k increases, the distribution becomes more symmetric
- as k ∞, the limiting form of the
chisquare distribution is the normal distribution 7 lOMoAR cPSD| 45903860
7.1. INFERENCES ABOUT A POPULATION VARIANCE
•Interval Estimation: since the sampling distribution of (n − 1)s2/σ2 is known
to have a chi-square distribution whenever a simple random sample of size n is
selected from a normal population, we can use the chisquare distribution to
develop interval estimates and conduct hypothesis tests about a population variance. 8 lOMoAR cPSD| 45903860
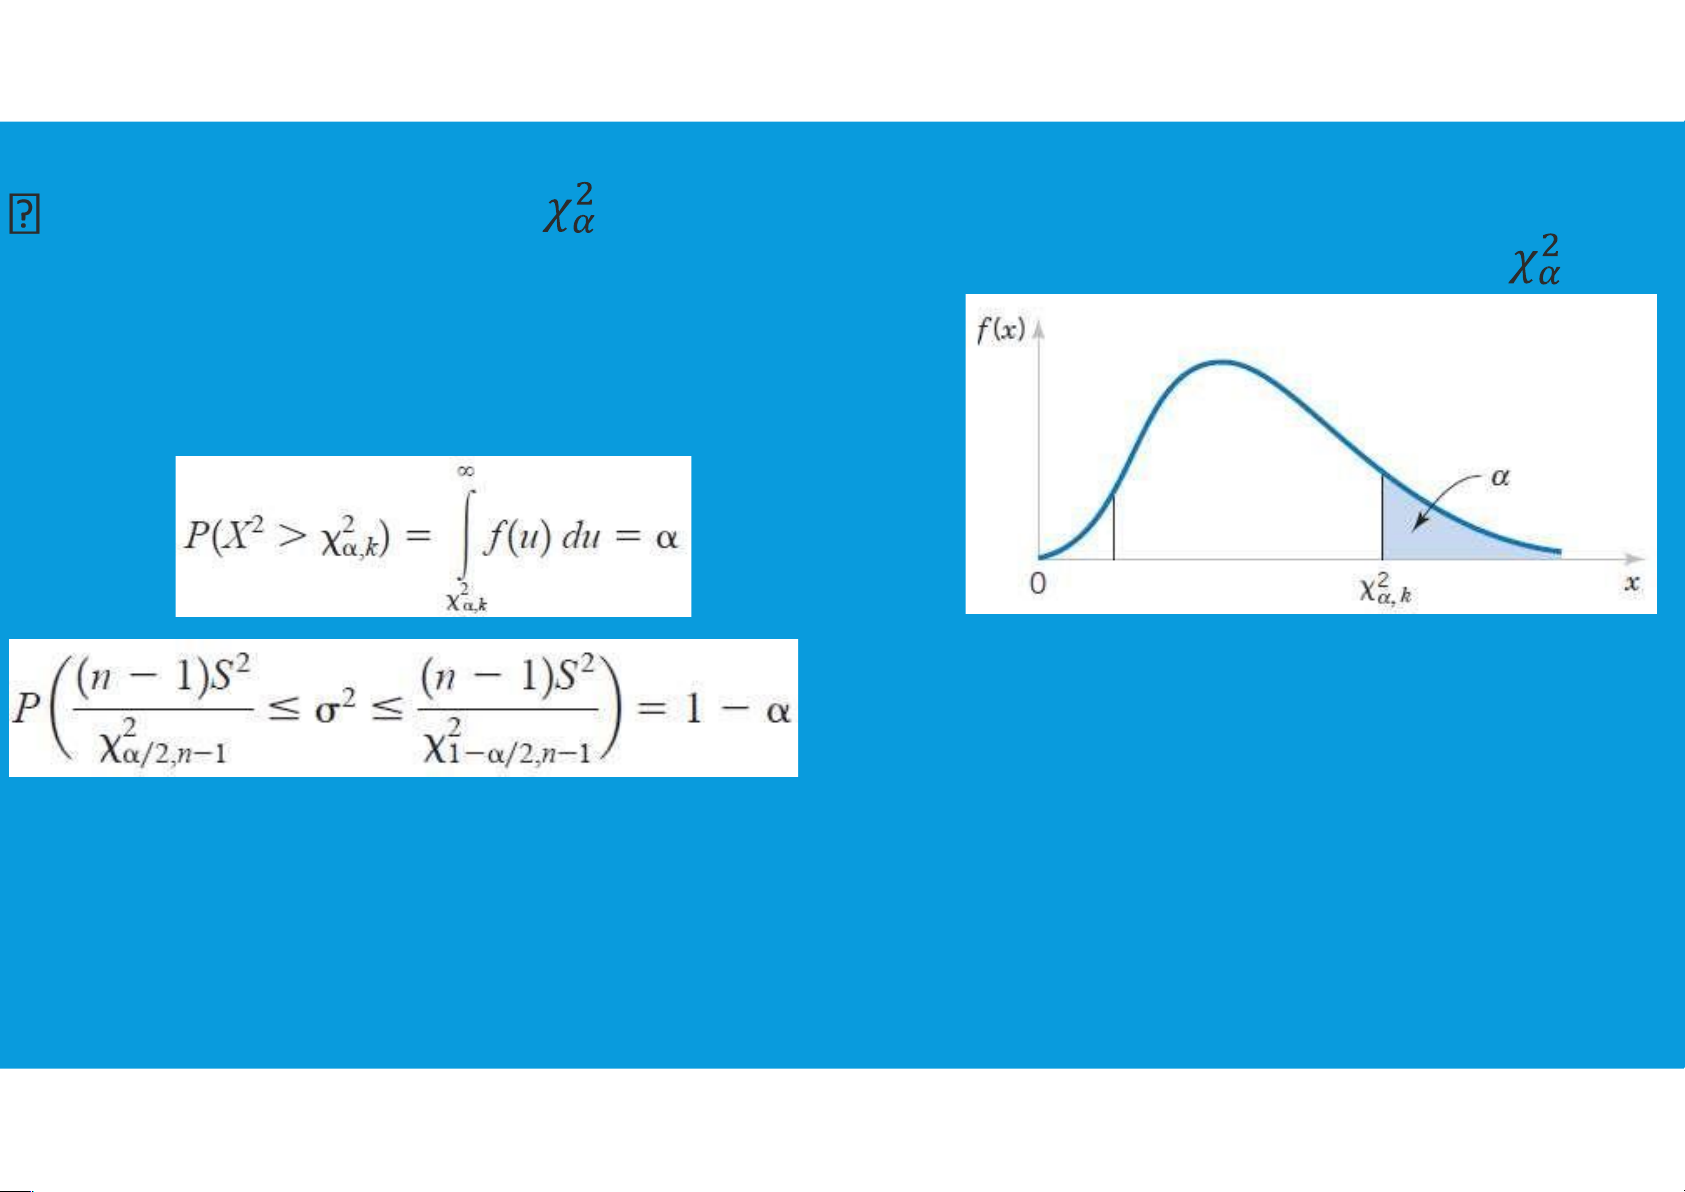
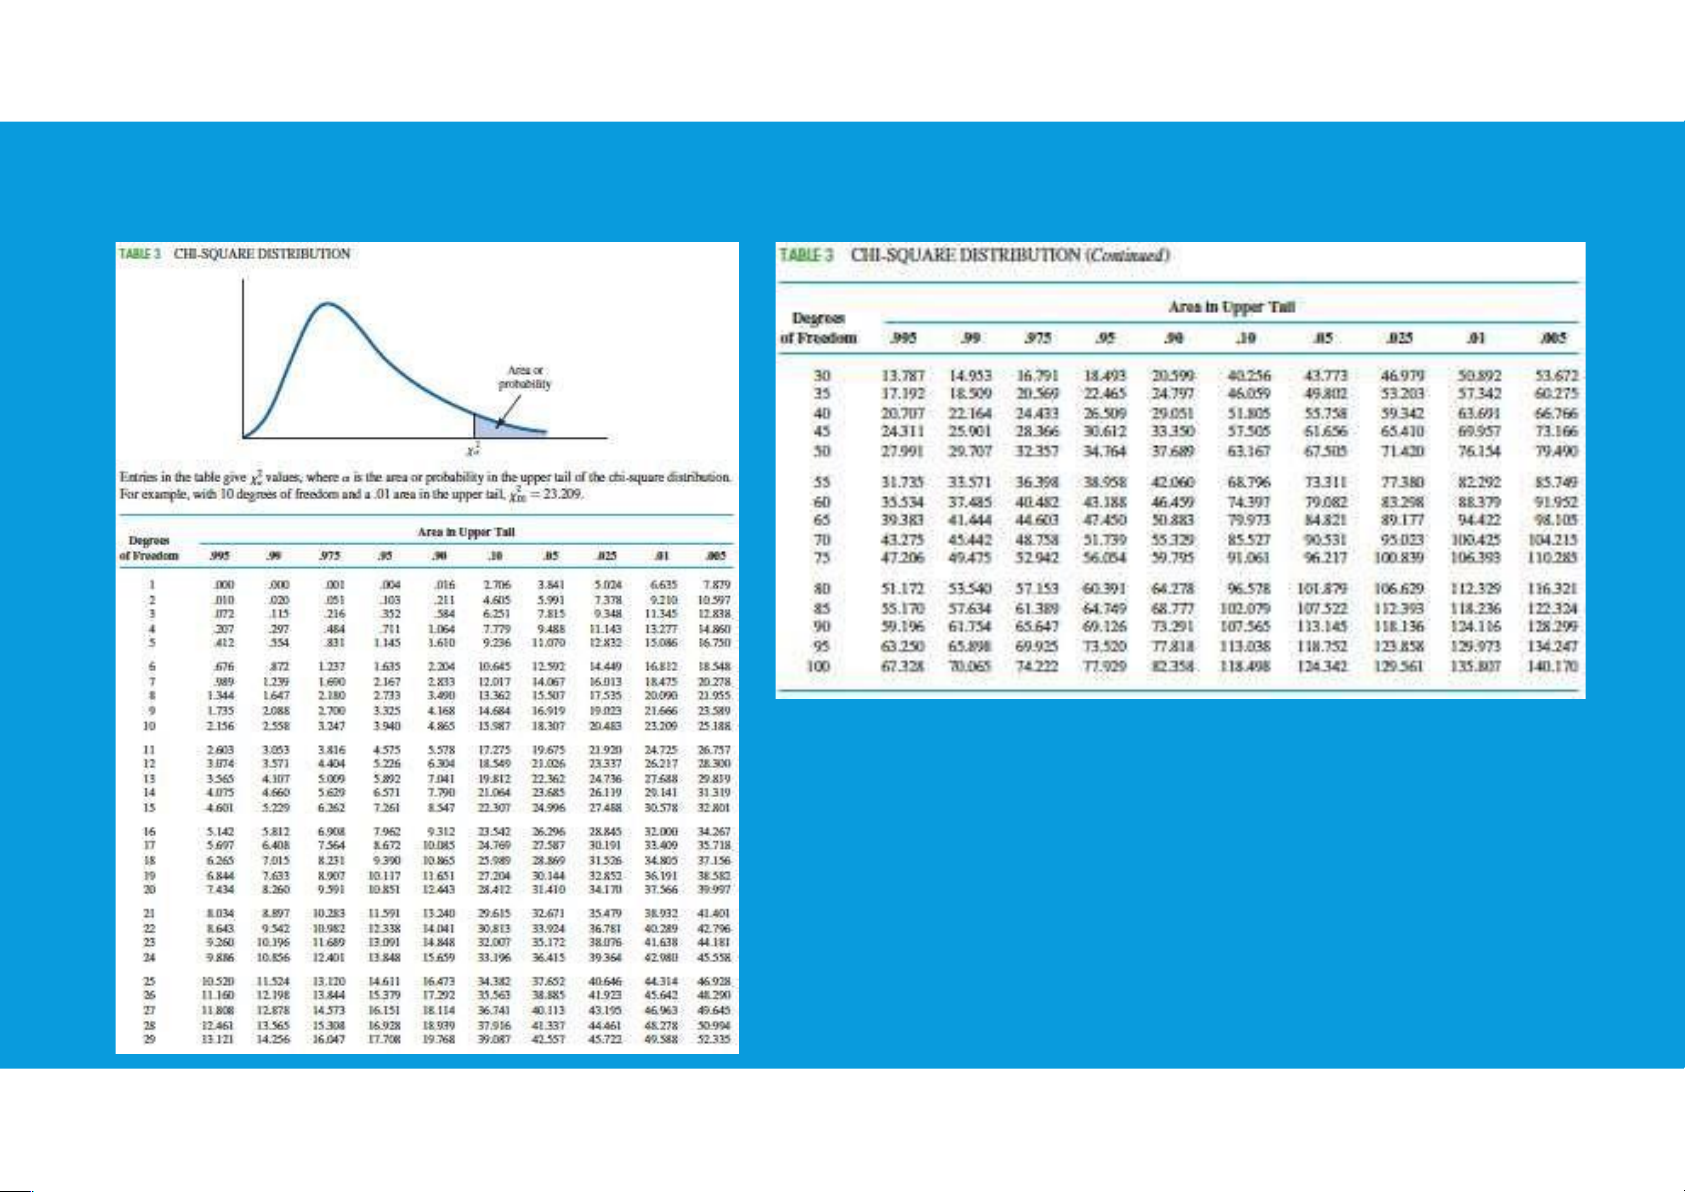
we will use the notation to denote the
value for the chi-square distribution that
provides an area or probability of α to the right of the value.
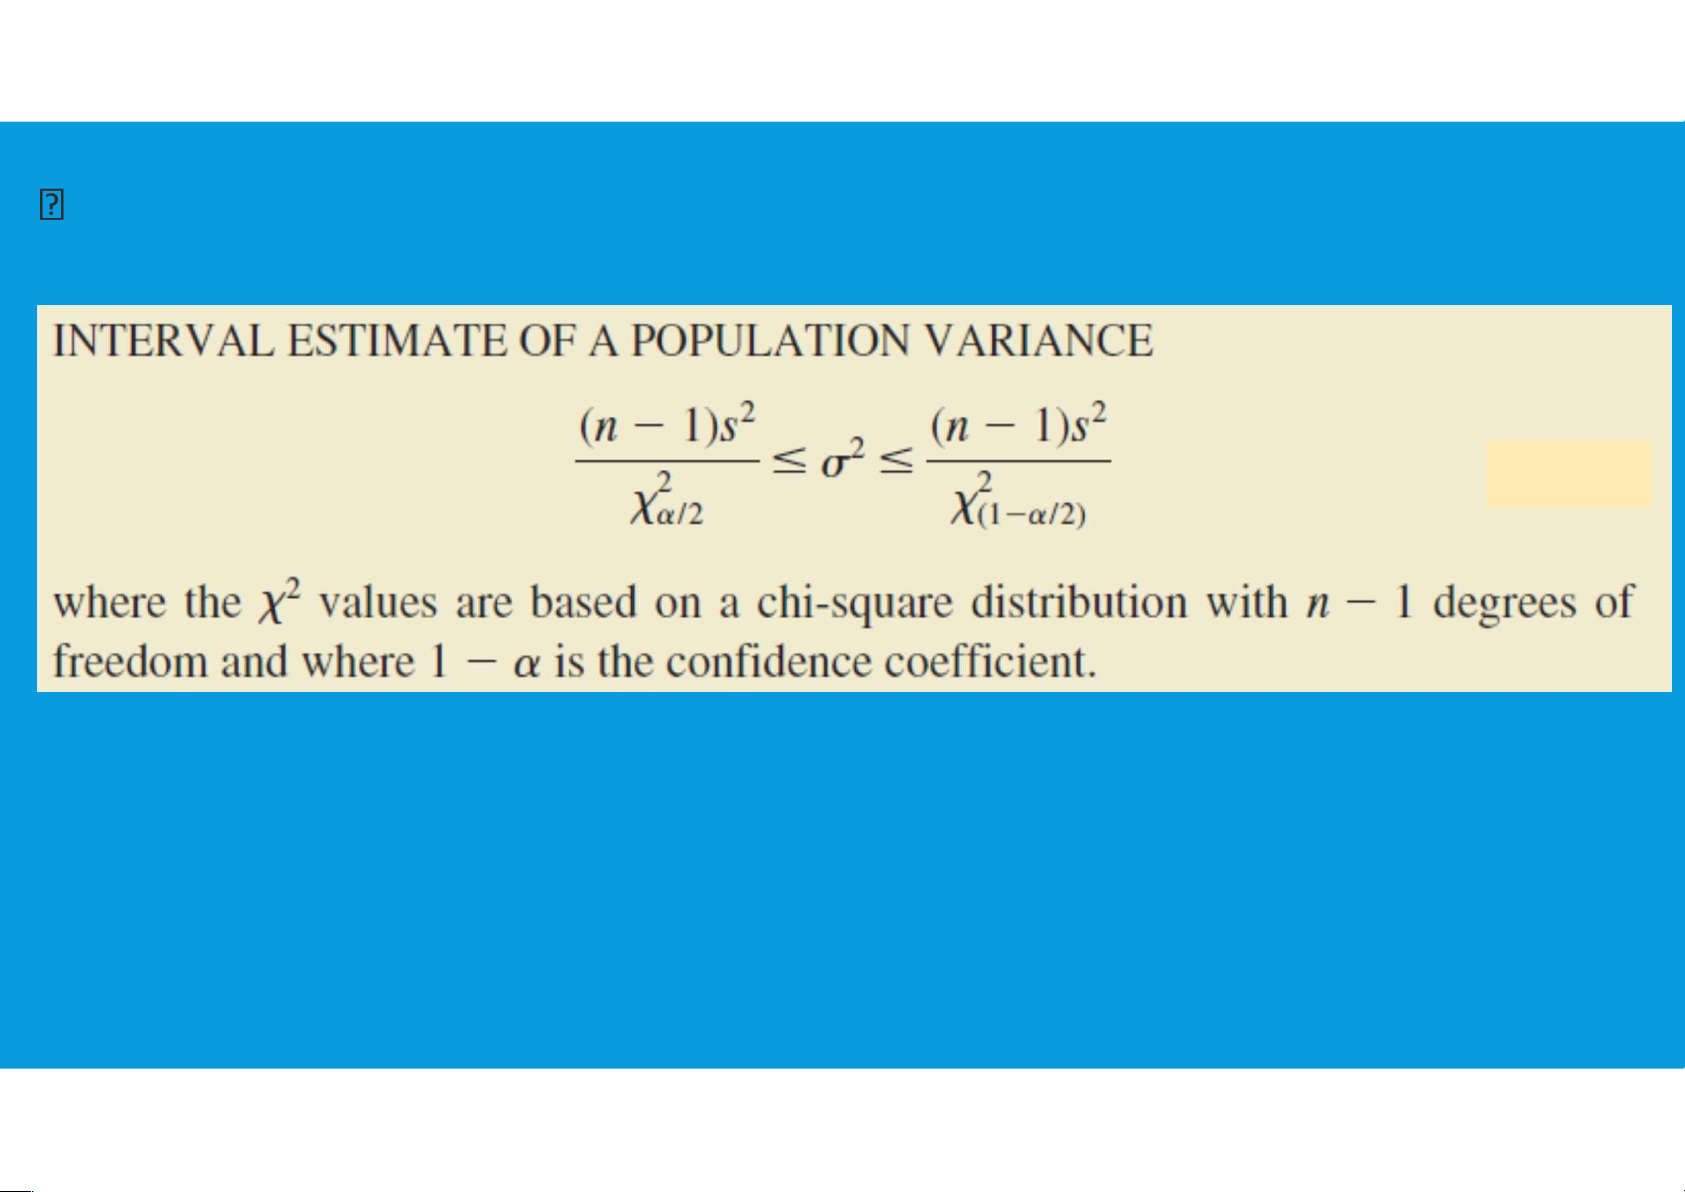
7.1. INFERENCES ABOUT A POPULATION VARIANCE •Interval Estimation: 9 lOMoAR cPSD| 45903860
We illustrated the process of using the chi-square distribution to establish
interval estimates of a population variance and a population standard deviation.
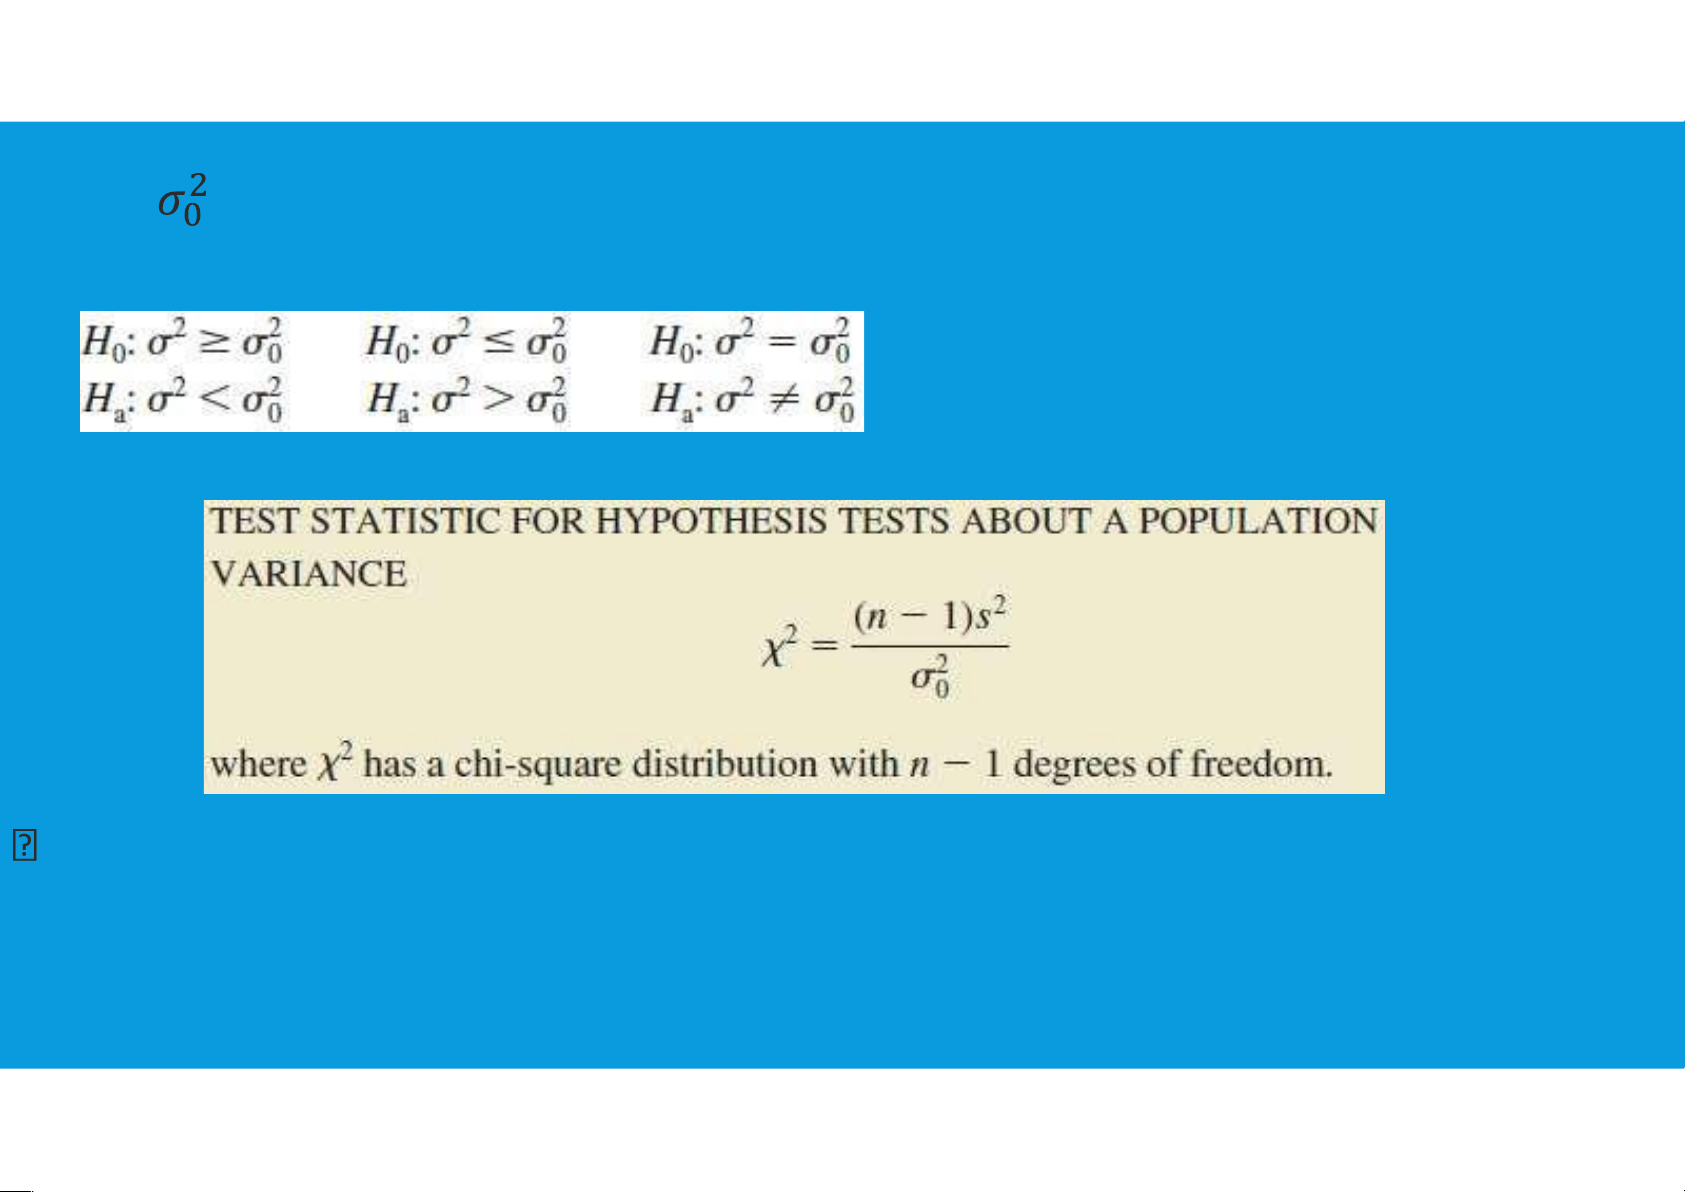
7.1. INFERENCES ABOUT A POPULATION VARIANCE •Hypothesis Testing: 10 lOMoAR cPSD| 45903860
•Using to denote the hypothesized value for the population variance, the three
forms for a hypothesis test about a population variance are as follows:
•Assuming that the population has a normal distribution, the test statistic is as follows:
either the p-value approach or the critical value approach may be used to
determine whether the null hypothesis can be rejected 11 lOMoAR cPSD| 45903860
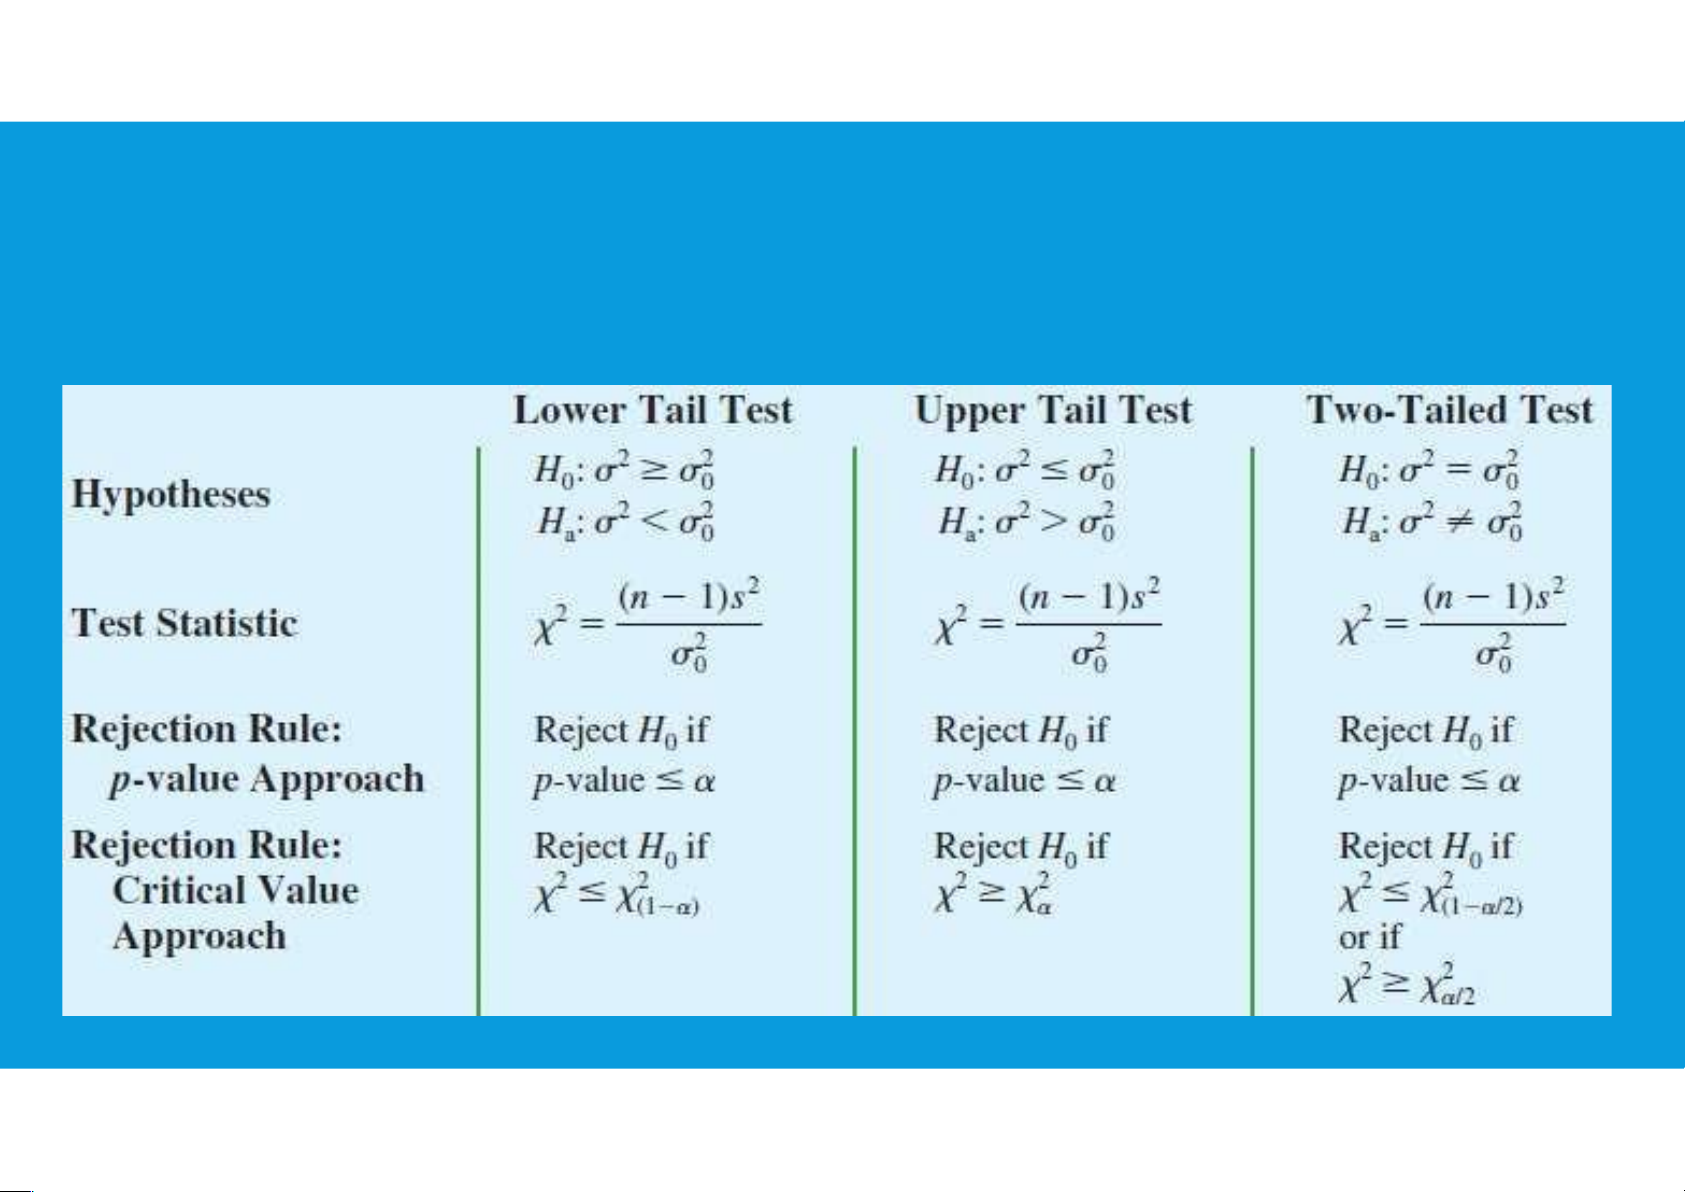
7.1. INFERENCES ABOUT A POPULATION VARIANCE SUMMARY OF
HYPOTHESIS TESTS ABOUT A POPULATION VARIANCE 12 lOMoAR cPSD| 45903860
7.1. INFERENCES ABOUT A POPULATION VARIANCE 13 lOMoAR cPSD| 45903860
7.2. INFERENCES ABOUT TWO POPULATION VARIANCES
•In making comparisons about the two population variances, we will be using data
collected from two independent random samples, one from population 1 and another from population 2.
•The two sample variances s 2 2
1 and s2 will be the basis for making inferences about
the two population variances and .
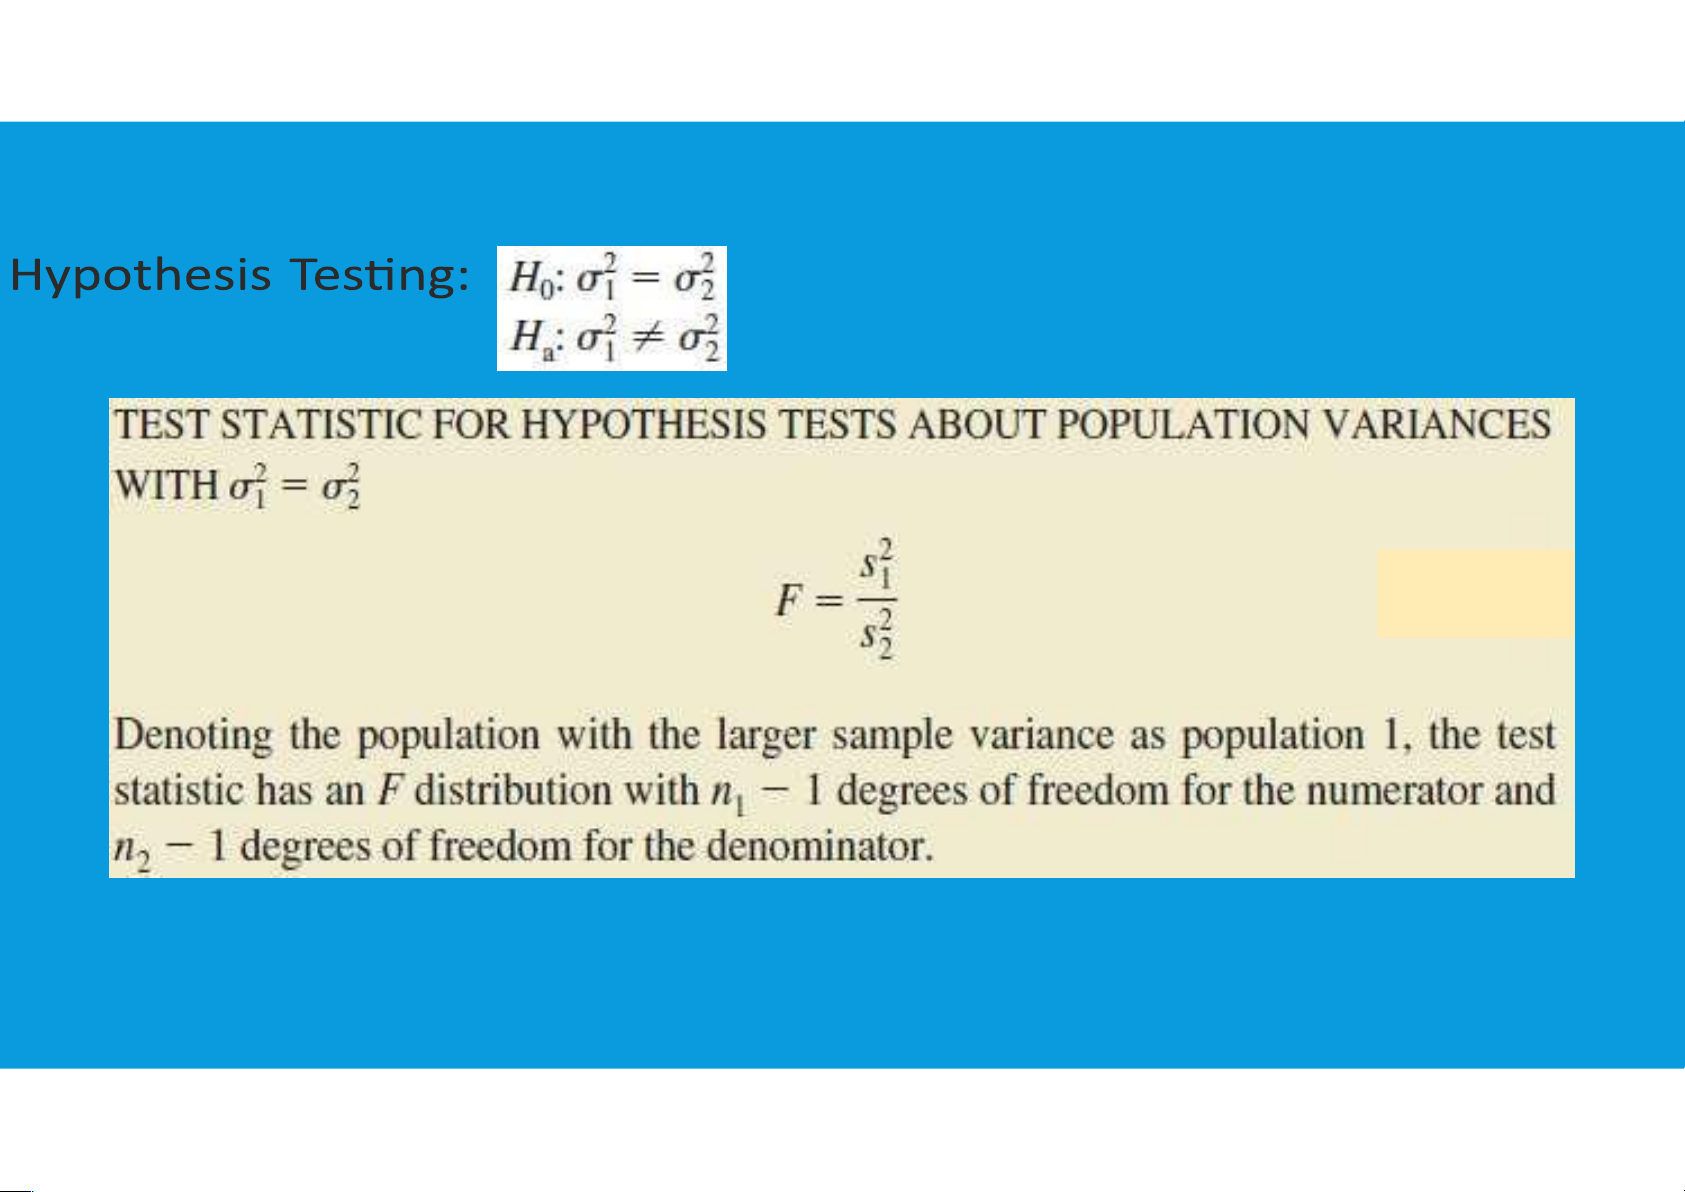
•Whenever the variances of two normal populations are equal ( = ), the
sampling distribution of the ratio of the two sample variances s 2 2 1 / s2 is as follows: 14 lOMoAR cPSD| 45903860
7.2. INFERENCES ABOUT TWO POPULATION VARIANCES
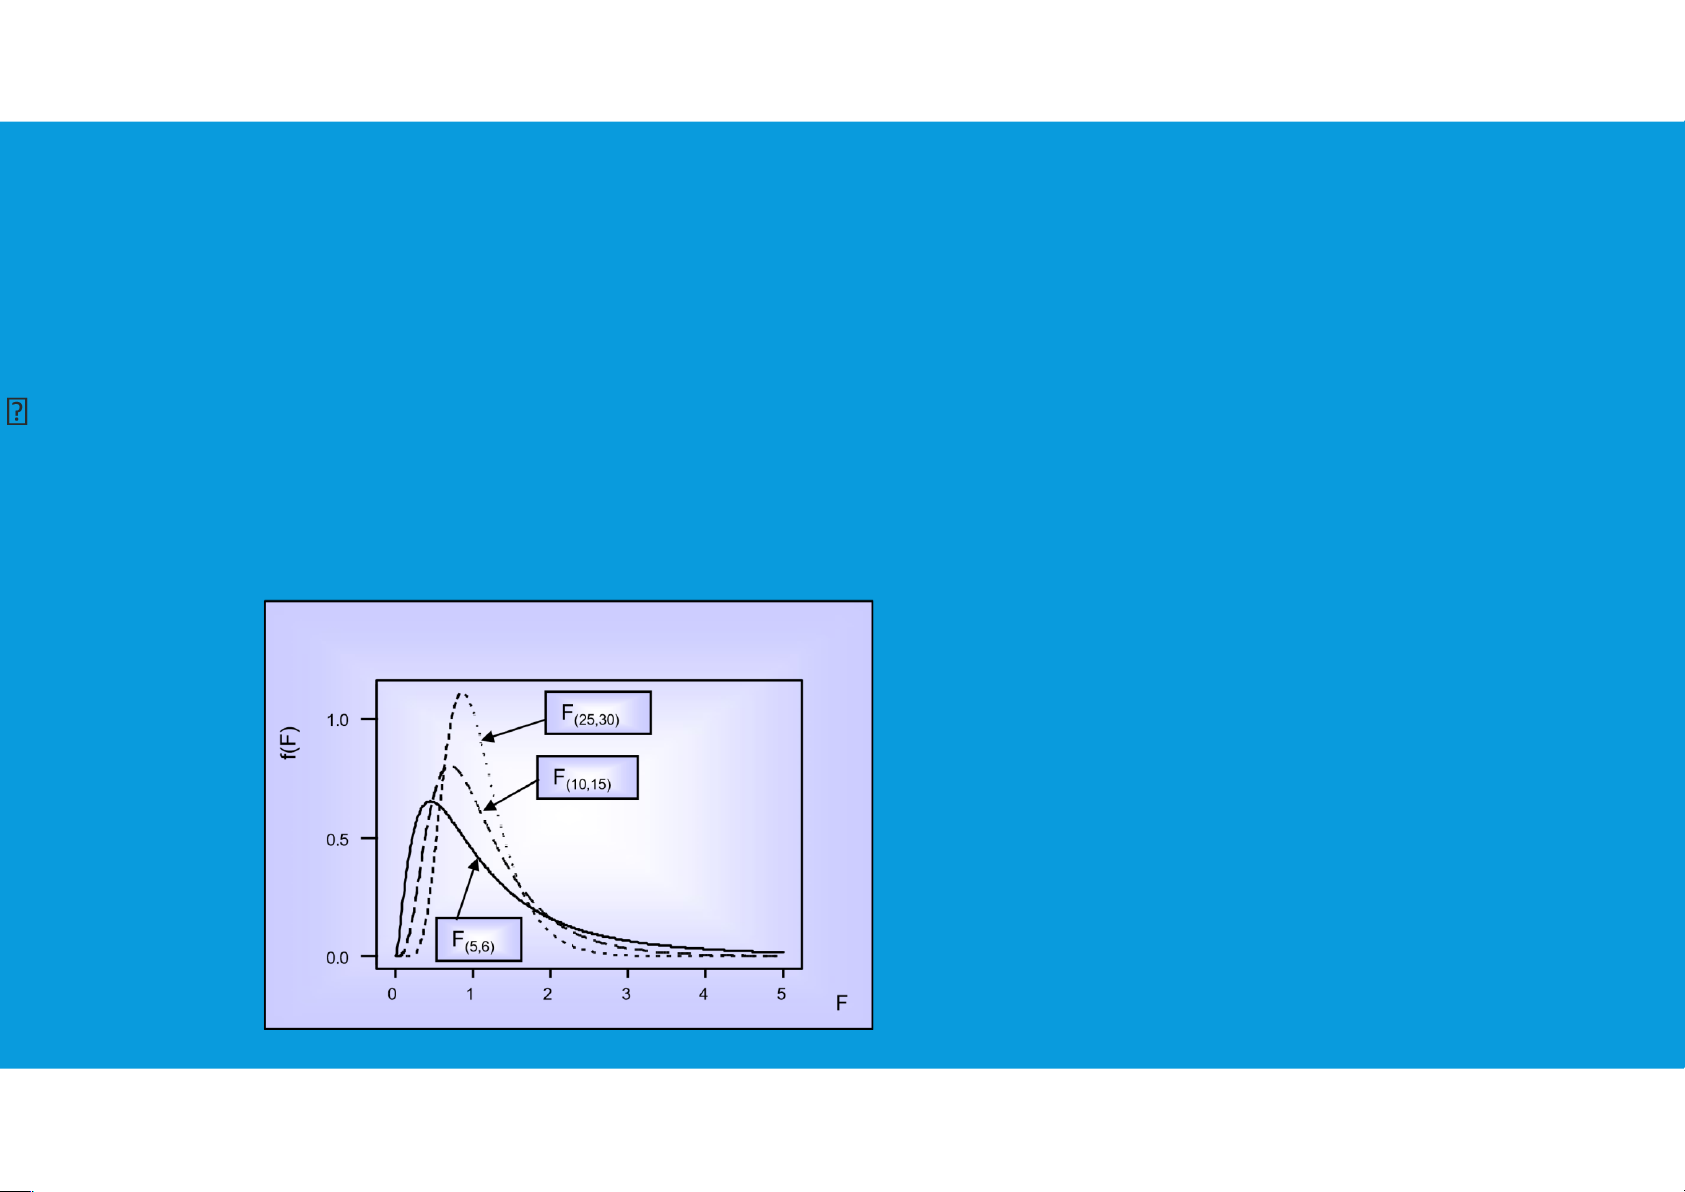
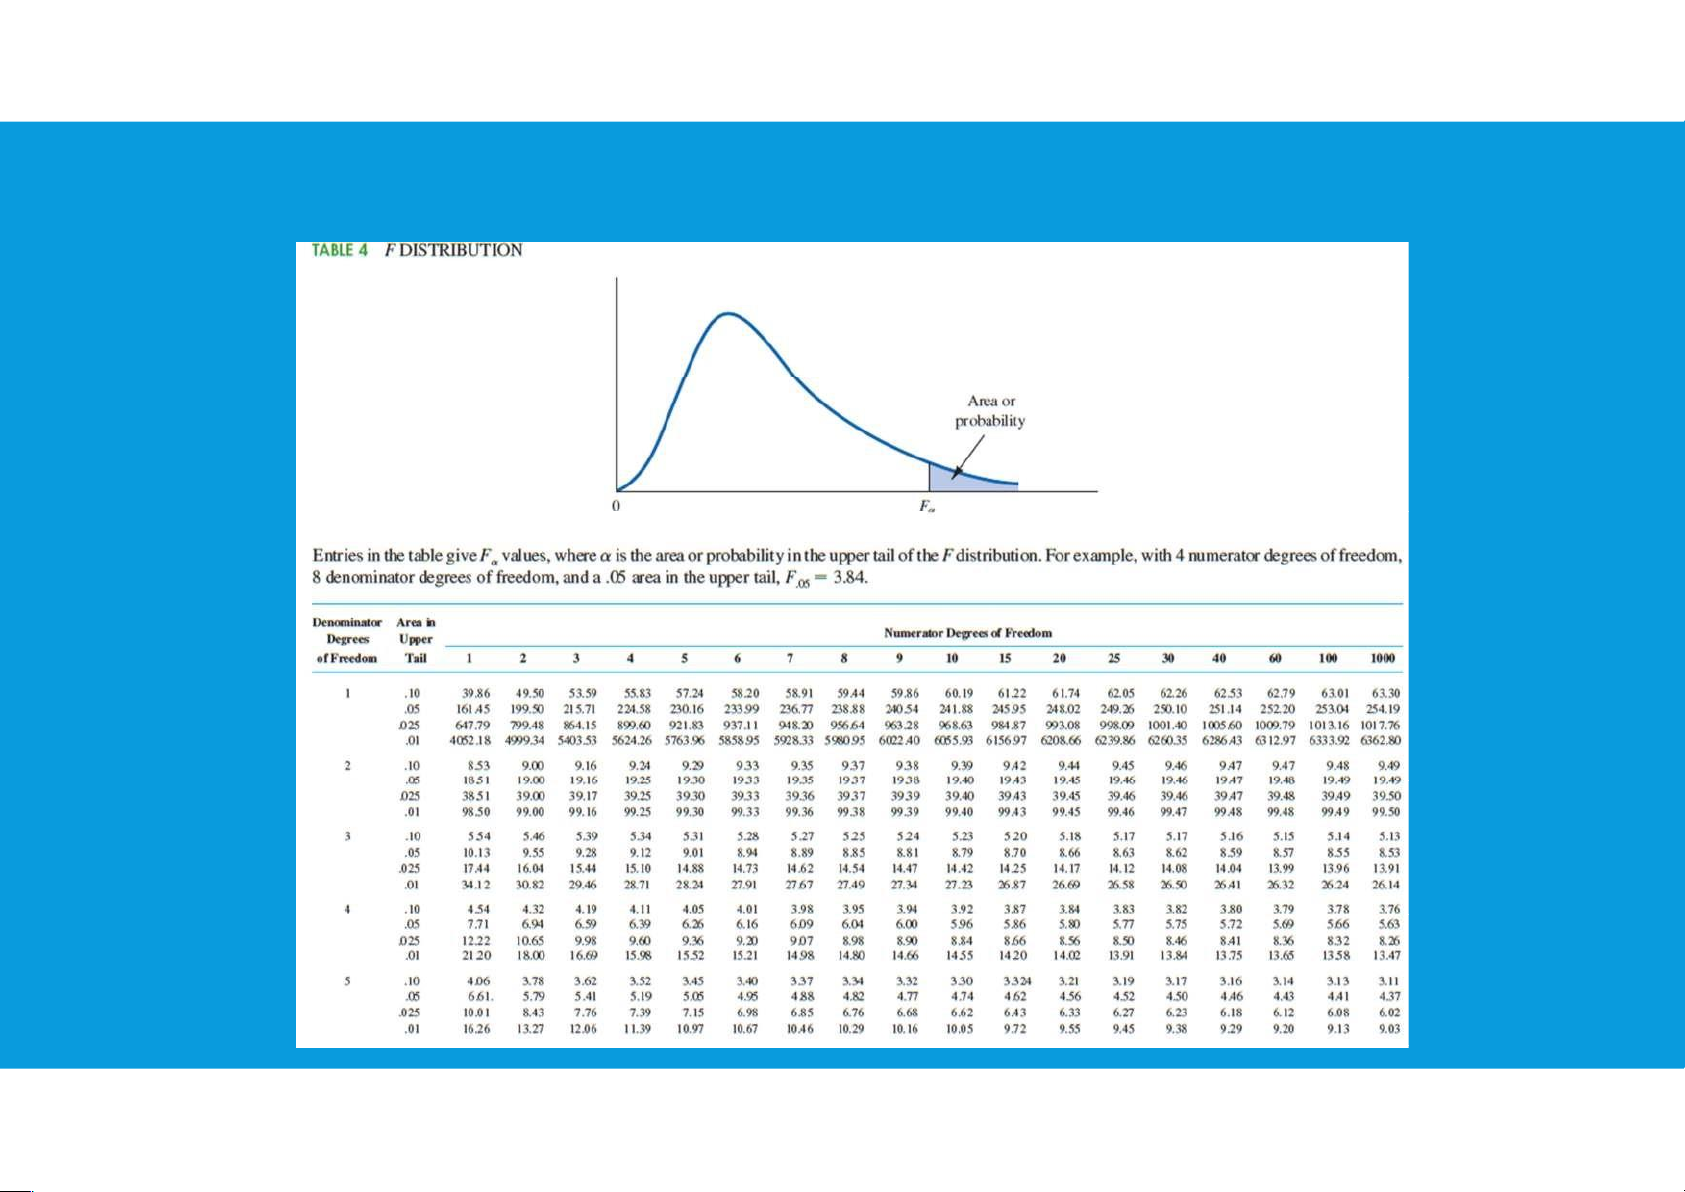
• The F distribution is not symmetric, and the F values can never be negative. The shape of any
particular F distribution depends on its numerator and denominator degrees of freedom.
we will use Fα to denote the value of F that provides an area or probability of α in the upper tail of the distribution
• The F distribution is bound by zero on the left, and skewed to the right.
F Distributions with different Degrees of Freedom 15 lOMoAR cPSD| 45903860
7.2. INFERENCES ABOUT TWO POPULATION VARIANCES
• Because the F test statistic is constructed with the larger sample variance s 2 1 in the numerator,
the value of the test statistic will be in the upper tail of the F distribution. 16 lOMoAR cPSD| 45903860
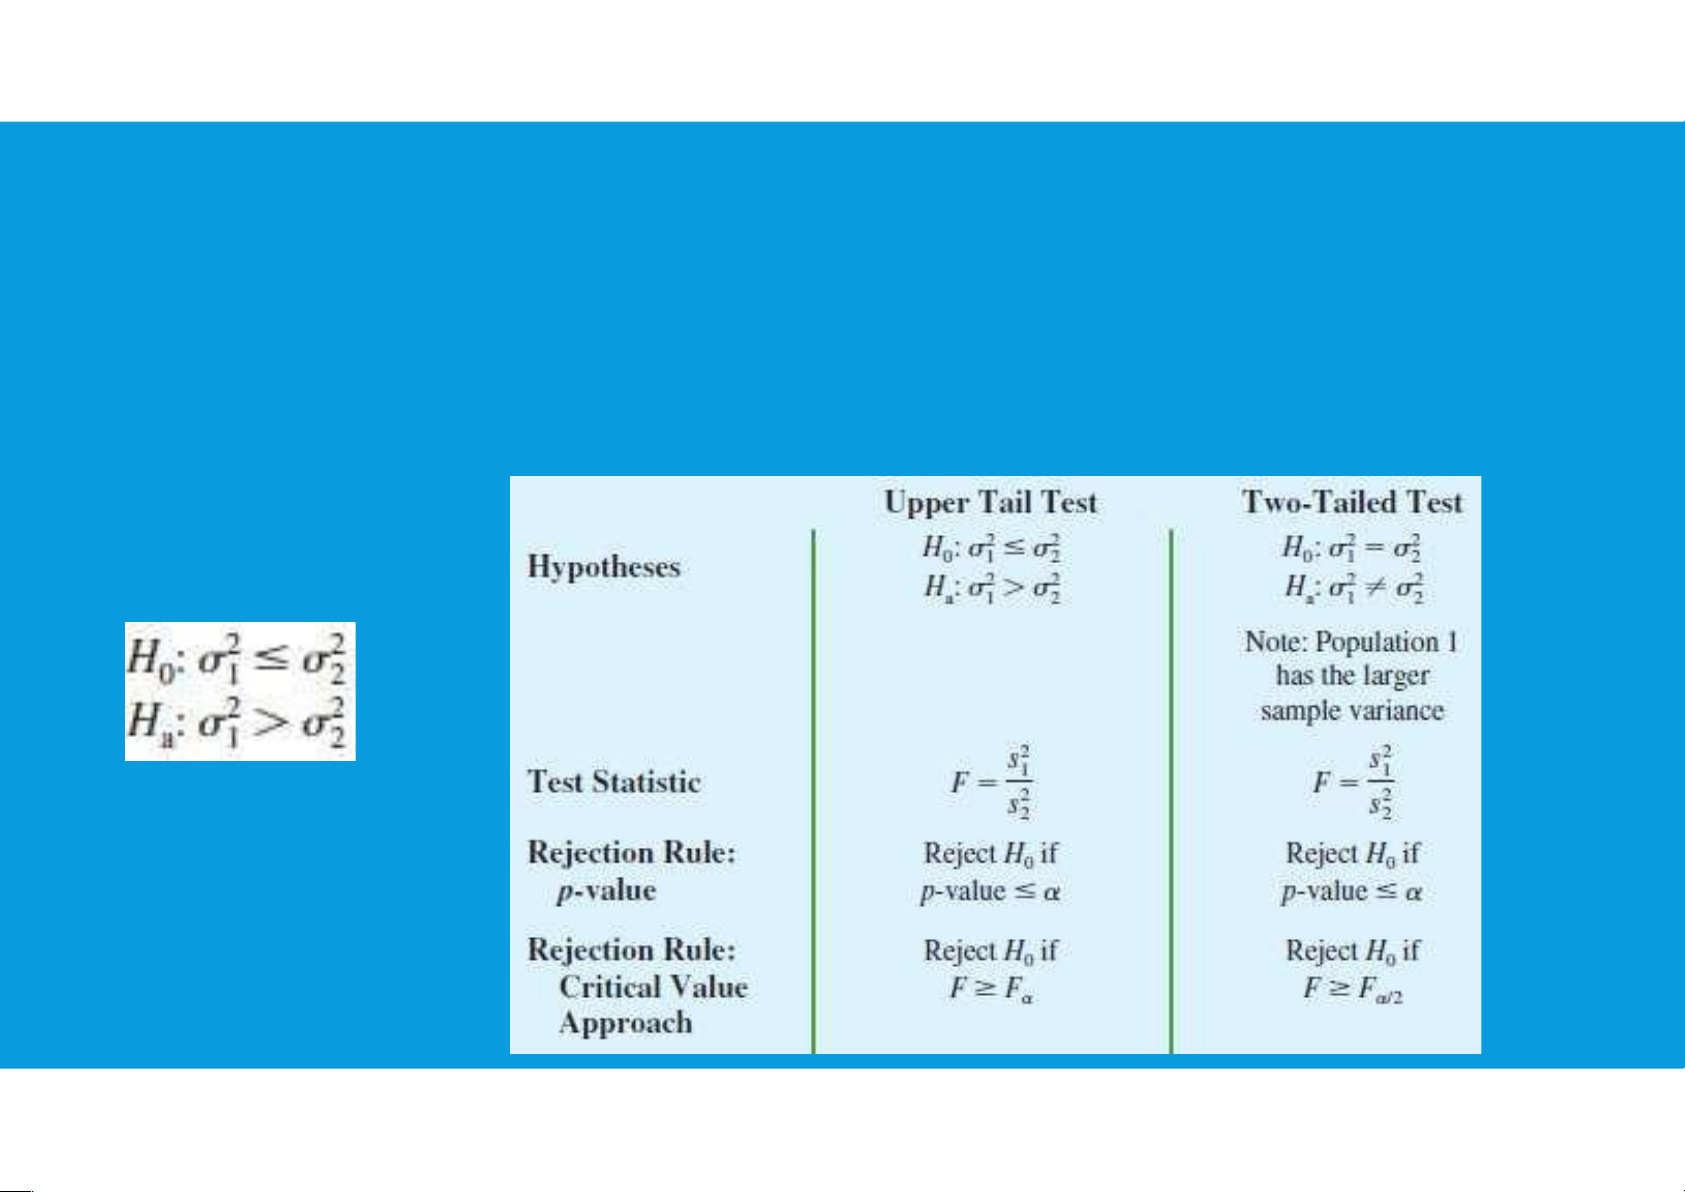
7.2. INFERENCES ABOUT TWO POPULATION VARIANCES
• One-tailed tests involving two population variances are also possible. In this case, we use the F
distribution to determine whether one population variance is significantly greater than the other.
• A one-tailed hypothesis test about two population variances will always be formulated as an upper tail test. •Hypothesis Testing: 17 lOMoAR cPSD| 45903860
7.2. INFERENCES ABOUT TWO POPULATION VARIANCES 18 lOMoAR cPSD| 45903860
7.2. INFERENCES ABOUT TWO POPULATION VARIANCES 19
Tài liệu liên quan:
-

Data and Statistics | Bài giảng số 1 chương 1 học phần Applied statistics | Trường Đại học Quốc tế, Đại học Quốc gia Thành phố Hồ Chí Minh
266 133 -

Data and Statistics | Bài giảng số 2 chương 1 học phần Applied statistics | Trường Đại học Quốc tế, Đại học Quốc gia Thành phố Hồ Chí Minh
361 181 -

Plotting and Smoothing data | Bài giảng số 3 chương 2 học phần Applied statistics | Trường Đại học Quốc tế, Đại học Quốc gia Thành phố Hồ Chí Minh
203 102 -

Descriptive statistics | Bài giảng số 4 chương 3 học phần Applied statistics | Trường Đại học Quốc tế, Đại học Quốc gia Thành phố Hồ Chí Minh
207 104 -

Descriptive statistics | Bài giảng số 5 chương 3 học phần Applied statistics | Trường Đại học Quốc tế, Đại học Quốc gia Thành phố Hồ Chí Minh
242 121