Lecture 13 - ENEE1006IU
Tài liệu học tập môn Applied statistics (ENEE1006IU) tại Trường Đại học Quốc tế, Đại học Quốc gia Thành phố Hồ Chí Minh. Tài liệu gồm 32 trang giúp bạn ôn tập hiệu quả và đạt điểm cao! Mời bạn đọc đón xem!
Môn: Applied statistics (ENEE1006IU) 47 tài liệu
Trường: Trường Đại học Quốc tế, Đại học Quốc gia Thành phố Hồ Chí Minh 1.9 K tài liệu
Tác giả:


Preview text:
lOMoARcPSD|364 906 32 APPLIED STATISTICS COURSE CODE: ENEE1006IU Lecture 13:
Chapter 7: Analysis of Variance (ANOVA)
(3 credits: 2 is for lecture, 1 is for lab-work)
Instructor: TRAN THANH TU Email: tttu@hcmiu.edu.vn tttu@hcmiu.edu.vn 1 lOMoARcPSD|364 906 32
CHAPTER 7: ANALYSIS OF VARIANCE (ANOVA)
•7.1. Inferences about a population variance
•7.2. Inferences about two population variances
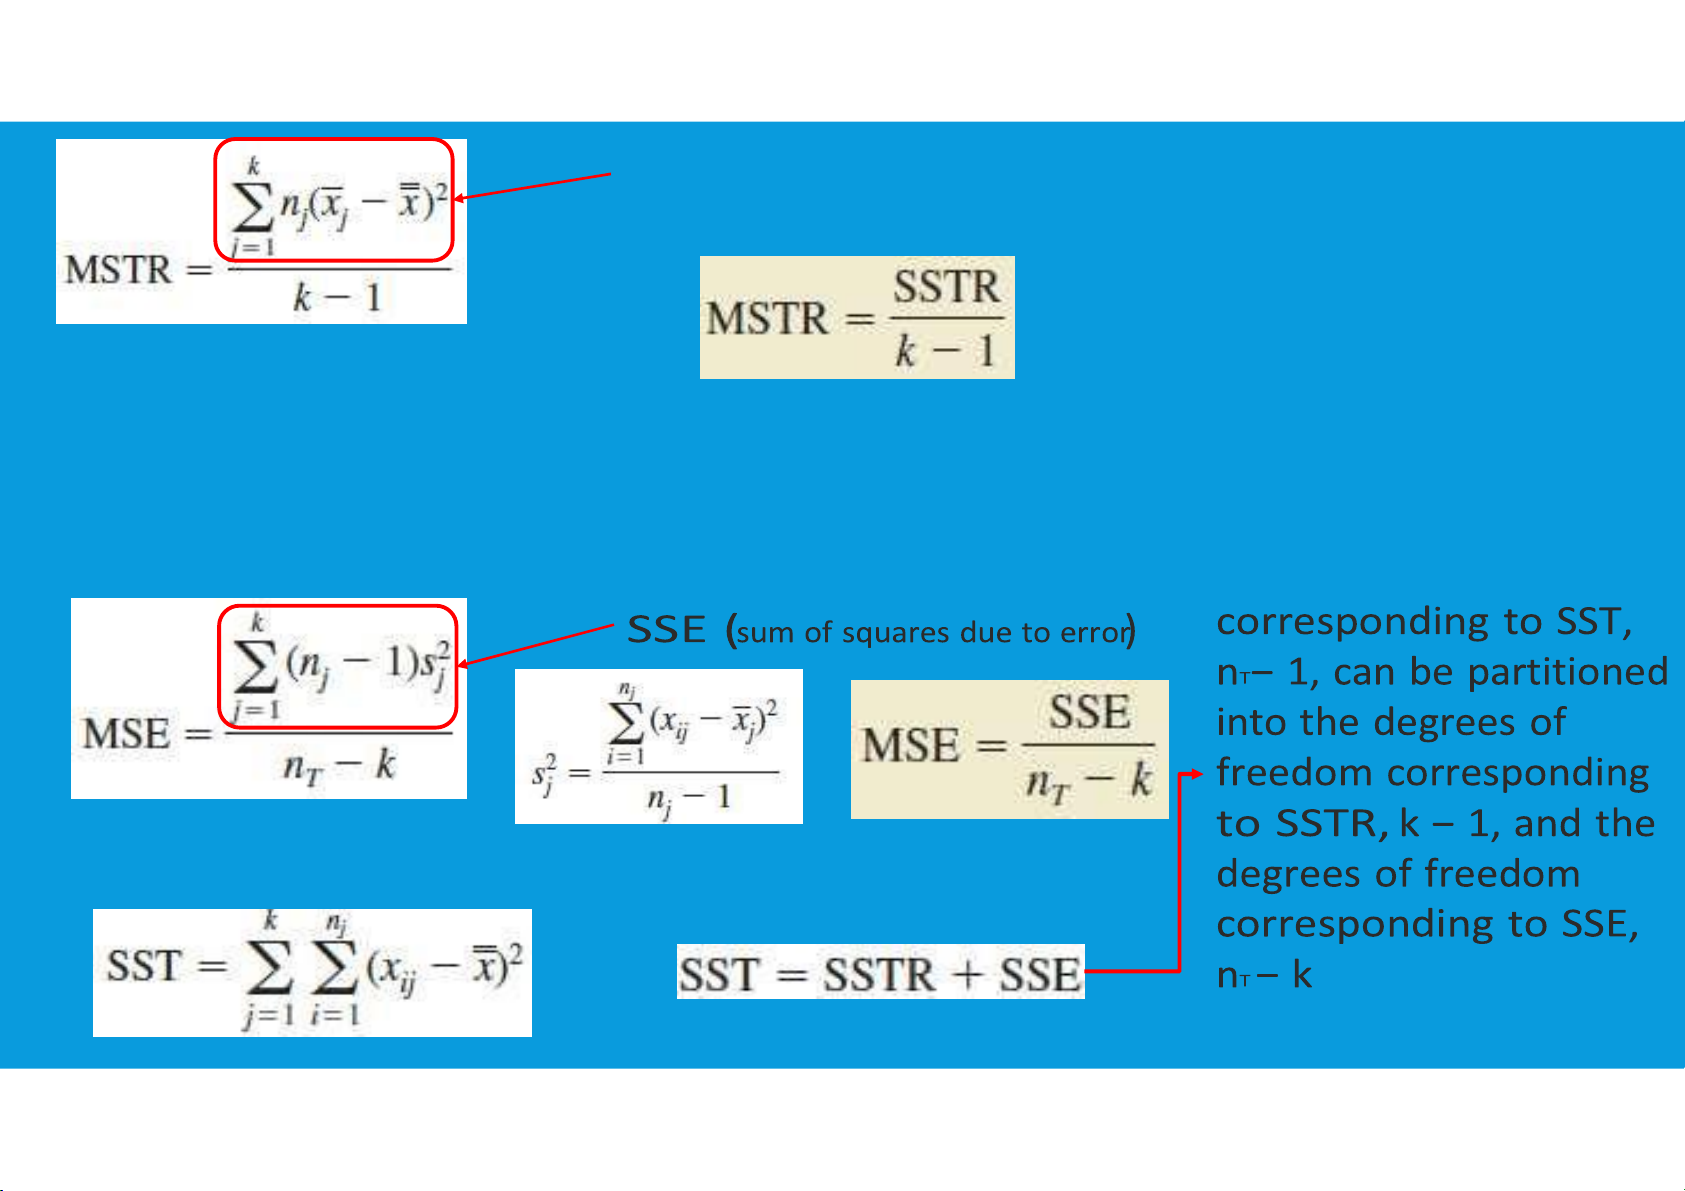
•7.3. Assumptions for analysis of variance •7.4. A conceptual overview •7.5. ANOVA table •7.6. ANOVA procedure 7.5. ANOVA TABLE •Total Sum Square (TSS): tttu@hcmiu.edu.vn 2 lOMoARcPSD|364 906 32 SSTR (sum of squares due to treatments) the degrees of freedom tttu@hcmiu.edu.vn 3 lOMoARcPSD|364 906 32 7.5. ANOVA TABLE •Total Sum Square (TSS):
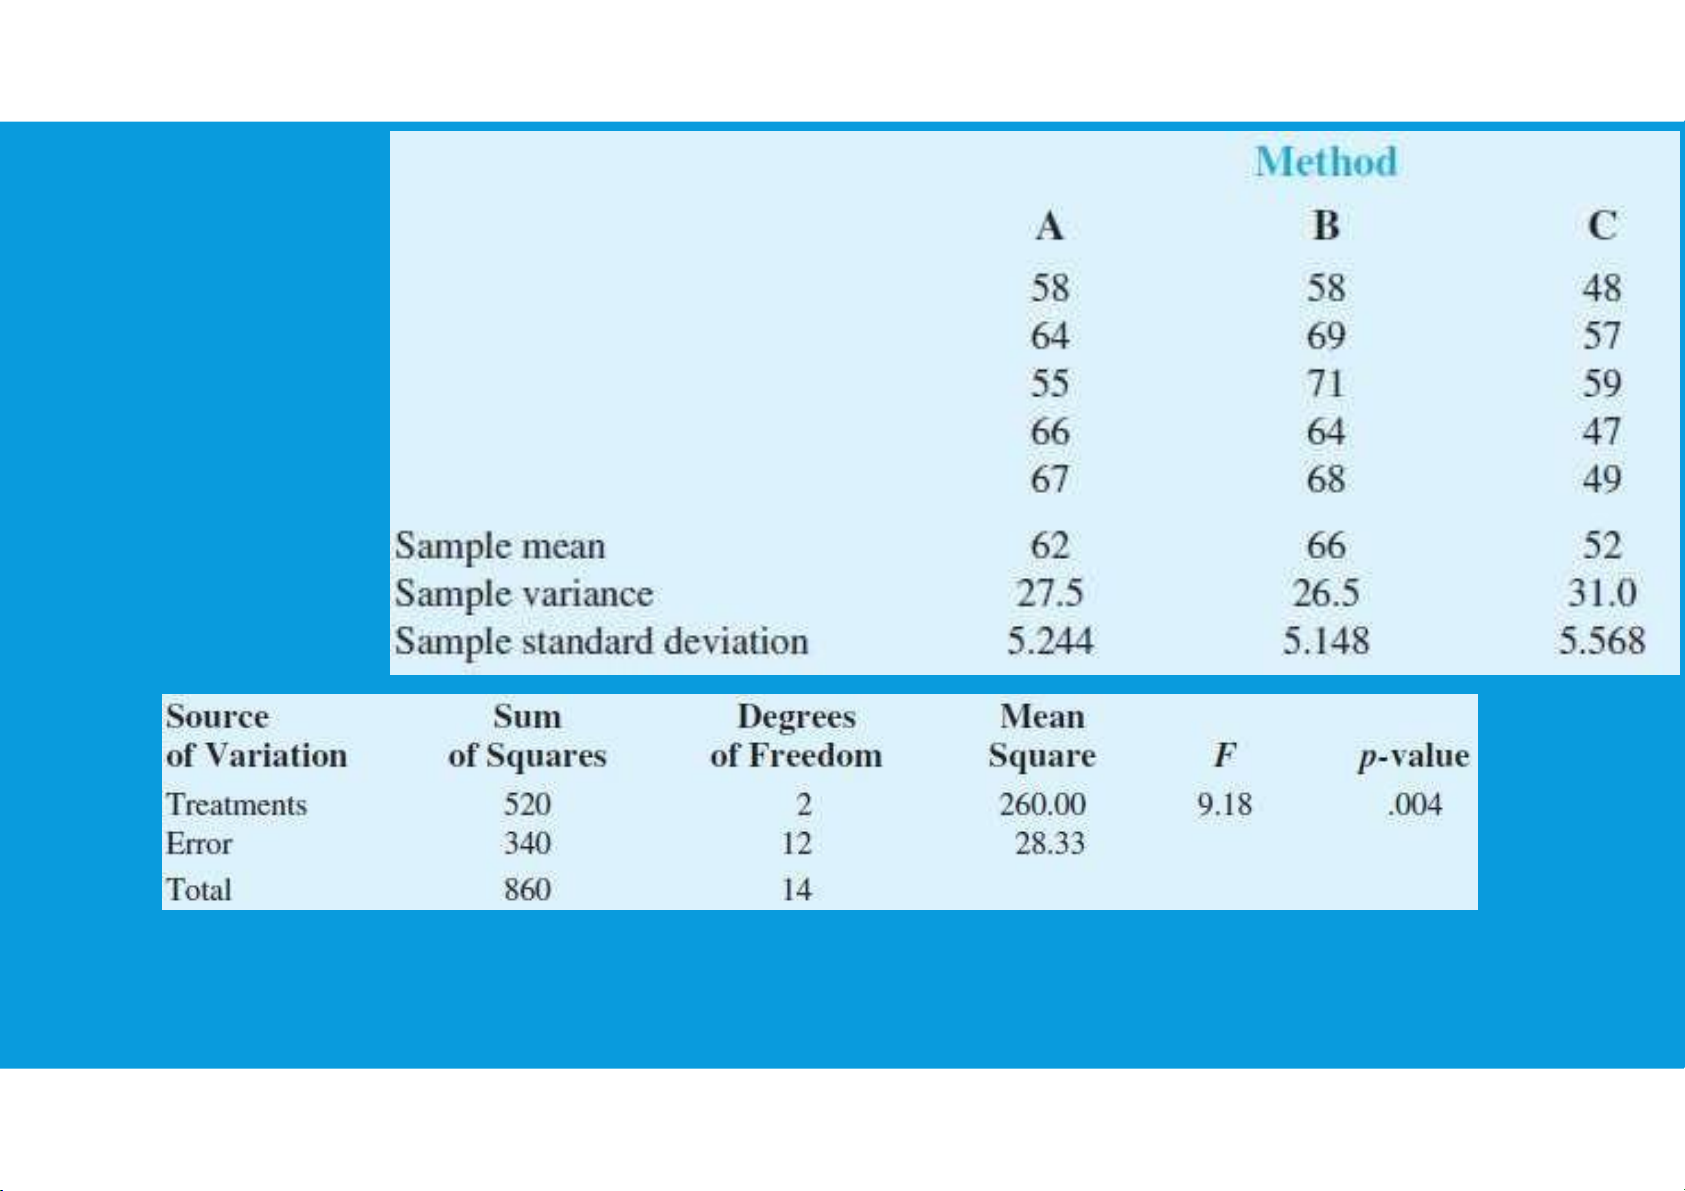
•The analysis of variance can be viewed as the process of partitioning the total sum
of squares and the degrees of freedom into their corresponding sources: treatments and error.
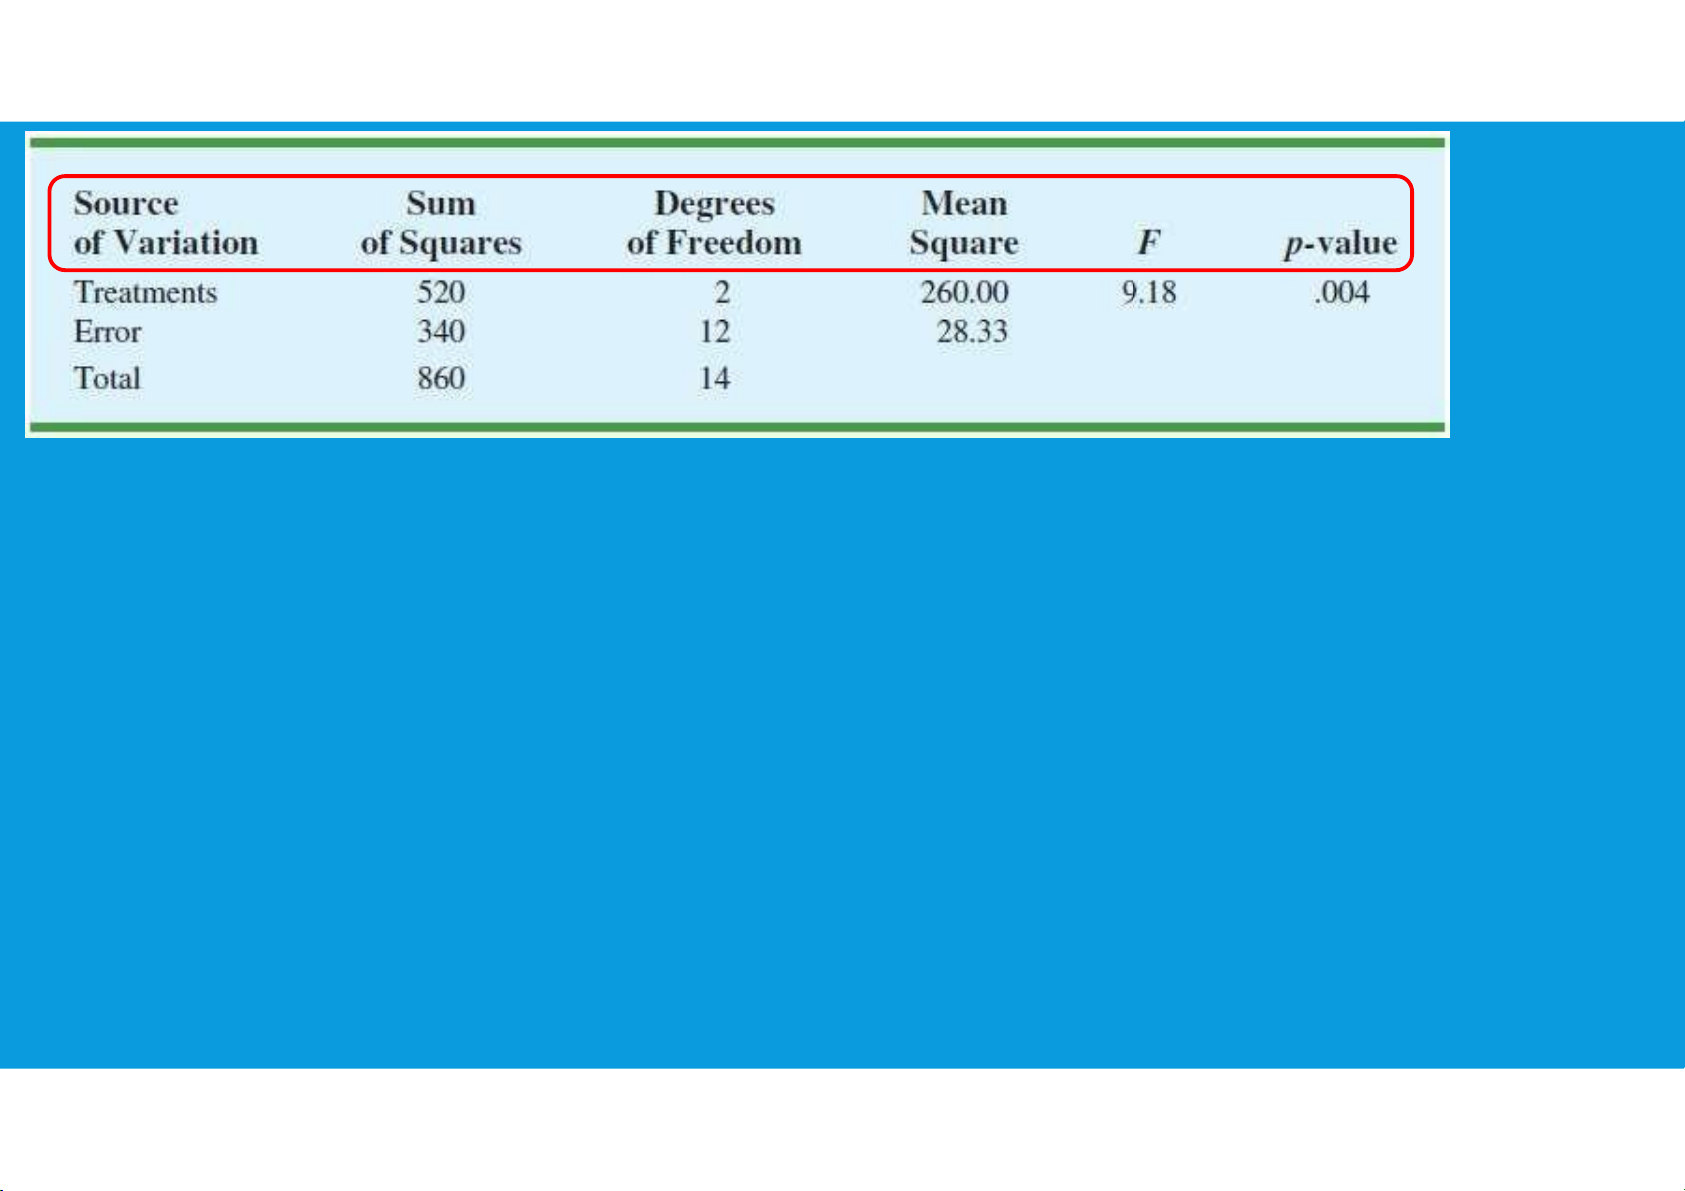
•Dividing the sum of squares by the appropriate degrees of freedom provides the
variance estimates, the F value, and the p-value used to test the hypothesis of equal population means. •ANOVA TABLE: tttu@hcmiu.edu.vn 4 lOMoARcPSD|364 906 32
MULTIPLE COMPARISON PROCEDURES
•When we use analysis of variance to test whether the means of k populations are
equal, rejection of the null hypothesis allows us to conclude only that the
population means are not all equal.
•In some cases we will want to go a step further and determine where the
differences among means occur.
•The purpose of this section is to show how multiple comparison procedures can
be used to conduct statistical comparisons between pairs of population means. tttu@hcmiu.edu.vn 5 lOMoARcPSD|364 906 32
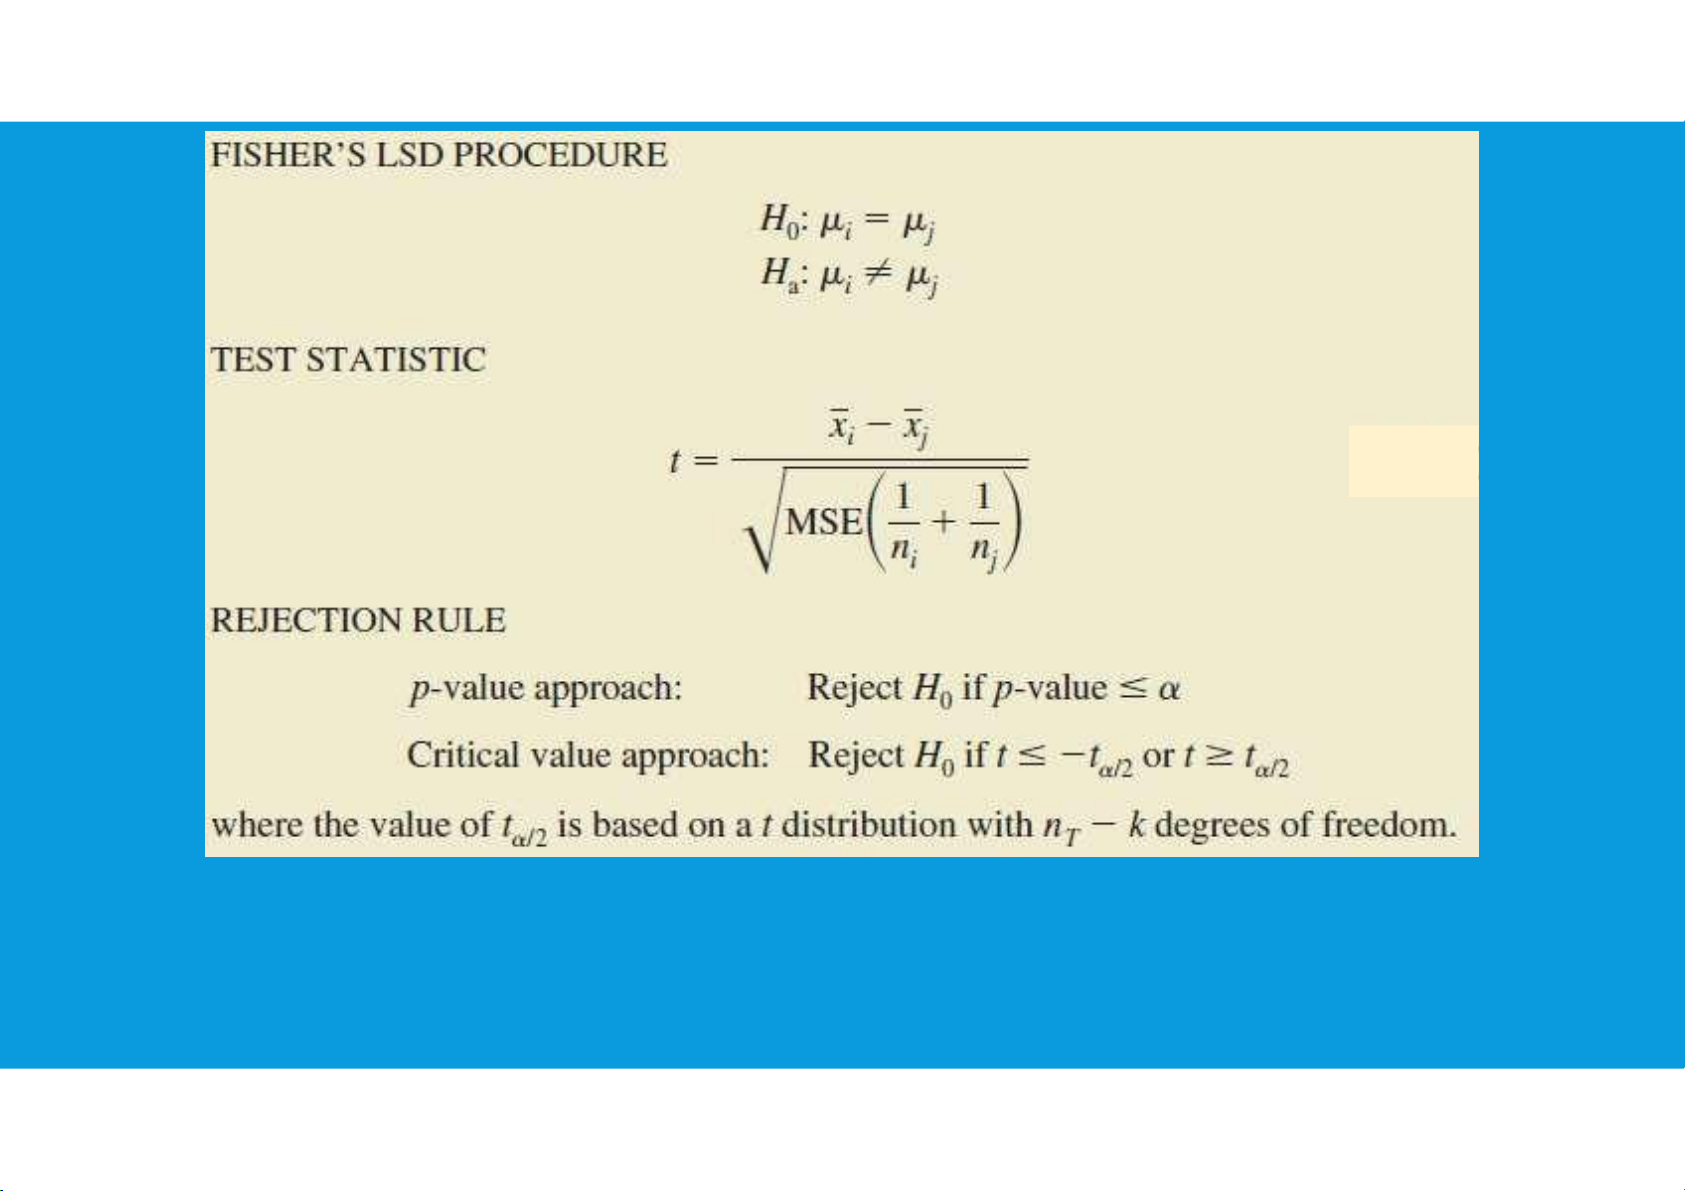
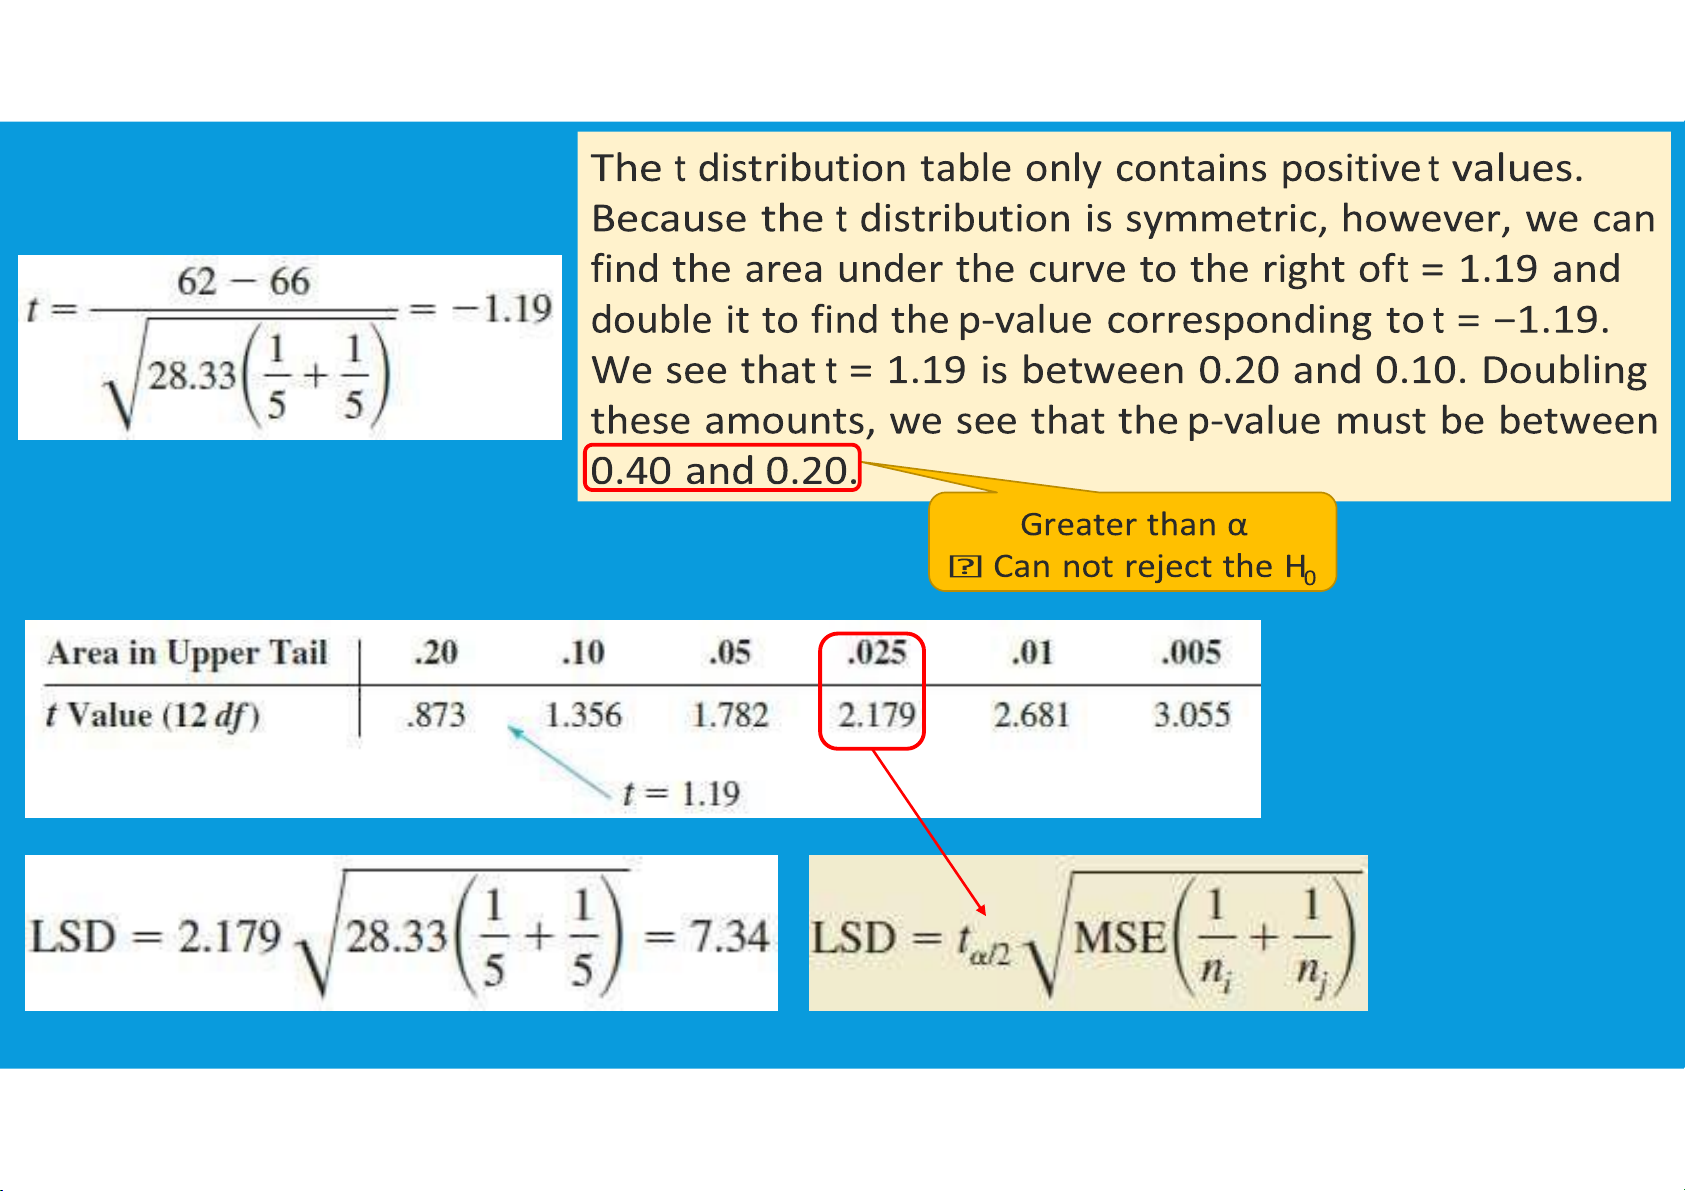
Fisher’s least significant difference (LSD) procedure can be used to determine
where the differences occur (pairwise comparisons)
MULTIPLE COMPARISON PROCEDURES
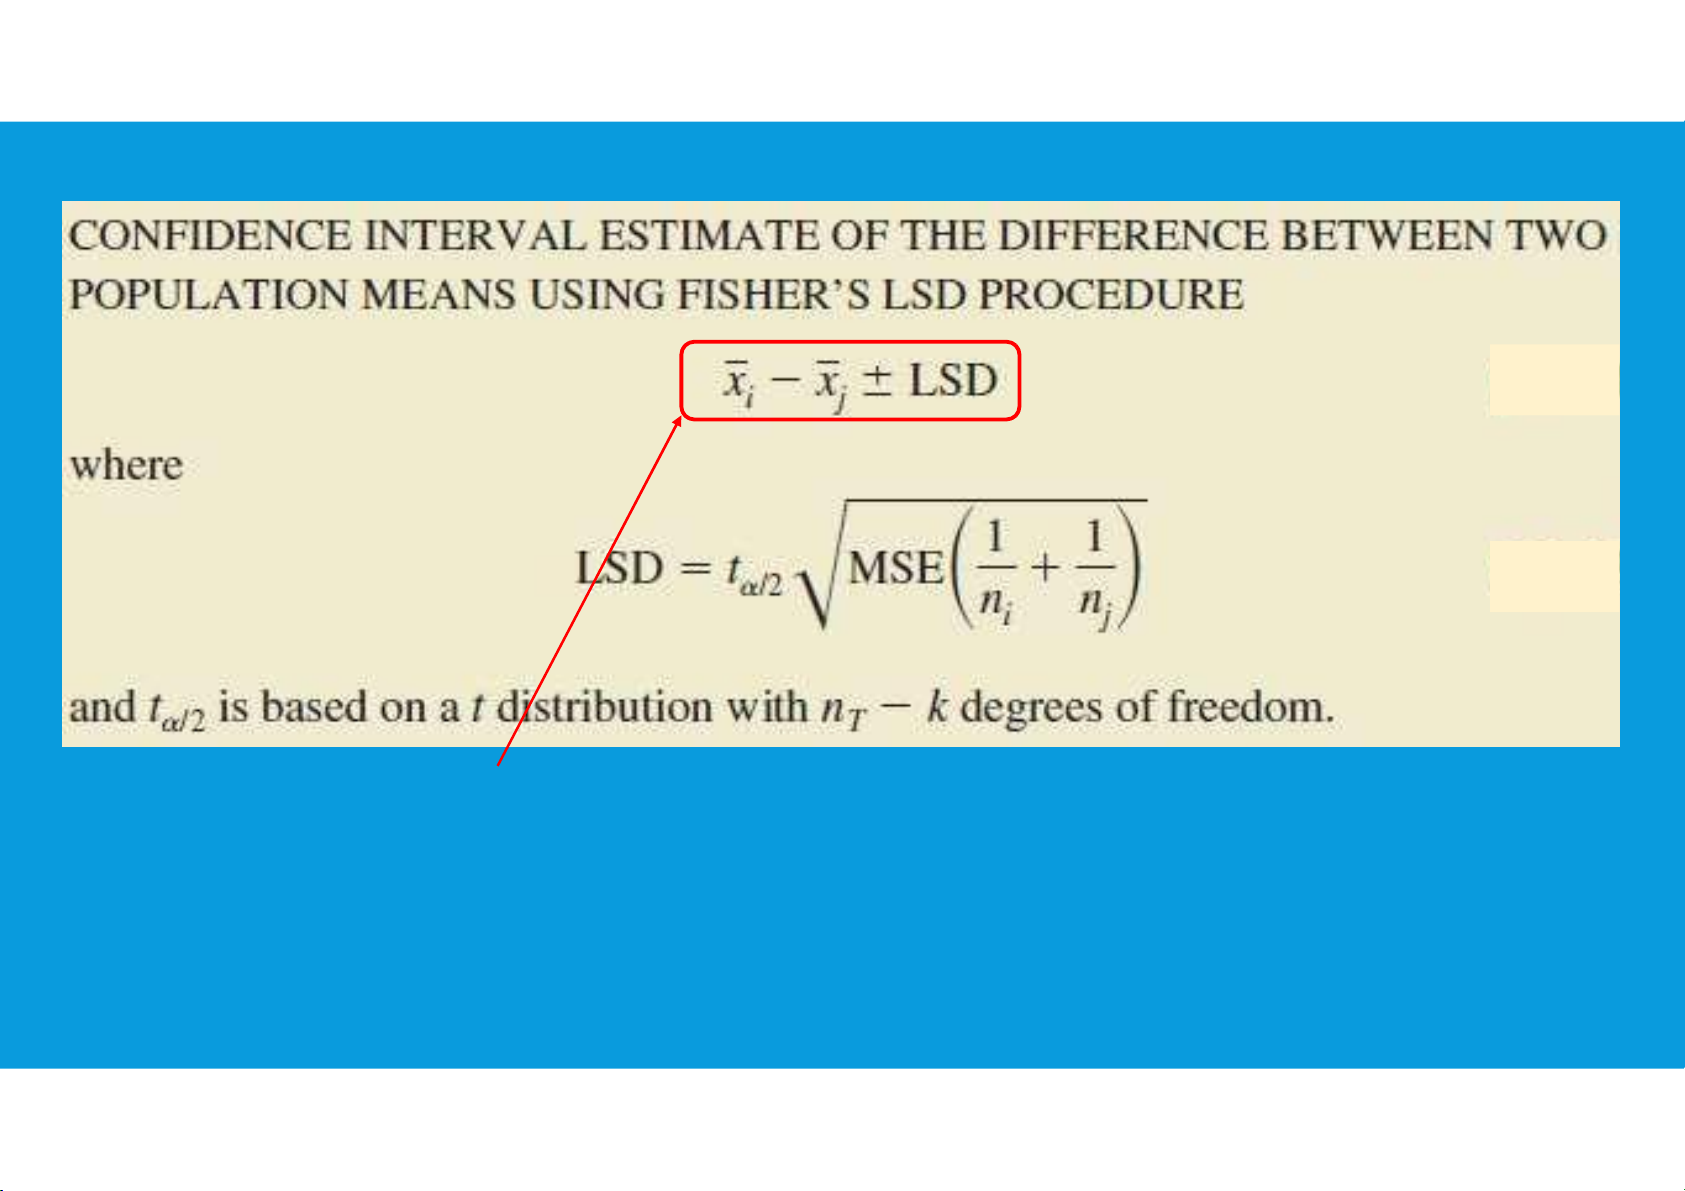
Fisher’s least significant difference (LSD) procedure: tttu@hcmiu.edu.vn 6 lOMoARcPSD|364 906 32 tttu@hcmiu.edu.vn 7 lOMoARcPSD|364 906 32
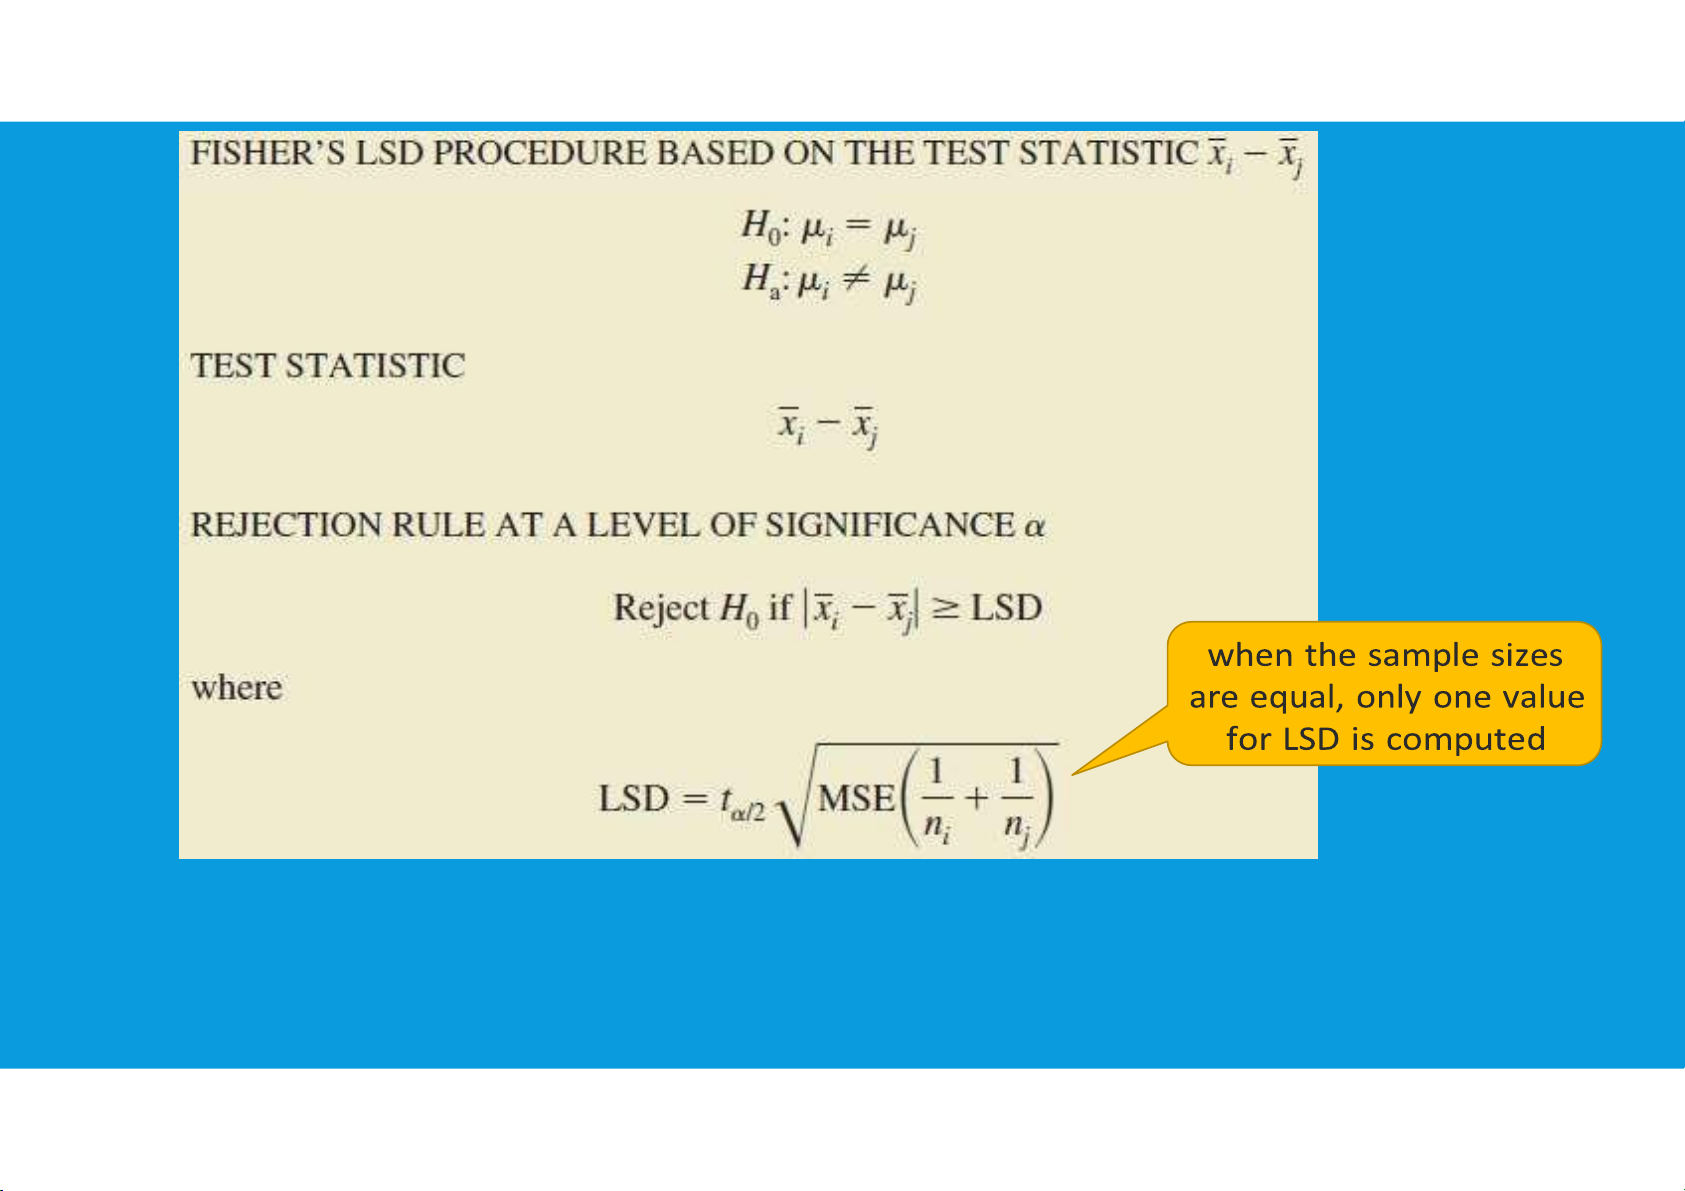
MULTIPLE COMPARISON PROCEDURES
Fisher’s least significant difference (LSD) procedure: tttu@hcmiu.edu.vn 8 lOMoARcPSD|364 906 32 tttu@hcmiu.edu.vn 9 lOMoARcPSD|364 906 32 EXAMPLE tttu@hcmiu.edu.vn 10 lOMoARcPSD|364 906 32 tttu@hcmiu.edu.vn 11 lOMoARcPSD|364 906 32
MULTIPLE COMPARISON PROCEDURES
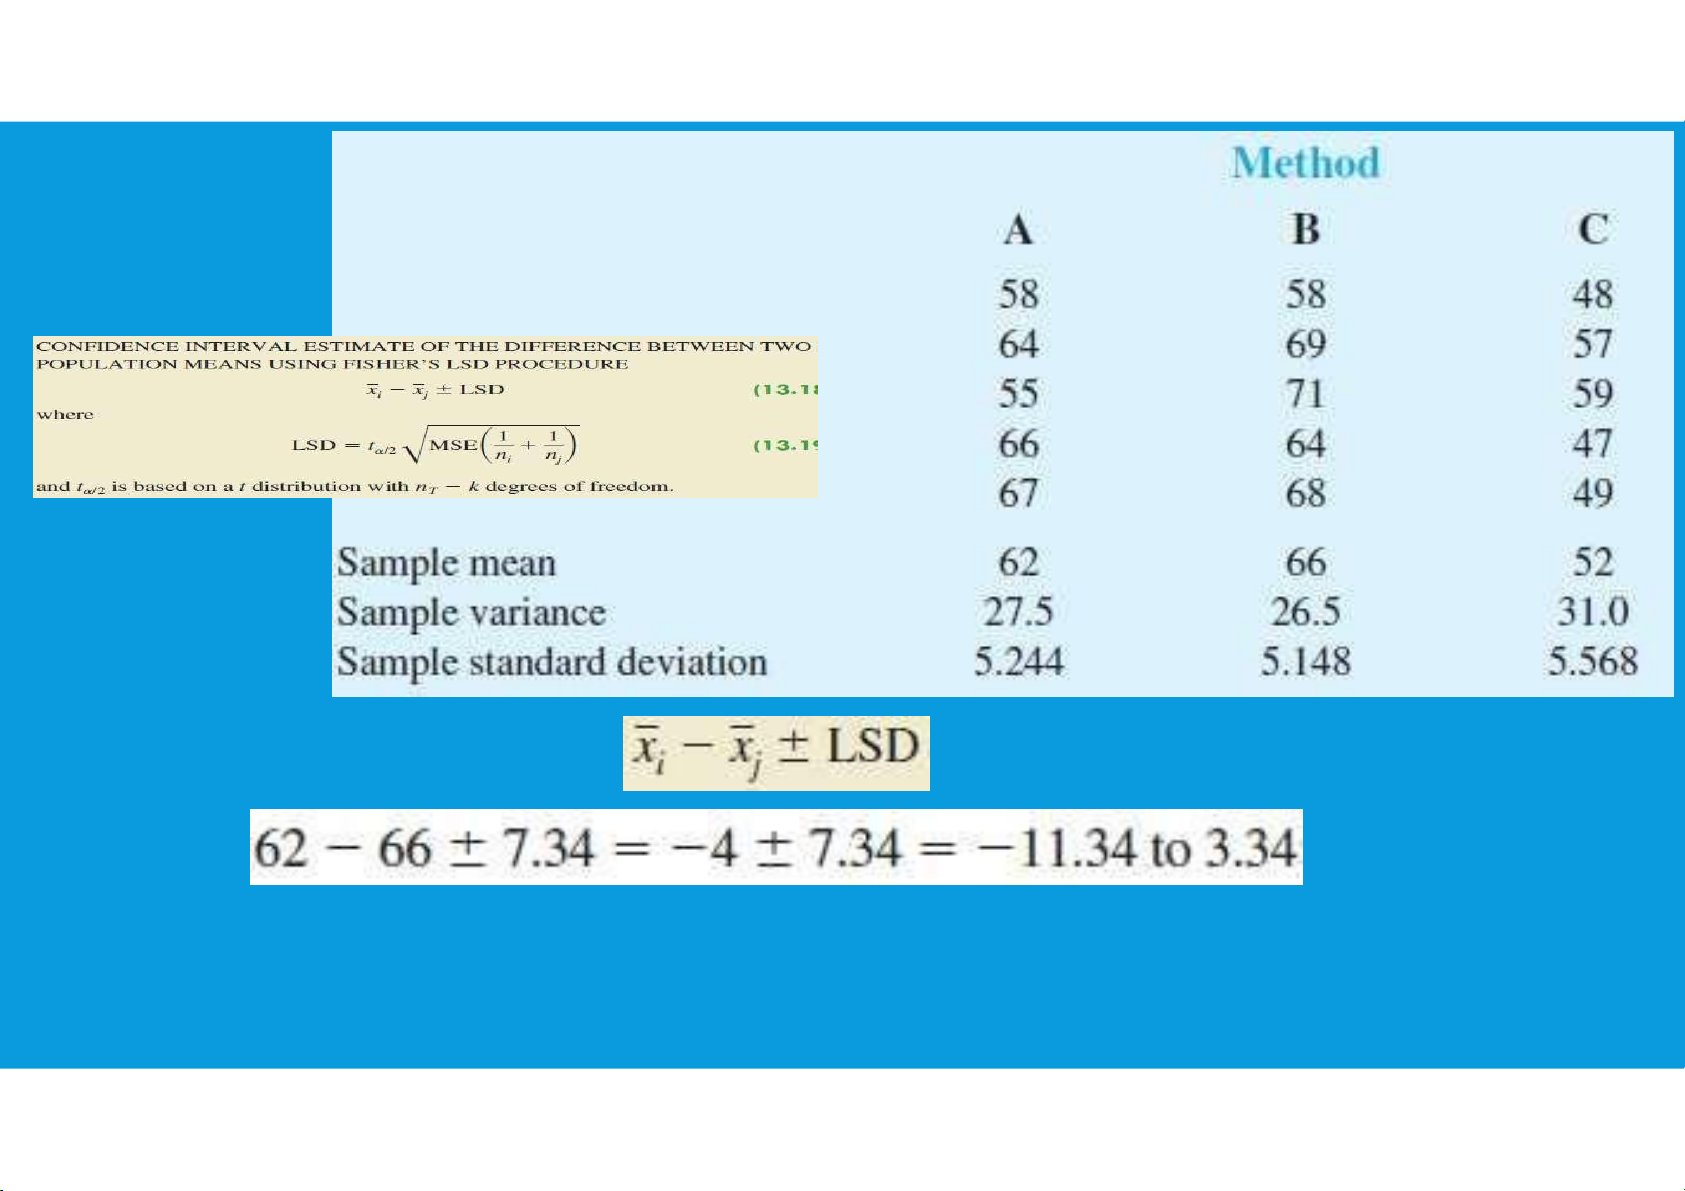
- If the confidence interval includes the value zero, we cannot reject the
hypothesis that the two population means are equal. tttu@hcmiu.edu.vn 12 lOMoARcPSD|364 906 32
- If the confidence interval does not include the value zero, we conclude that
there is a difference between the population means. tttu@hcmiu.edu.vn 13 lOMoARcPSD|364 906 32 tttu@hcmiu.edu.vn 14 lOMoARcPSD|364 906 32
cannot reject the hypothesis that the two population means of A and B are equal tttu@hcmiu.edu.vn 15 lOMoARcPSD|364 906 32 PAIRWISE COMPARISONS
• In discussing multiple comparison procedures we refer to this probability of a Type I error (α
= 0.05) as the comparisonwise Type I error rate;
• Comparisonwise Type I error rates indicate the level of significance associated with a single pairwise comparison.
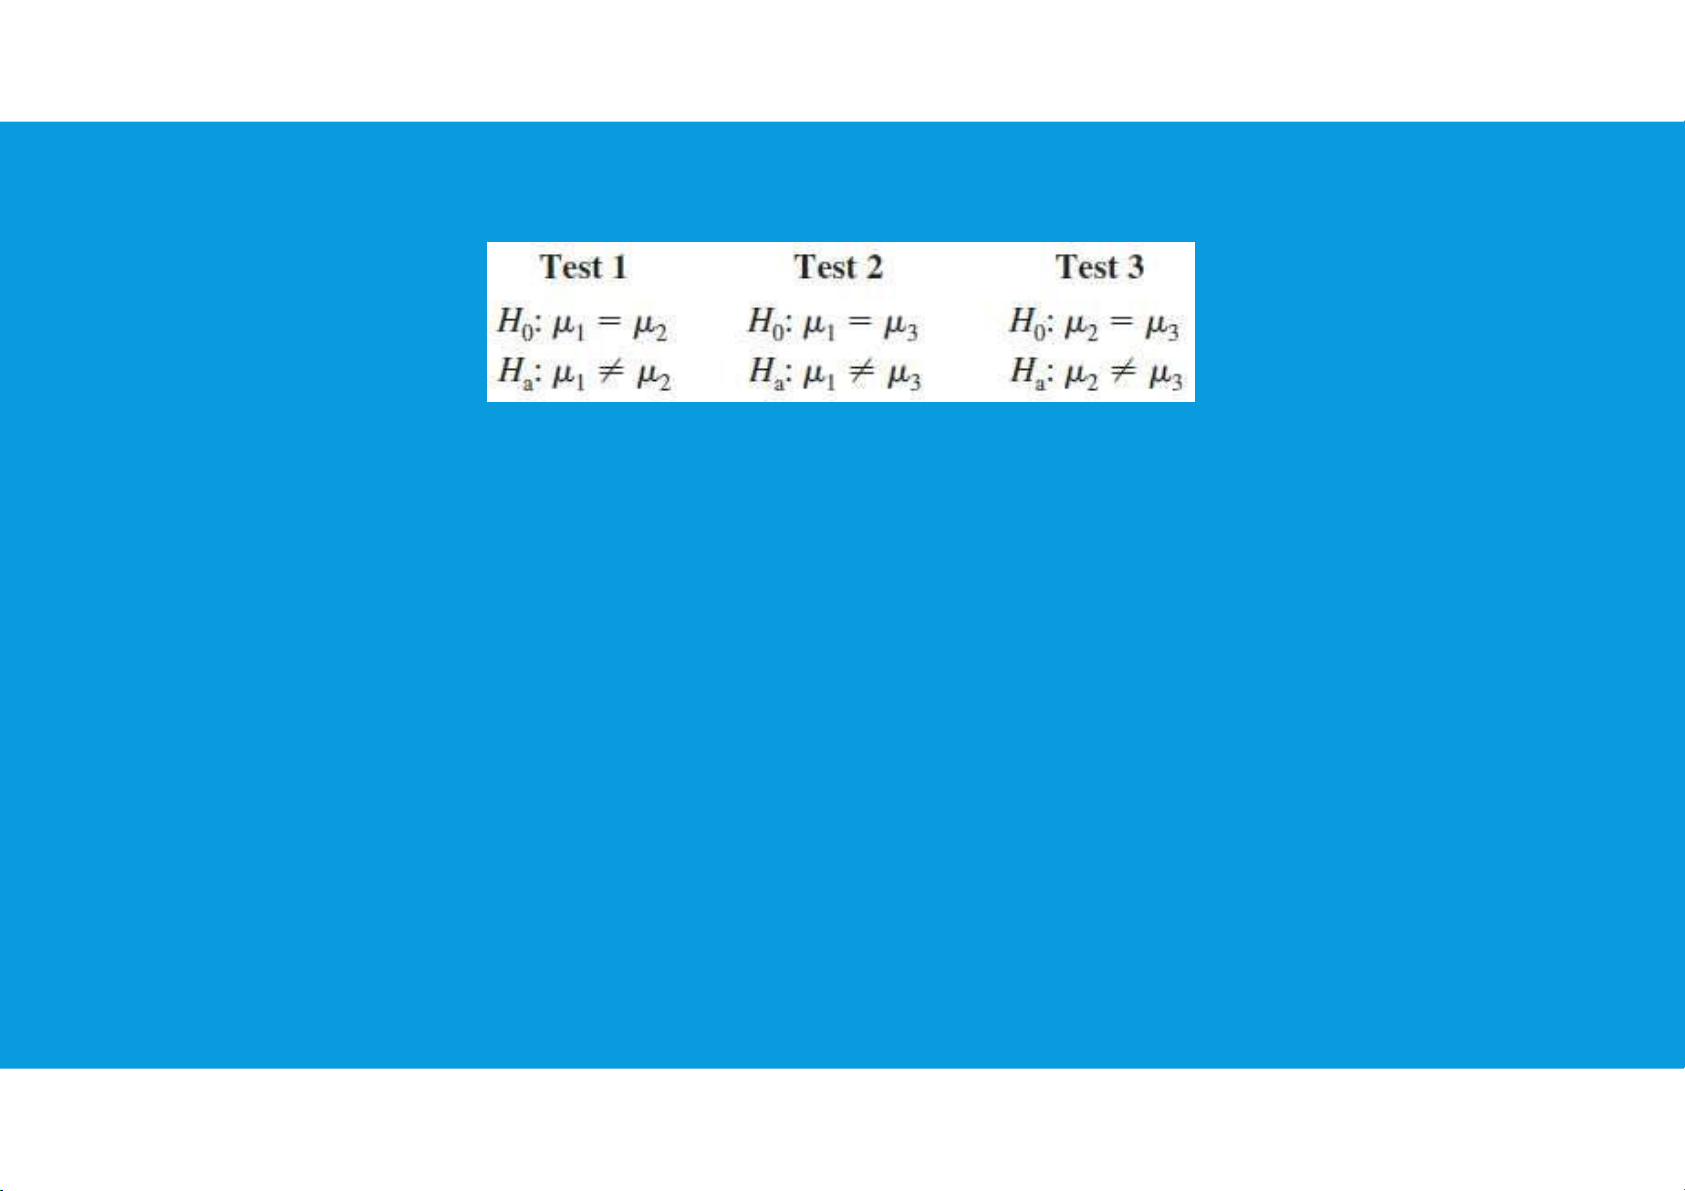
• What is the probability that in making three pairwise comparisons, we will commit a Type I
error on at least one of the three tests?
• The probability that we will not make a Type I error on any of the three tests is (0.95)(0.95)(0.95) = 0.8574 16 lOMoARcPSD|364 906 32
the probability of making at least one Type I error is 1 − 0.8574 = 0.1426 overall or
experimentwise Type i error rate ( tttu@hcmiu.edu.vn PAIRWISE COMPARISONS
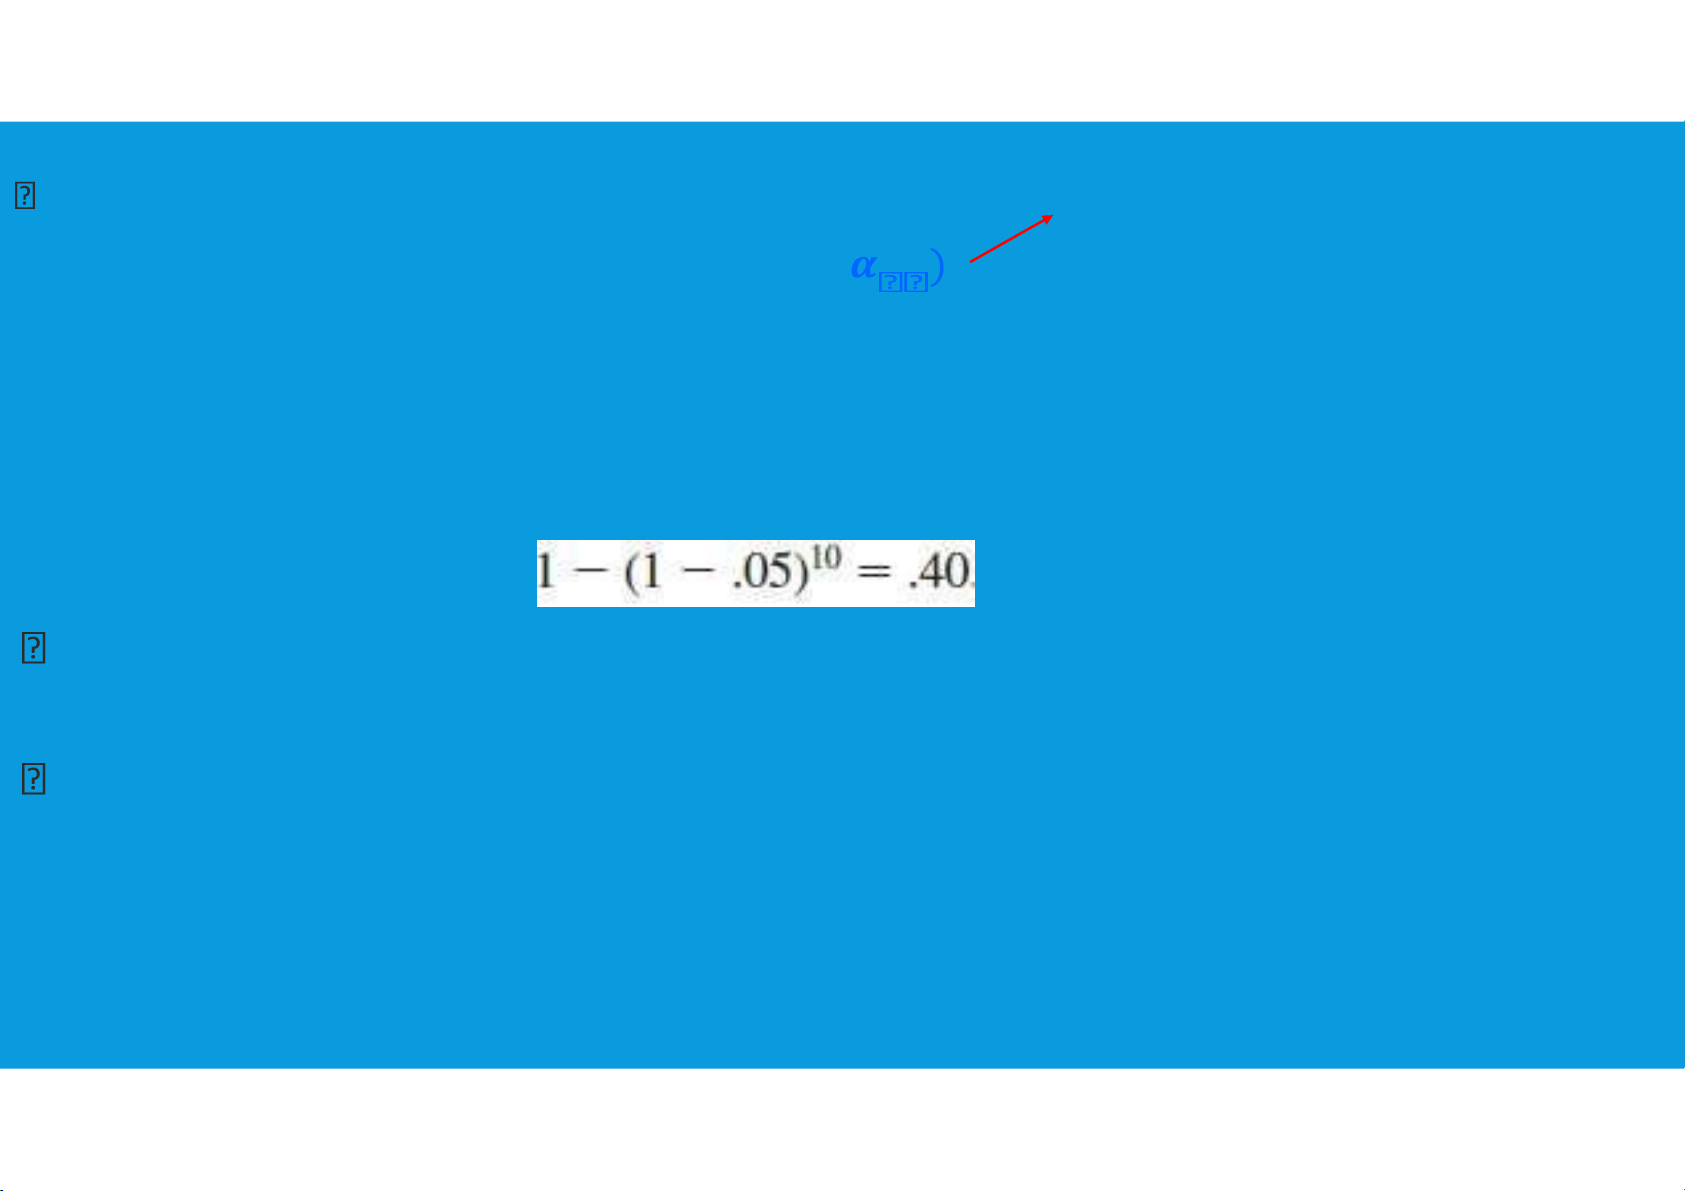
•The experimentwise Type I error rate gets larger for problems with more populations.
should look for alternatives that provide better control over the experimentwise error rate
Bonferroni adjustment: involves using a smaller comparisonwise error rate for each test: 17 lOMoARcPSD|364 906 32
•If we want to test C pairwise comparisons and want the maximum probability
of making a Type I error for the overall experiment to be , we simply use a
comparisonwise error rate equal to /C tttu@hcmiu.edu.vn
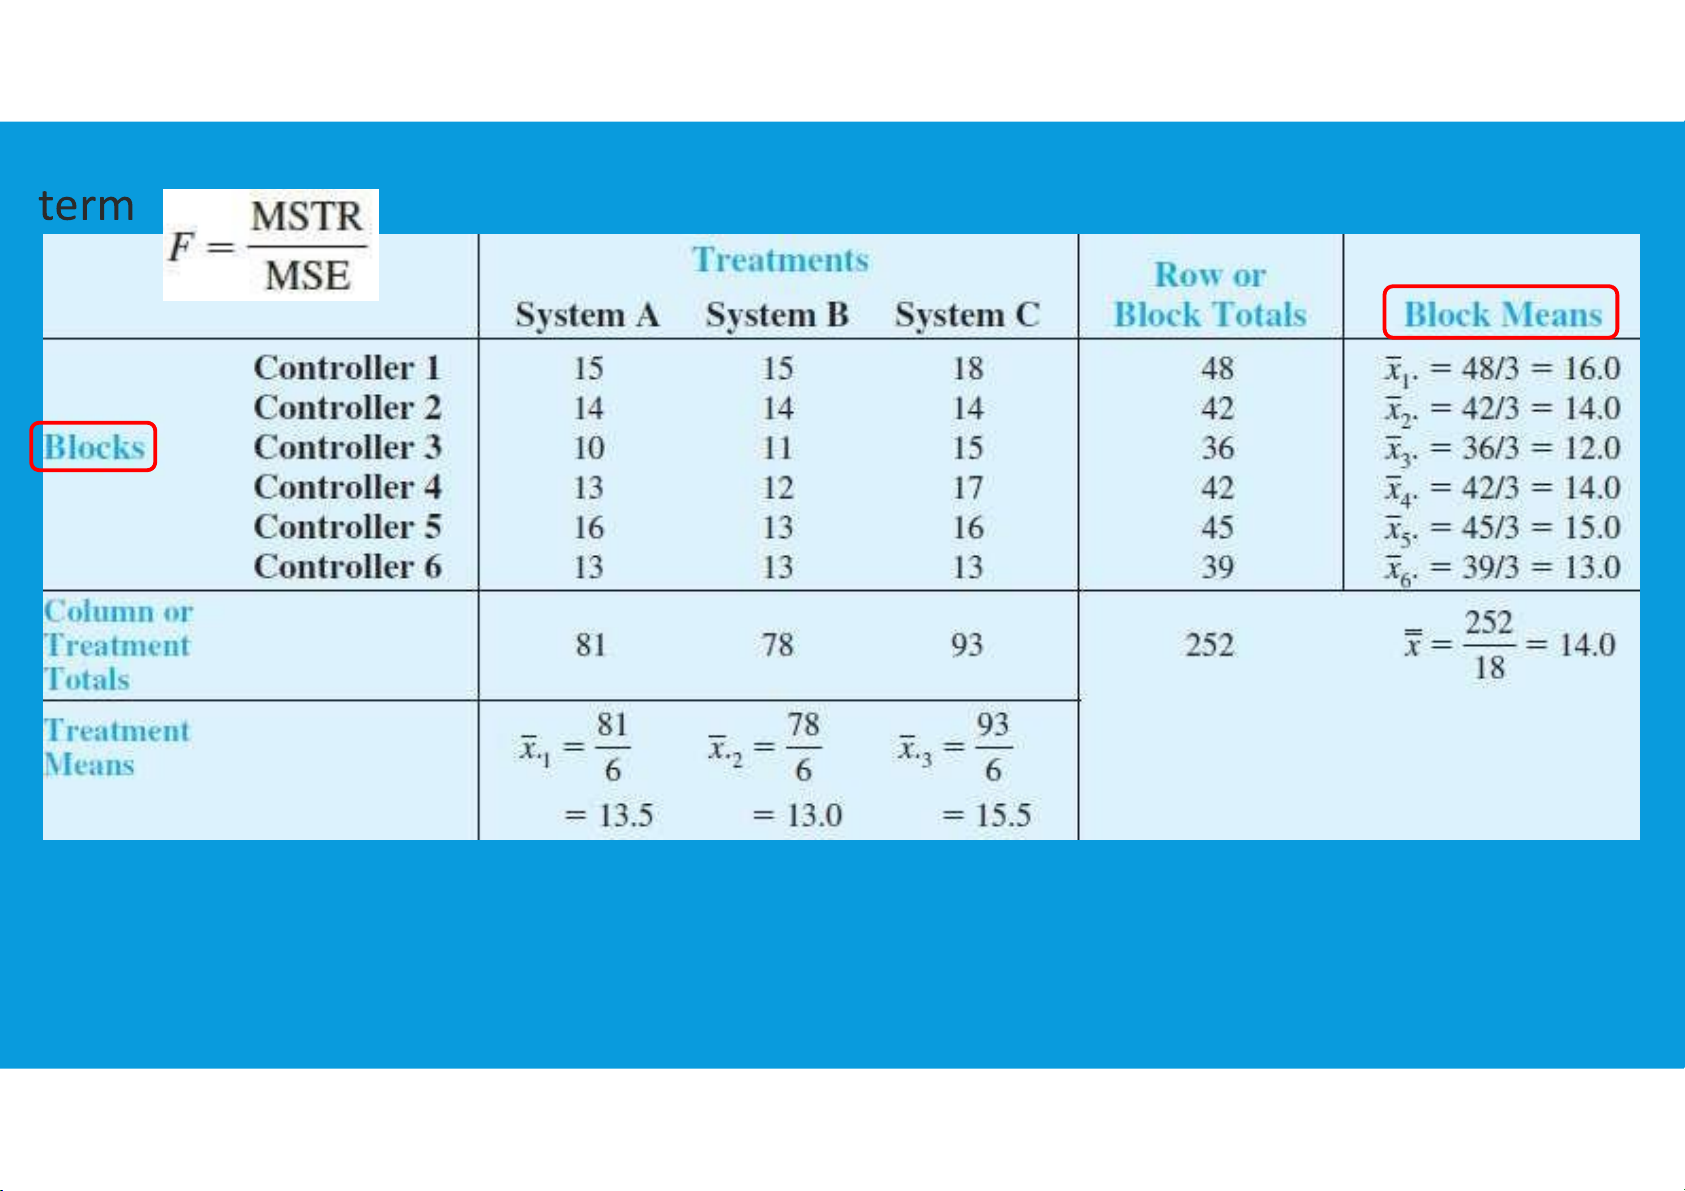
7.6. ANOVA PROCEDURE – RANDOMIZED BLOCK DESIGN
•Randomized block design: Its purpose is to control some of the extraneous
sources of variation by removing such variation from the MSE tttu@hcmiu.edu.vn 18 lOMoARcPSD|364 906 32 19 lOMoARcPSD|364 906 32
7.6. ANOVA PROCEDURE – RANDOMIZED BLOCK DESIGN
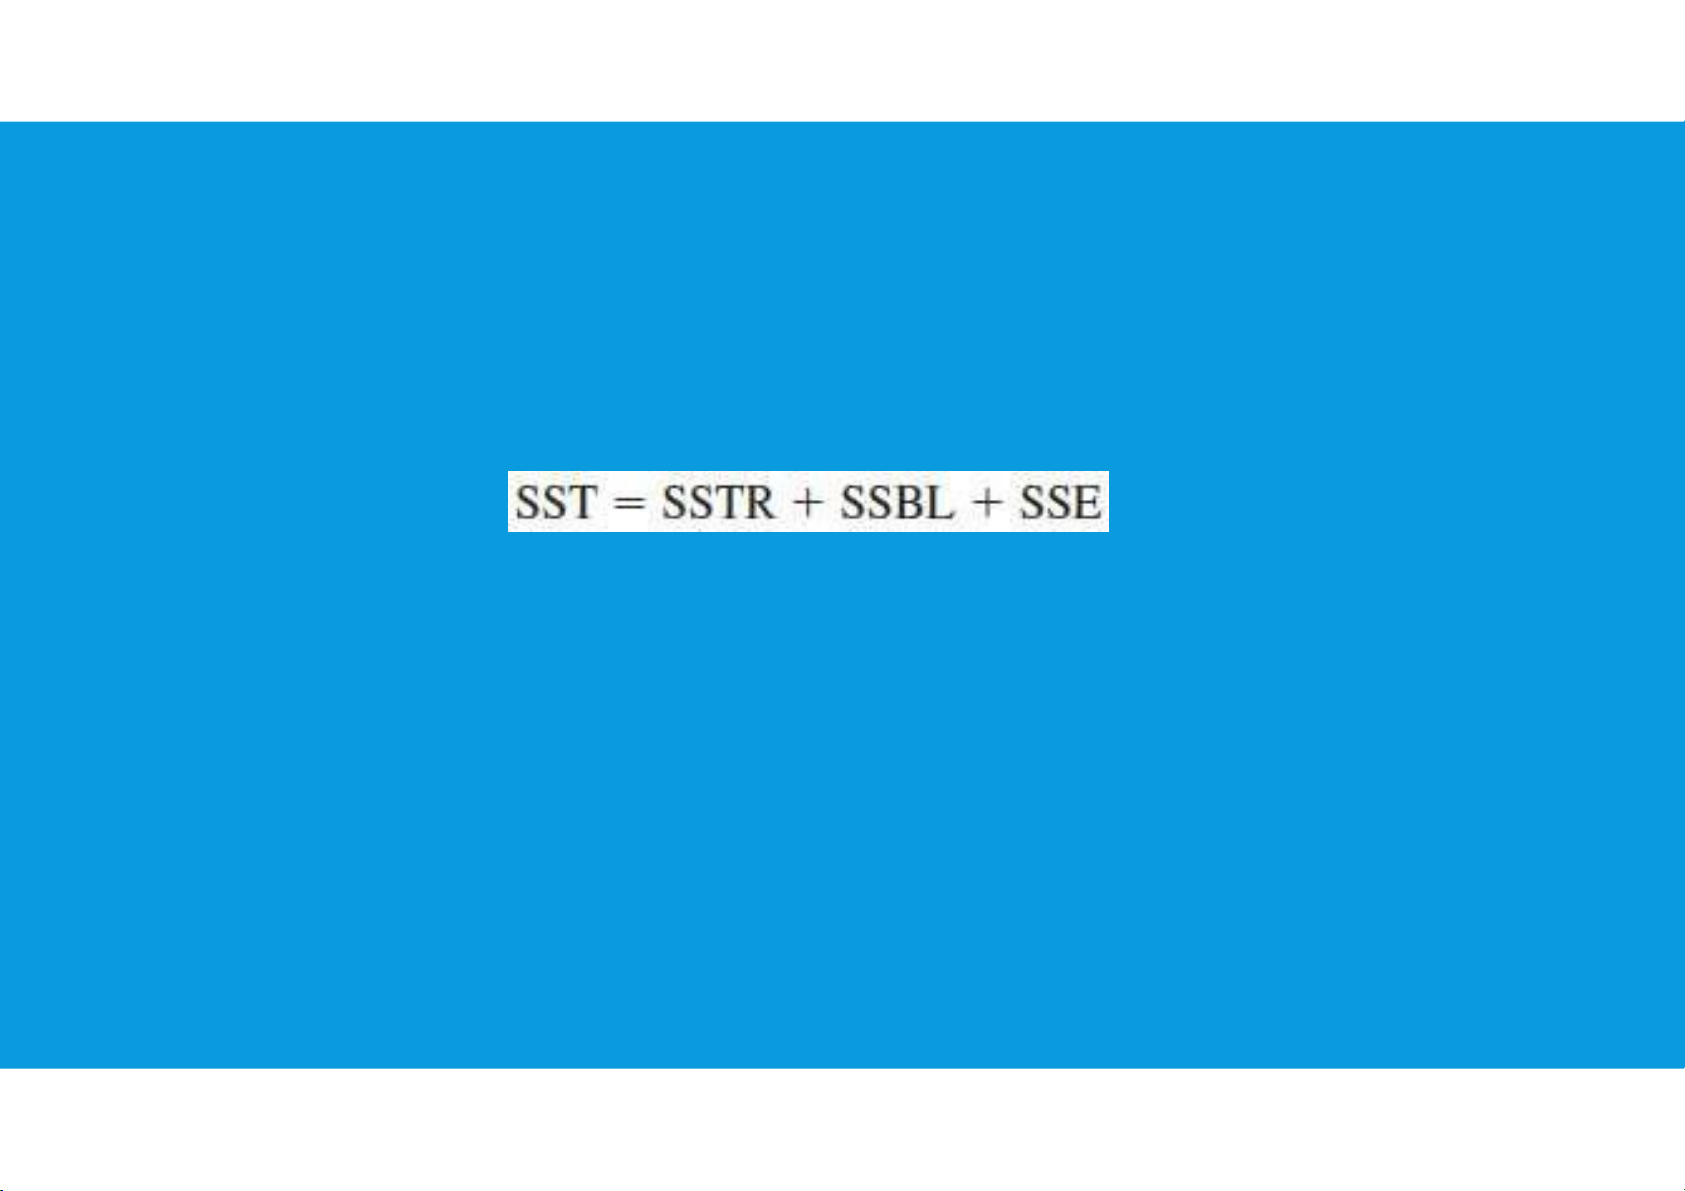
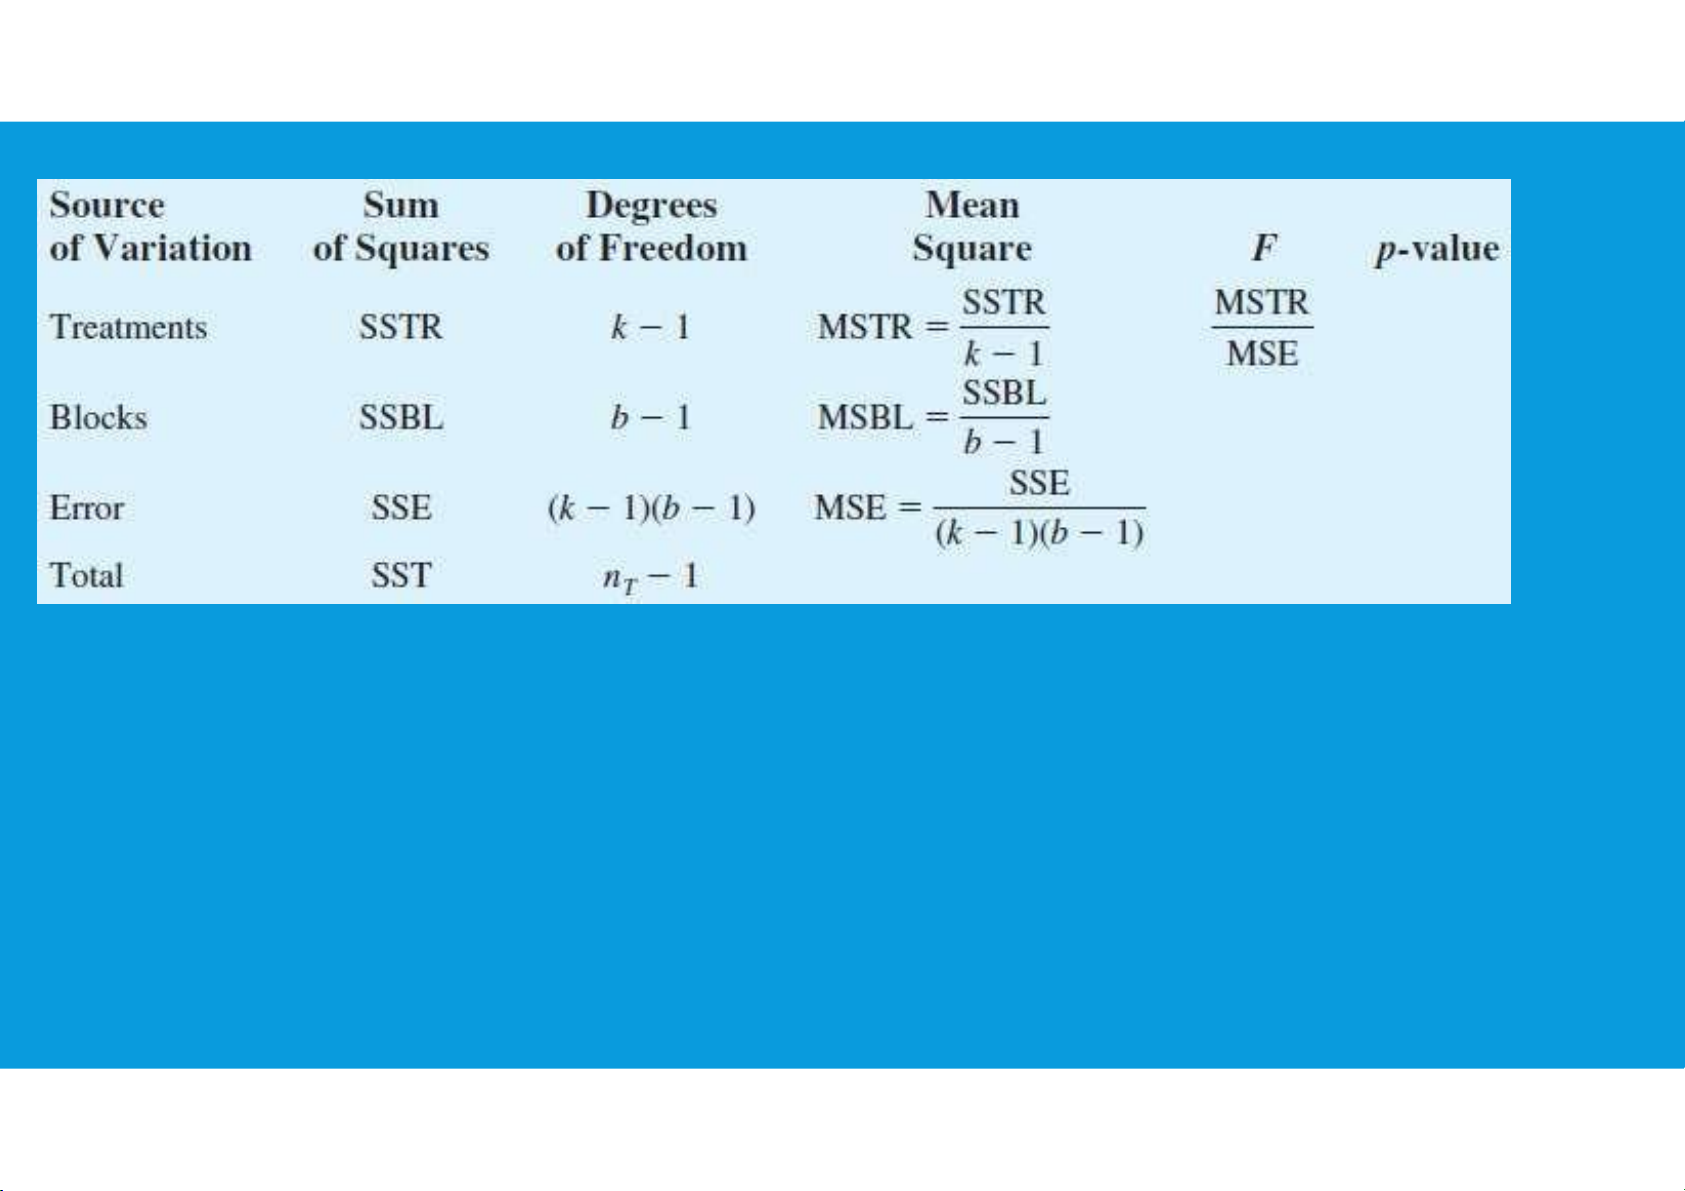
•The ANOVA procedure for the randomized block design requires us to partition
the sum of squares total (SST) into three groups: sum of squares due to
treatments (SSTR), sum of squares due to blocks (SSBL), and sum of squares due to error (SSE): tttu@hcmiu.edu.vn 20 lOMoARcPSD|364 906 32
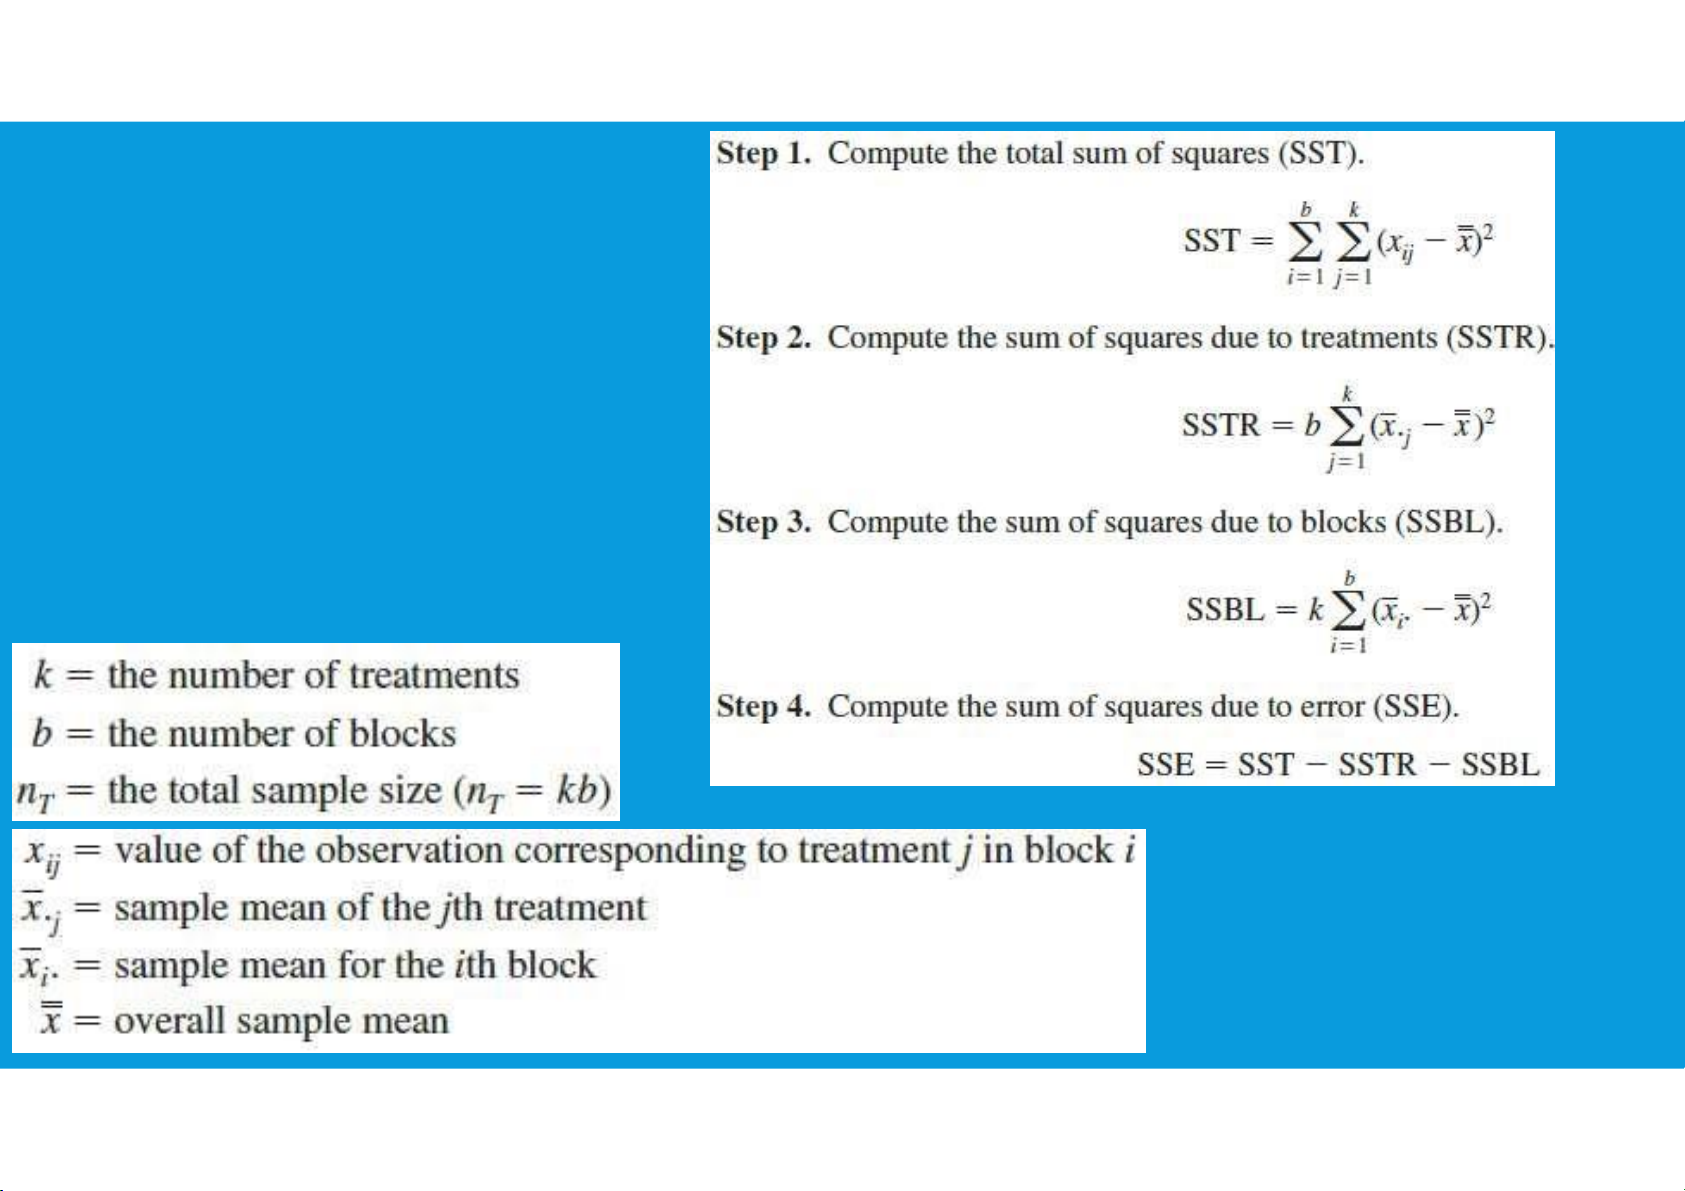
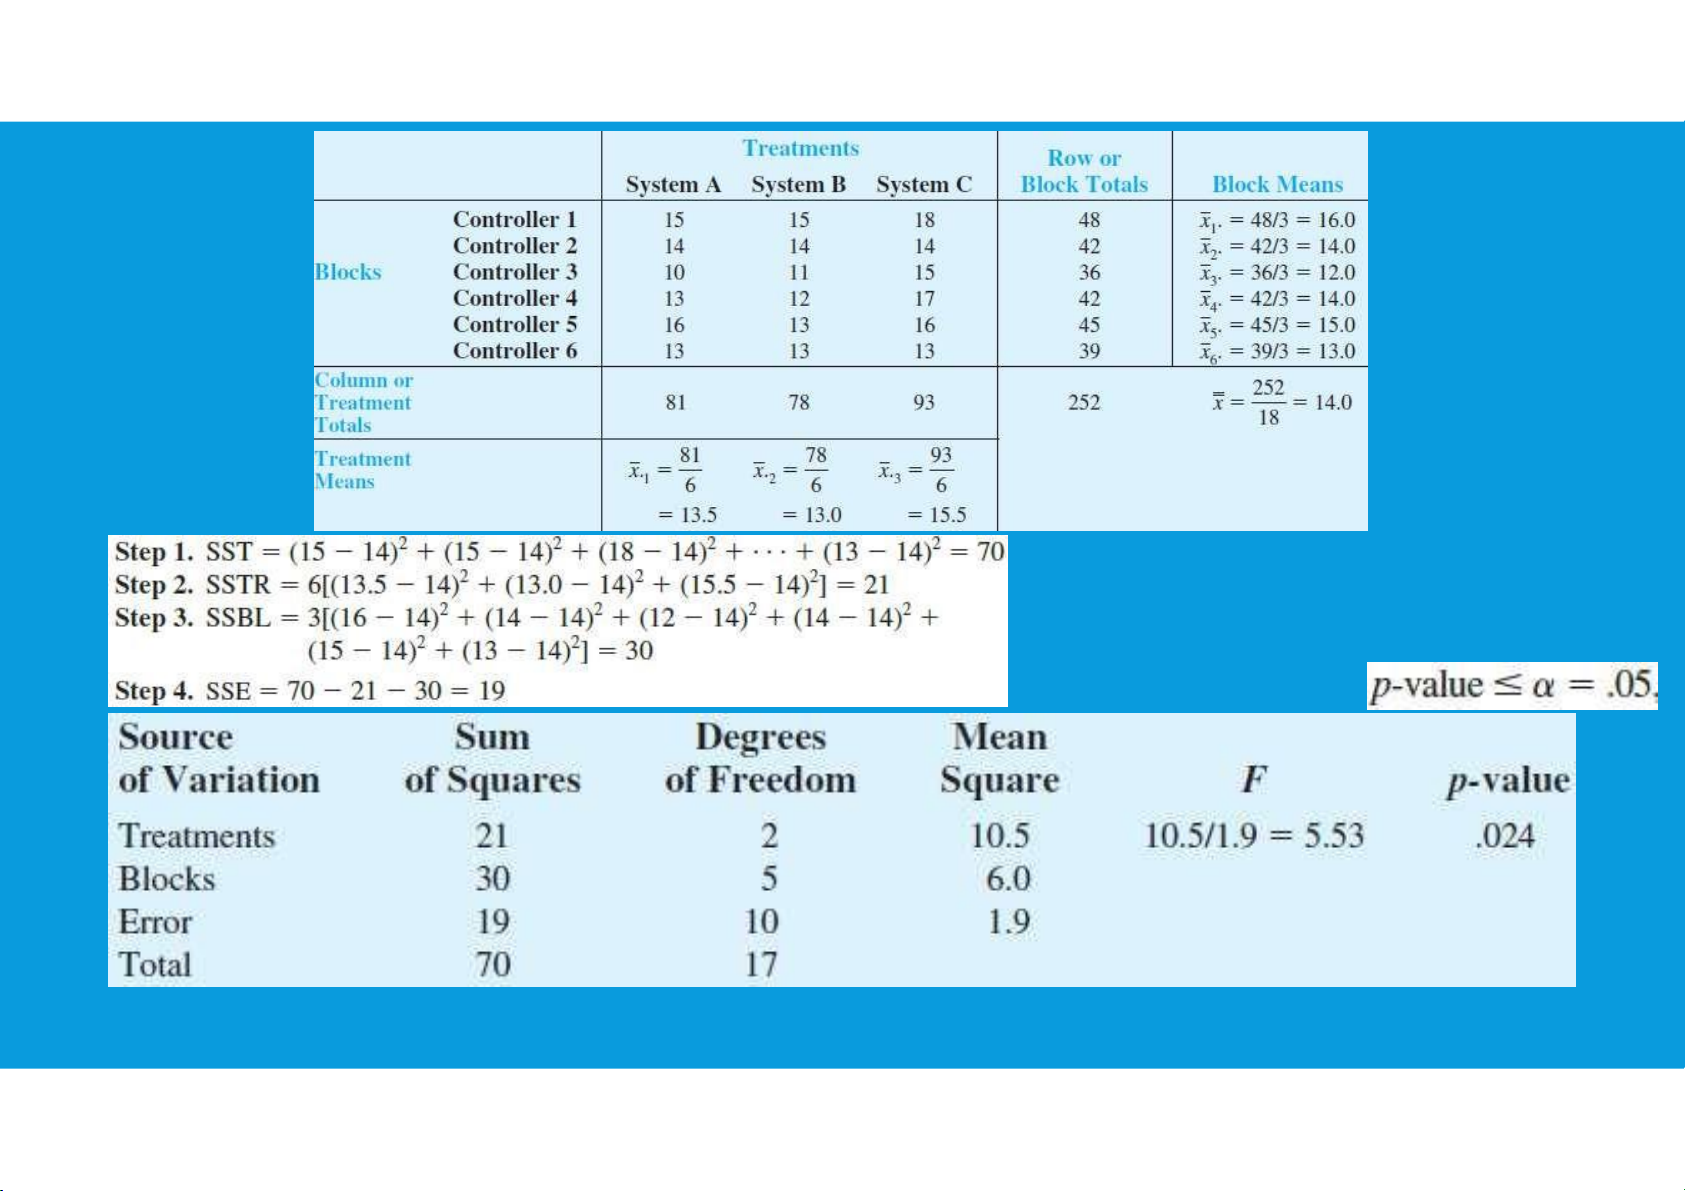
•ANOVA table for the randomized block design with k treatments and b blocks: tttu@hcmiu.edu.vn 21 lOMoARcPSD|364 906 32 7.6. ANOVA PROCEDURE tttu@hcmiu.edu.vn 22 lOMoARcPSD|364 906 32 •Four steps: •In which: tttu@hcmiu.edu.vn 23 lOMoARcPSD|364 906 32 tttu@hcmiu.edu.vn 24 lOMoARcPSD|364 906 32
Reject the hypothesis that the population means are equal
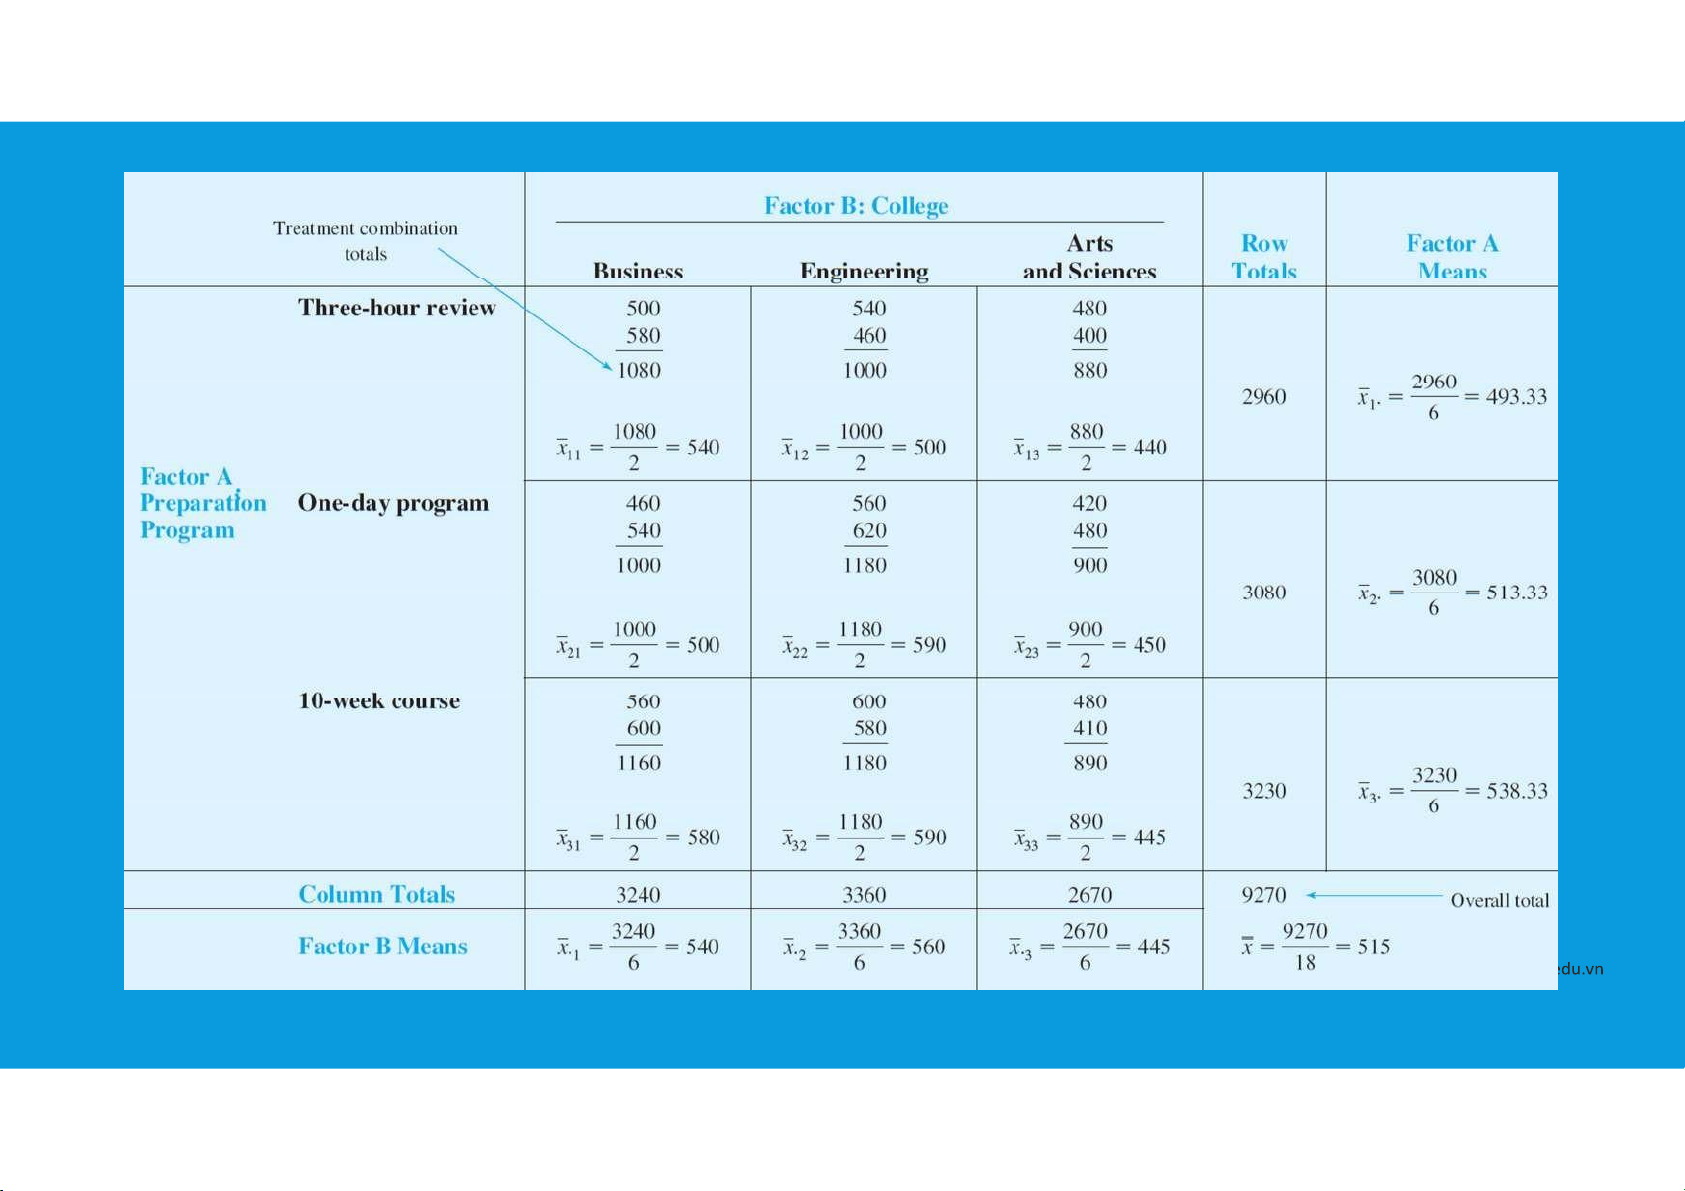
7.6. ANOVA PROCEDURE - FACTORIAL EXPERIMENT
•Factorial experiment is an experimental design that allows simultaneous
conclusions about two or more factors. The term factorial is used because the
experimental conditions include all possible combinations of the factors.
•For example, for a levels of factor A and b levels of factor B, the experiment will
involve collecting data on ab treatment combinations. tttu@hcmiu.edu.vn 25 lOMoARcPSD|364 906 32 tttu@hcmiu.edu.vn 26 lOMoARcPSD|364 906 32
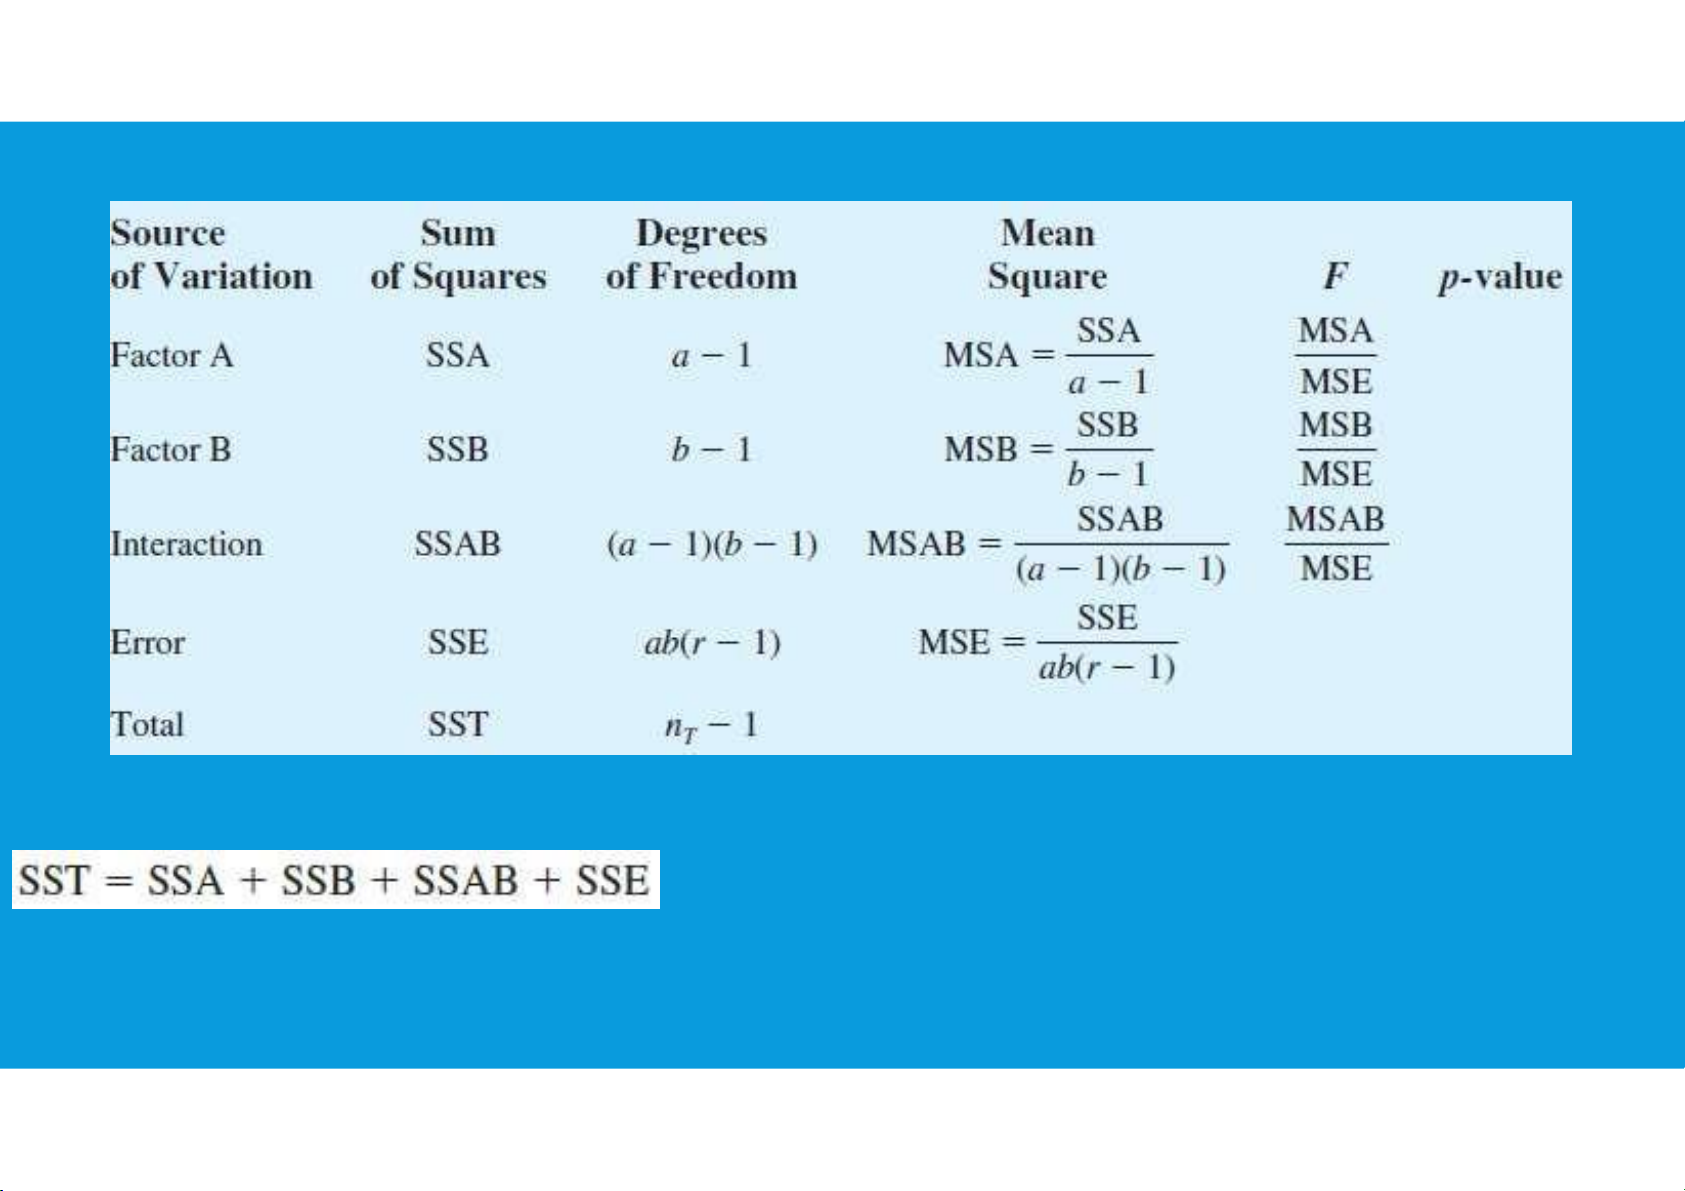
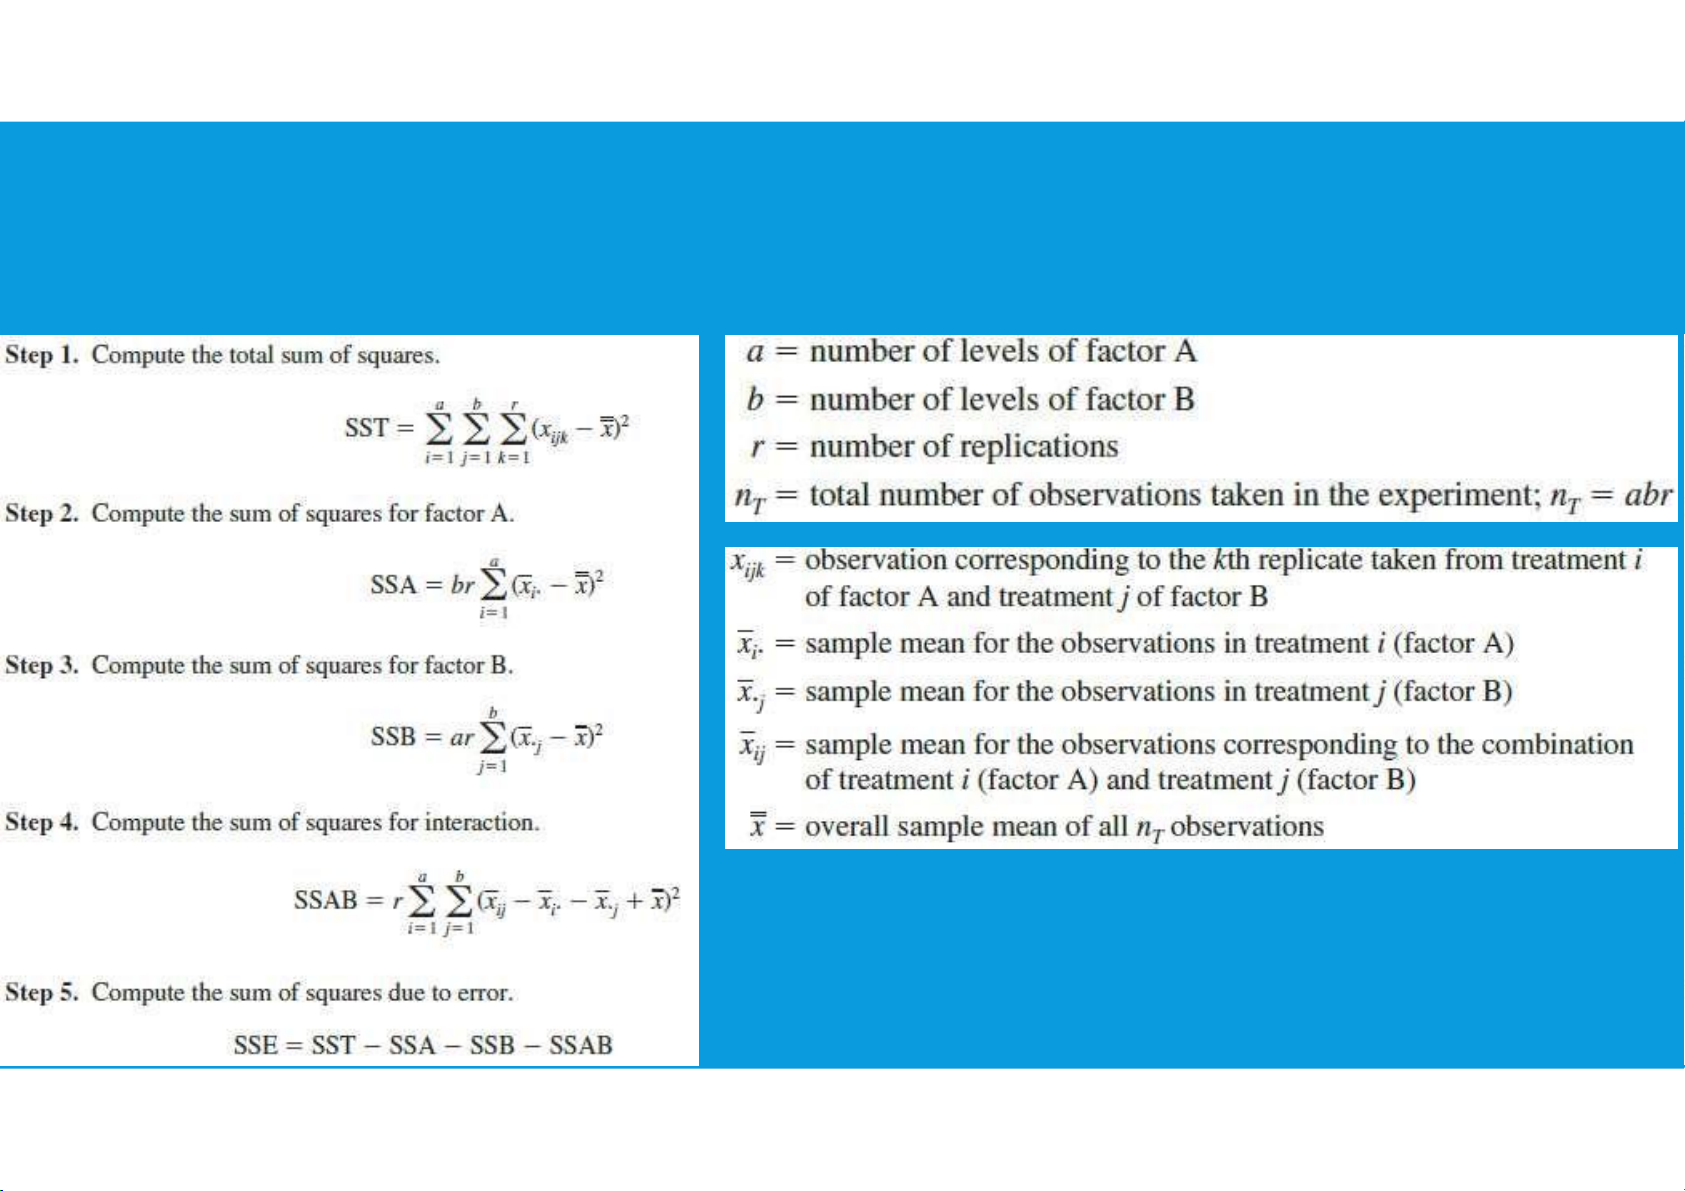
7.6. ANOVA PROCEDURE - FACTORIAL EXPERIMENT
SSA: sum of squares for factor A
SSB: sum of squares for factor B
SSAB: sum of squares for interaction tttu@hcmiu.edu.vn 27 lOMoARcPSD|364 906 32
SSE: sum of squares due to error
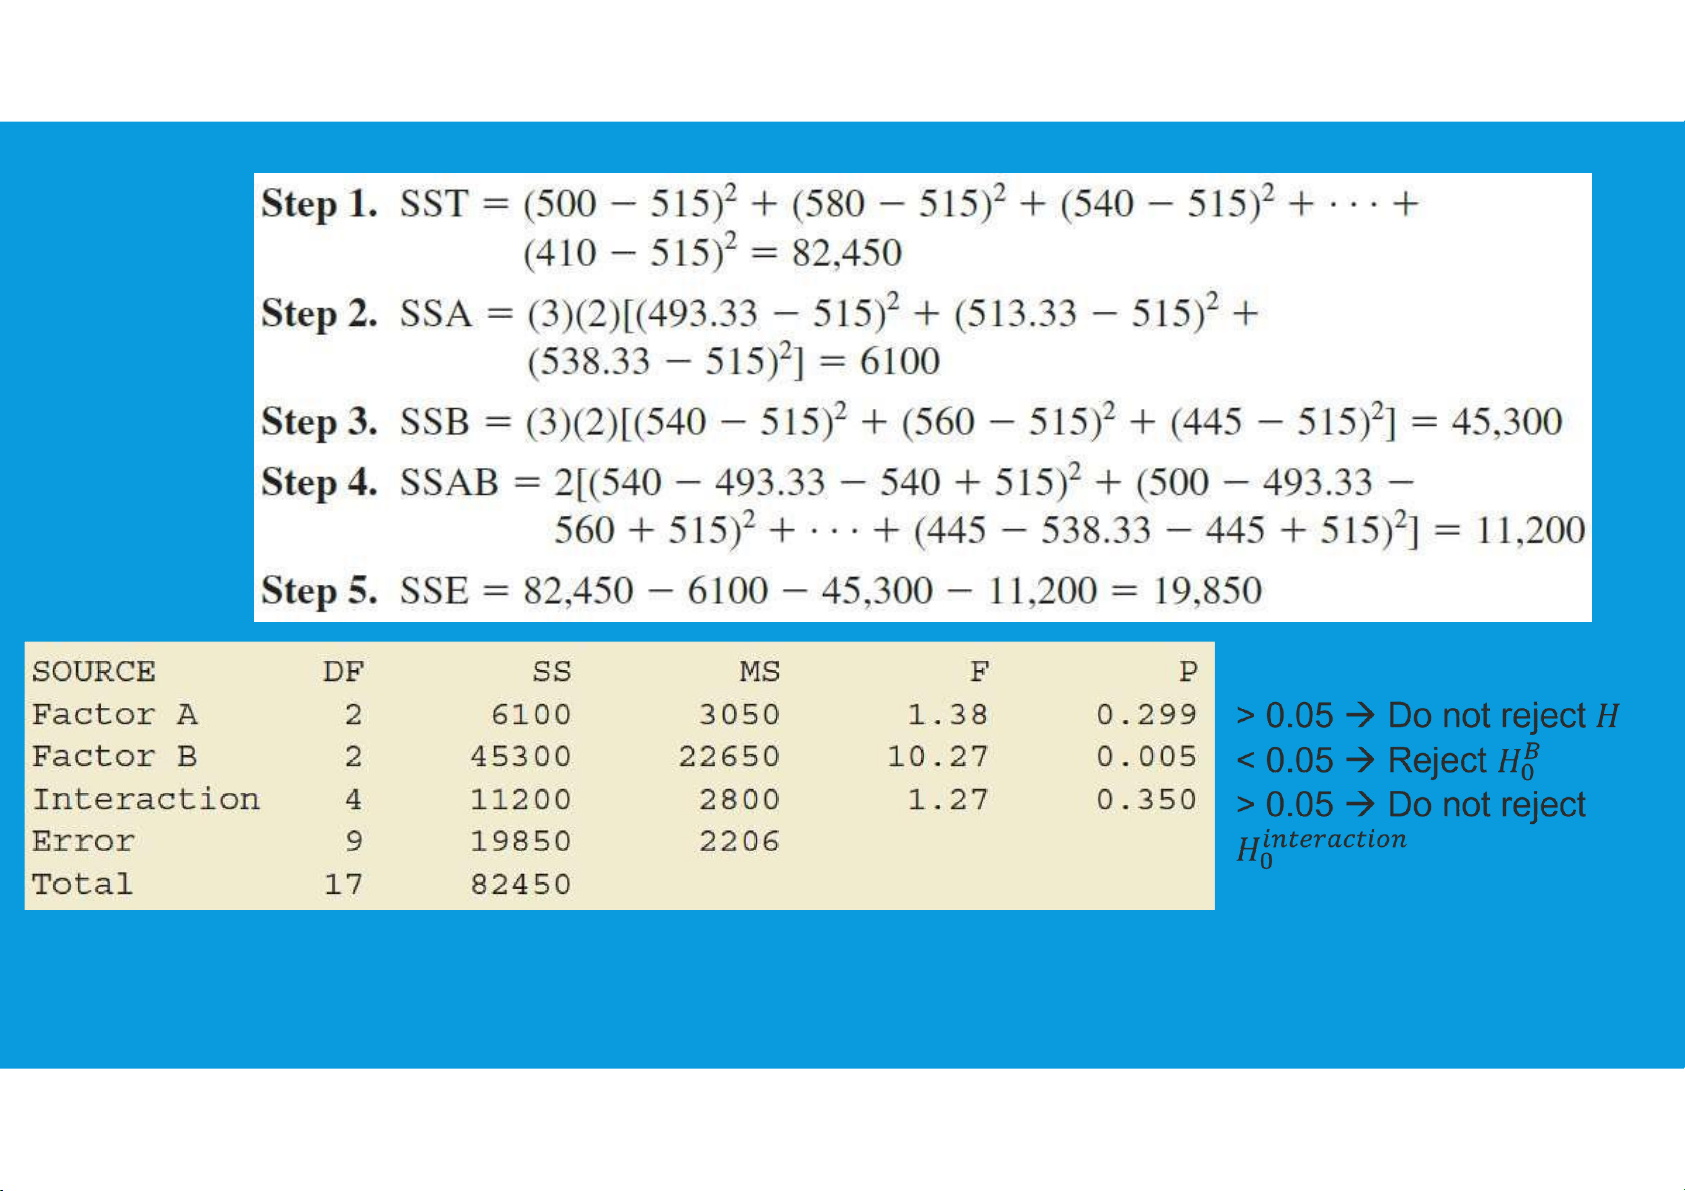
7.6. ANOVA PROCEDURE - FACTORIAL EXPERIMENT •Five steps: •In which: tttu@hcmiu.edu.vn 28 lOMoARcPSD|364 906 32 EXAMPLE 29 lOMoARcPSD|364 906 32 30 lOMoARcPSD|364 906 32 EXAMPLE 31 lOMoARcPSD|364 906 32 tttu@hcmiu.edu.vn 32
Document Outline
- APPLIED STATISTICS
- CHAPTER 7: ANALYSIS OF VARIANCE (ANOVA)
- 7.5. ANOVA TABLE
- 7.5. ANOVA TABLE (1)
- MULTIPLE COMPARISON PROCEDURES
- MULTIPLE COMPARISON PROCEDURES (1)
- MULTIPLE COMPARISON PROCEDURES (2)
- EXAMPLE
- MULTIPLE COMPARISON PROCEDURES (3)
- PAIRWISE COMPARISONS
- PAIRWISE COMPARISONS (1)
- 7.6. ANOVA PROCEDURE – RANDOMIZED BLOCK DESIGN
- 7.6. ANOVA PROCEDURE – RANDOMIZED BLOCK DESIGN (1)
- 7.6. ANOVA PROCEDURE
- 7.6. ANOVA PROCEDURE - FACTORIAL EXPERIMENT
- 7.6. ANOVA PROCEDURE - FACTORIAL EXPERIMENT (1)
- EXAMPLE (1)
- EXAMPLE (2)
Tài liệu liên quan:
-

Data and Statistics | Bài giảng số 1 chương 1 học phần Applied statistics | Trường Đại học Quốc tế, Đại học Quốc gia Thành phố Hồ Chí Minh
266 133 -

Data and Statistics | Bài giảng số 2 chương 1 học phần Applied statistics | Trường Đại học Quốc tế, Đại học Quốc gia Thành phố Hồ Chí Minh
360 180 -

Plotting and Smoothing data | Bài giảng số 3 chương 2 học phần Applied statistics | Trường Đại học Quốc tế, Đại học Quốc gia Thành phố Hồ Chí Minh
203 102 -

Descriptive statistics | Bài giảng số 4 chương 3 học phần Applied statistics | Trường Đại học Quốc tế, Đại học Quốc gia Thành phố Hồ Chí Minh
207 104 -

Descriptive statistics | Bài giảng số 5 chương 3 học phần Applied statistics | Trường Đại học Quốc tế, Đại học Quốc gia Thành phố Hồ Chí Minh
241 121