Lecture 14 - ENEE1006IU
Tài liệu học tập môn Applied statistics (ENEE1006IU) tại Trường Đại học Quốc tế, Đại học Quốc gia Thành phố Hồ Chí Minh. Tài liệu gồm 26 trang giúp bạn ôn tập hiệu quả và đạt điểm cao! Mời bạn đọc đón xem!
Môn: Applied statistics (ENEE1006IU) 47 tài liệu
Trường: Trường Đại học Quốc tế, Đại học Quốc gia Thành phố Hồ Chí Minh 1.9 K tài liệu
Tác giả:


Preview text:
lOMoARcPSD|364 906 32 lllllllllllllllllllllll APPLIED STATISTICS COURSE CODE: ENEE1006IU Lecture 14:
Chapter 8: Time series analysis and forecasting
(3 credits: 2 is for lecture, 1 is for lab-work)
Instructor: TRAN THANH TU Email: tttu@hcmiu.edu.vn tttu@hcmiu.edu.vn 1 lOMoARcPSD|364 906 32
CHAPTER 8: TIME SERIES ANALYSIS AND FORECASTING •8.1. Time series patterns •8.2. Forecast accuracy •8.3. Trend projection
•8.4. Time series decomposition tttu@hcmiu.edu.vn 2 lOMoARcPSD|364 906 32 8.1. TIME SERIES PATTERNS
•A time series is a sequence of observations on a variable measured at successive
points in time or over successive periods of time.
•The pattern of the data is an important factor in
understanding how the time series has behaved in the past.
•To identify the underlying pattern in the data, a
useful first step is to construct a time series plot.
•A time series plot is a graphical presentation of the
relationship between time and the time series tttu@hcmiu.edu.vn 3 lOMoARcPSD|364 906 32
variable; time is on the horizontal axis and the time
series values are shown on the vertical axis. tttu@hcmiu.edu.vn 4 lOMoARcPSD|364 906 32 8.1. TIME SERIES PATTERNS tttu@hcmiu.edu.vn 5 lOMoARcPSD|364 906 32
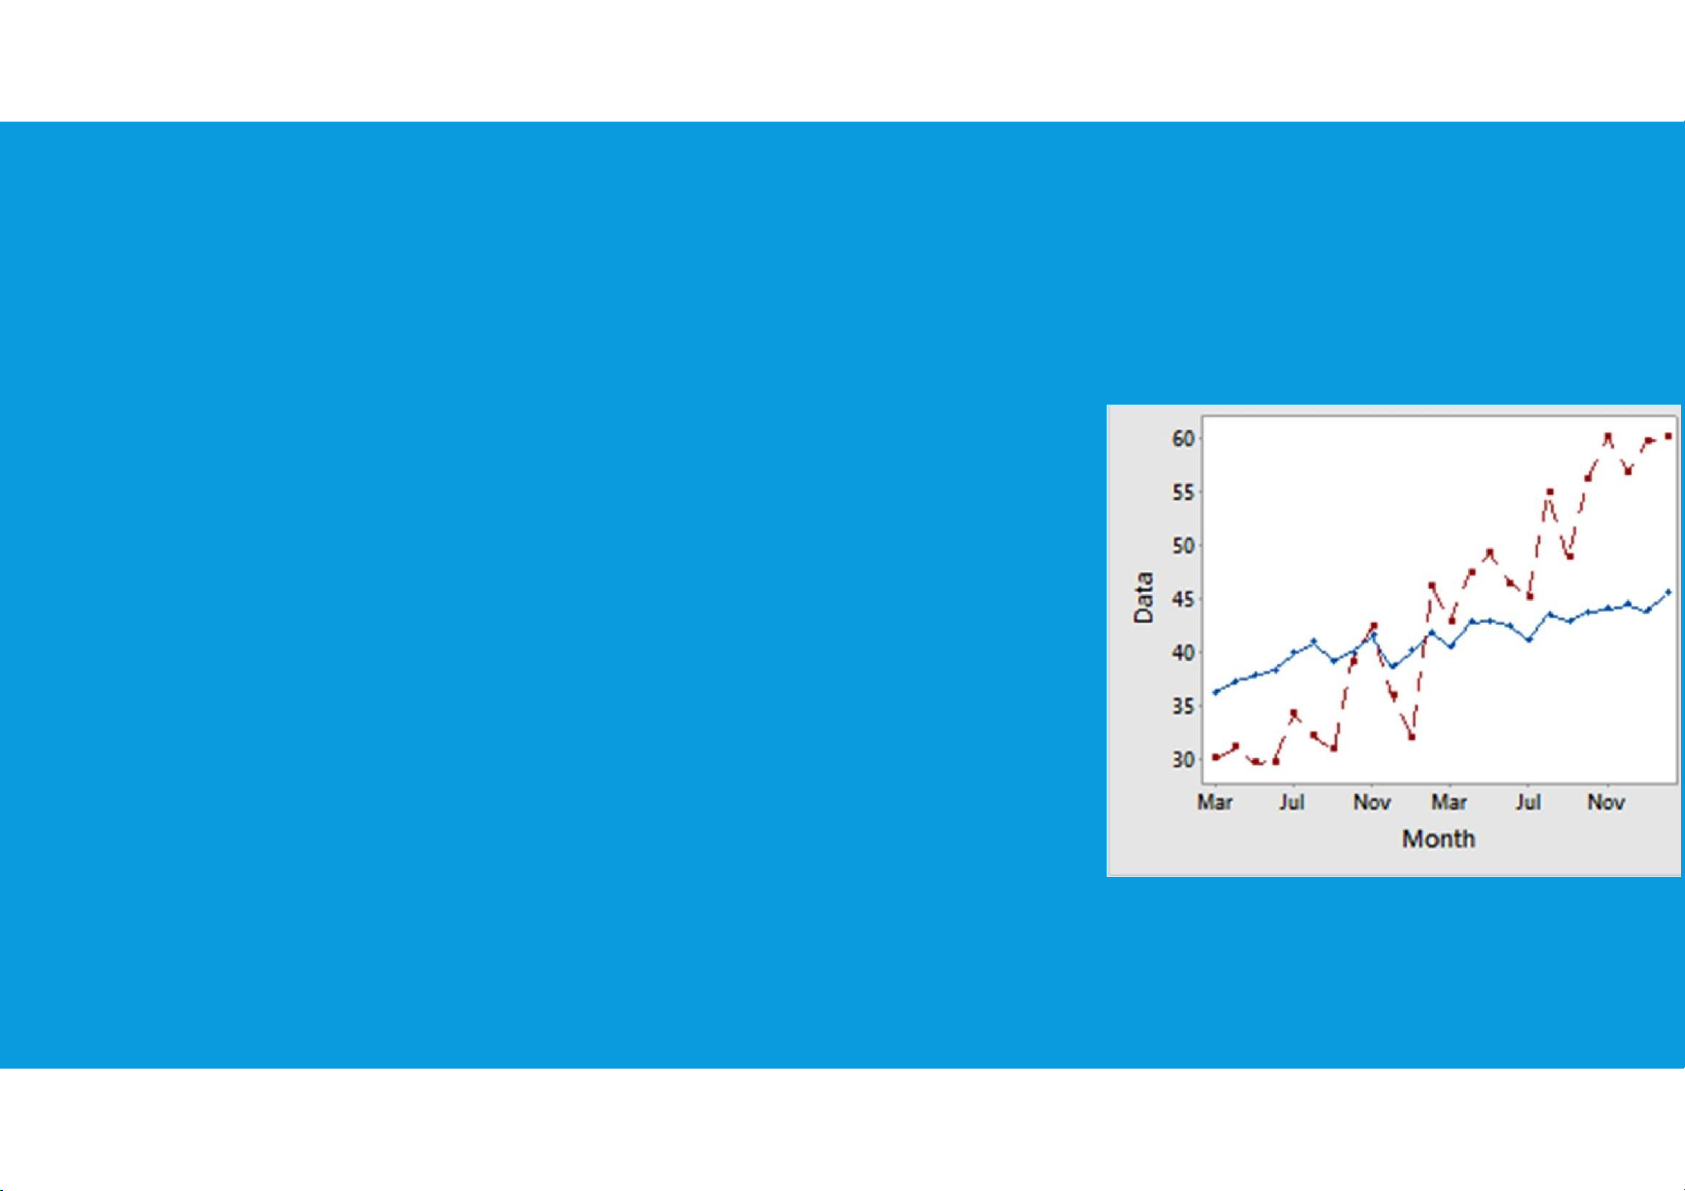
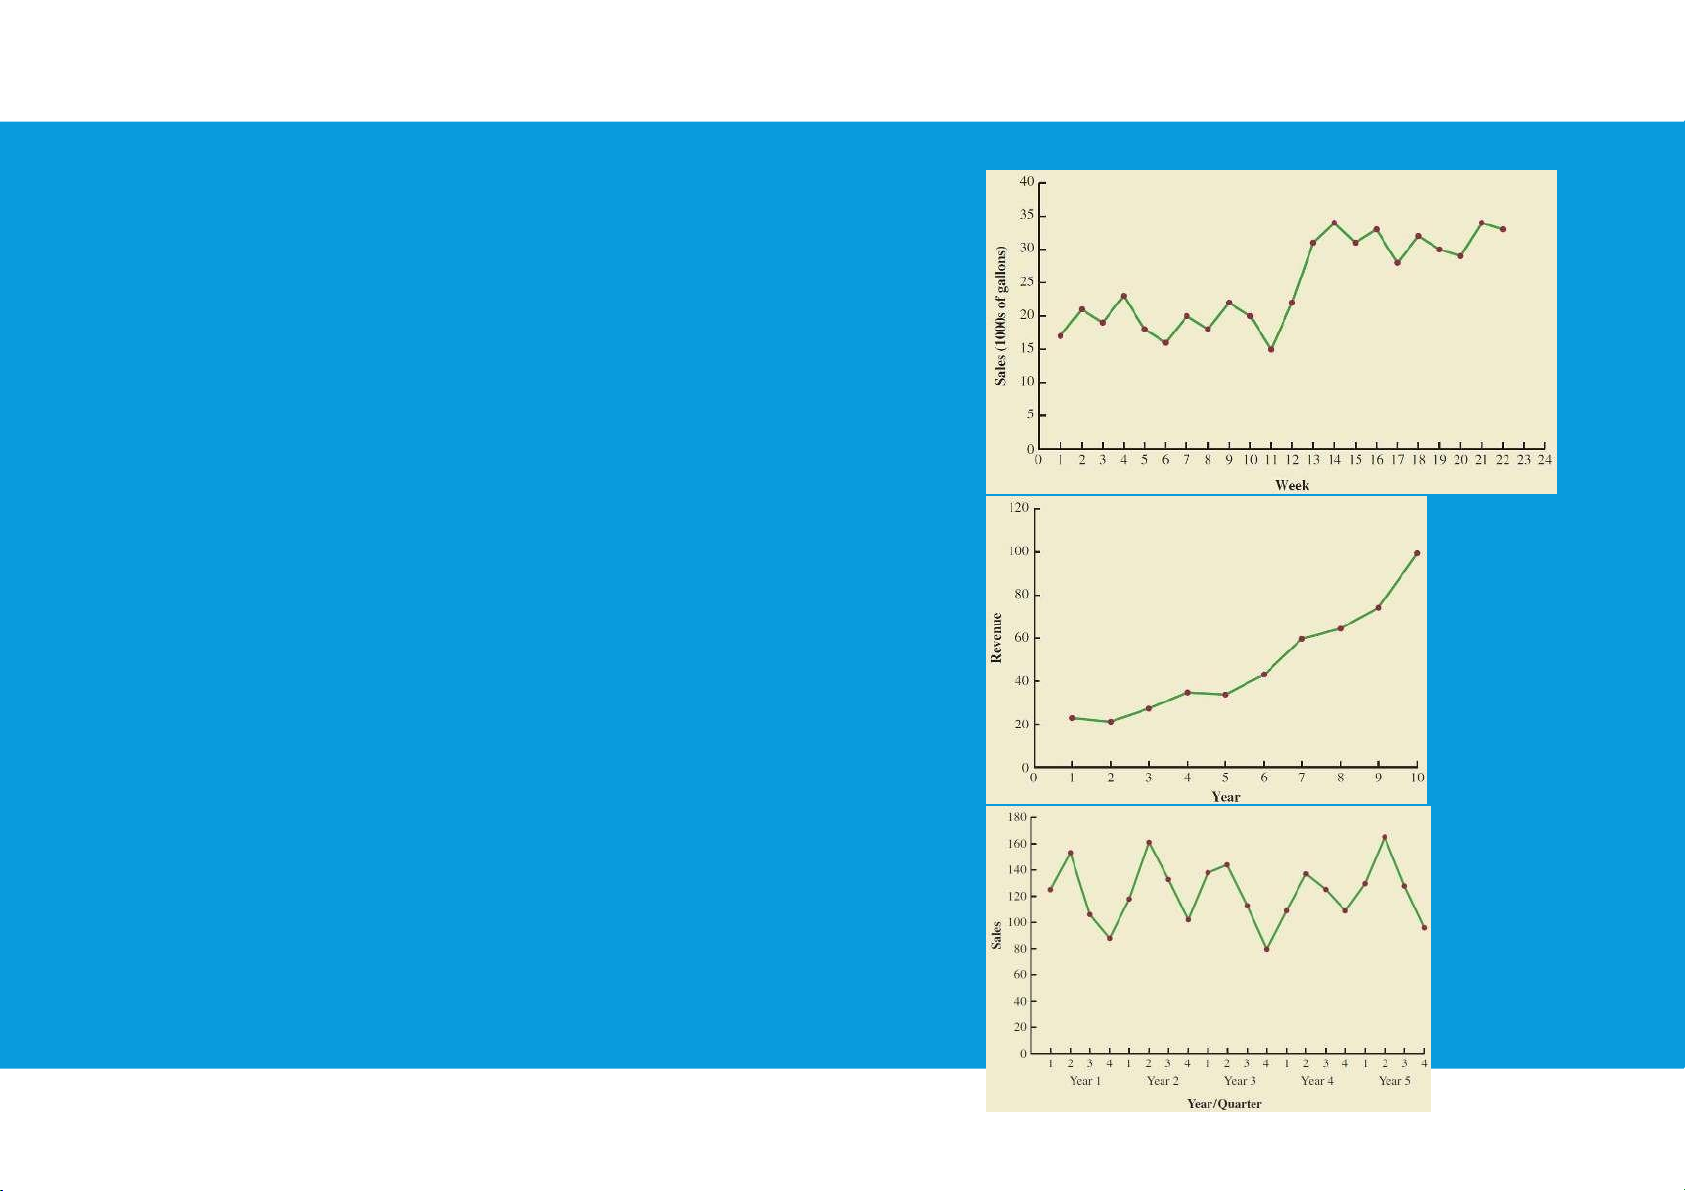
•Horizontal Pattern: a horizontal pattern exists when the data fluctuate around a constant mean
•Trend Pattern: a trend is usually the result of long-term factors; gradual
shifts or movements to relatively higher or lower values over a longer period of time
•Seasonal Pattern: Seasonal patterns are recognized by seeing the same
repeating patterns over successive periods of time tttu@hcmiu.edu.vn 6 lOMoARcPSD|364 906 32 8.1. TIME SERIES PATTERNS
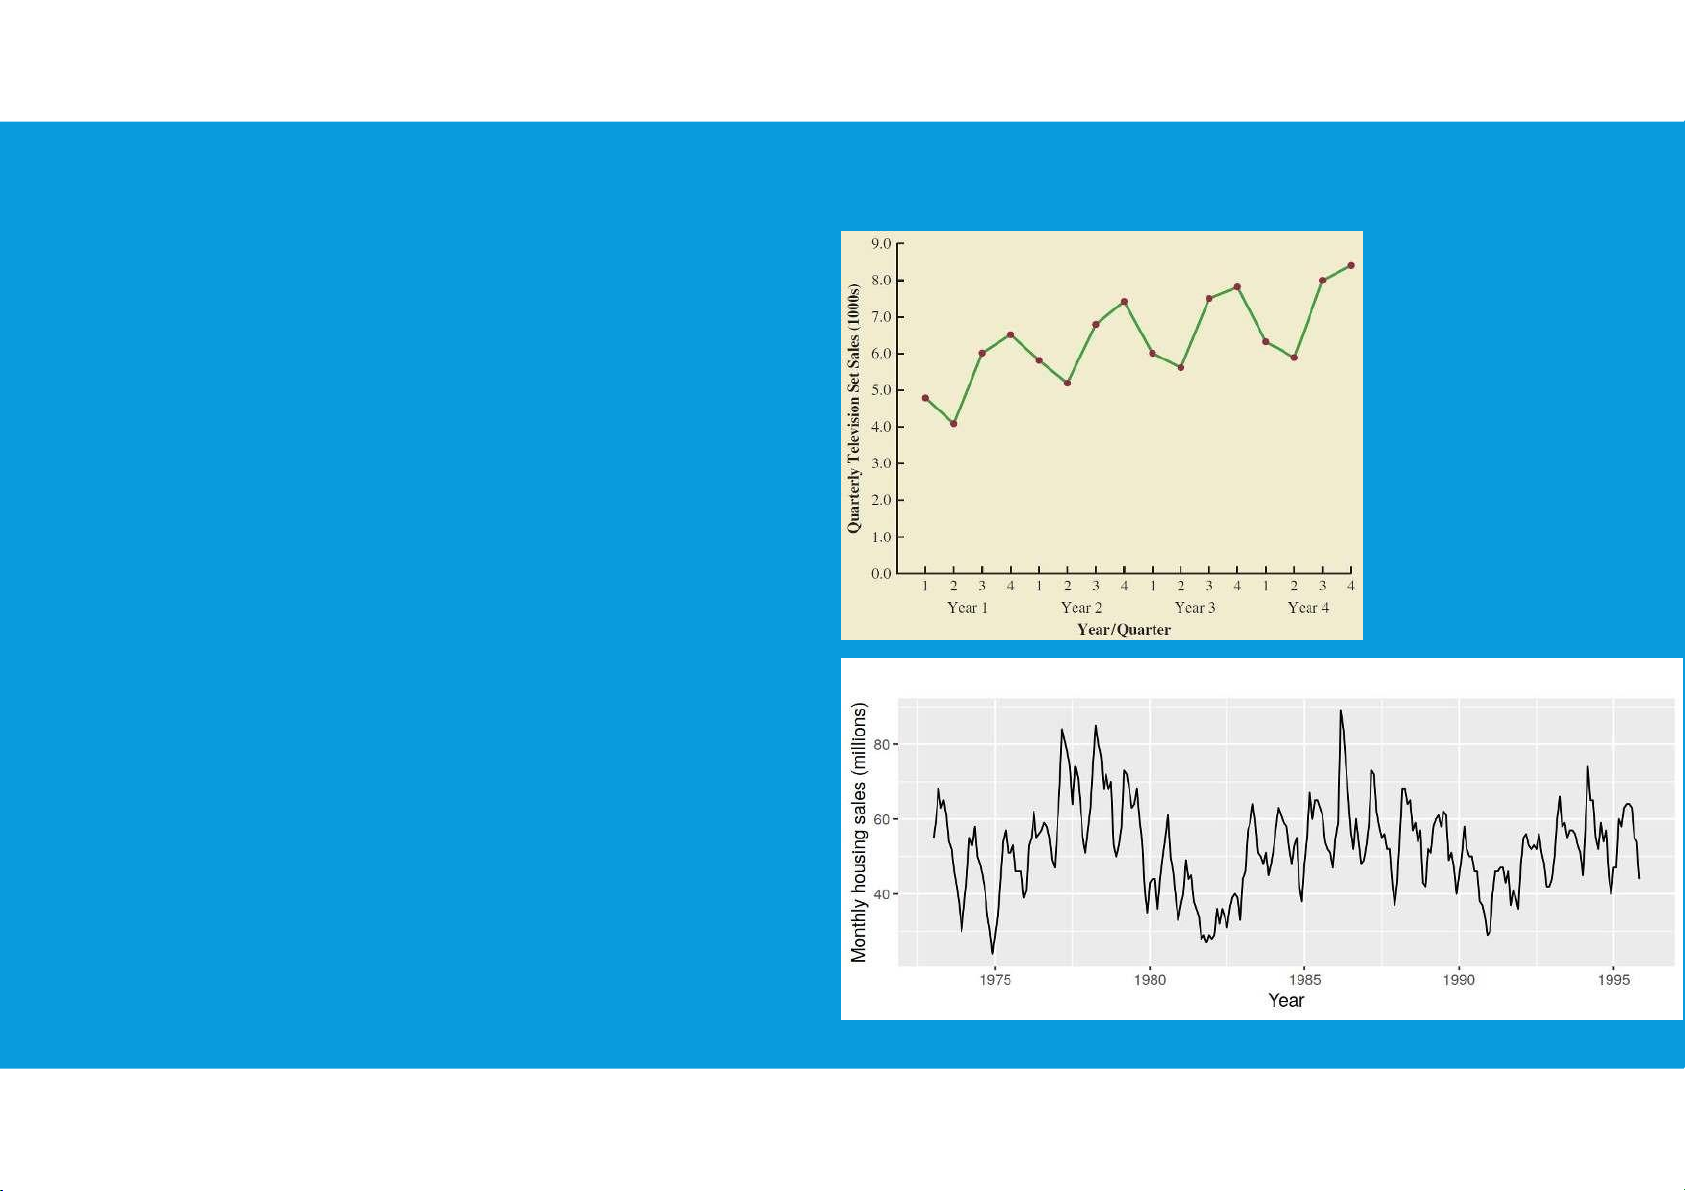
•Trend and Seasonal Pattern: in such
cases we need to use a forecasting
method that has the capability to deal
with both trend and seasonality
•Cyclical Pattern: a cyclical pattern
exists if the time series plot shows an
alternating sequence of points below
and above the trend line lasting more tttu@hcmiu.edu.vn 7 lOMoARcPSD|364 906 32
than one year. cyclical effects are often combined with long-term trend effects
and referred to as trend-cycle effects 8.2. FORECAST ACCURACY •Principles of Forecasting:
Many types of forecasting models that differ in complexity and amount of data & way they generate forecasts:
1. Forecasts are rarely perfect
2. Forecasts are more accurate for grouped data than for individual items
3. Forecast are more accurate for shorter than longer time periods tttu@hcmiu.edu.vn 8 lOMoARcPSD|364 906 32 TYPES OF FORECASTING METHODS
•Decide what needs to be forecast
Level of detail, units of analysis & time horizon required
•Evaluate and analyze appropriate data
Identify needed data & whether it’s available
•Select and test the forecasting model
Cost, ease of use & accuracy •Generate the forecast
•Monitor forecast accuracy over time tttu@hcmiu.edu.vn 9 lOMoARcPSD|364 906 32 TYPES OF FORECASTING METHODS •Forecasting methods are classified into two groups: •Qualitative methods – judgmental methods Forecasts generated subjectively by the forecaster Educated guesses
•Quantitative methods – based on mathematical modeling tttu@hcmiu.edu.vn 10 lOMoARcPSD|364 906 32 Forecasts generated through mathematical modeling QUANTITATIVE METHODS •Time Series Models:
Assumes information needed to generate a forecast is contained in a time series of data
Assumes the future will follow same patterns as the past
•Causal Models or Associative Models:
Explores cause-and-effect relationships
Uses leading indicators to predict the future
Housing starts and appliance sales tttu@hcmiu.edu.vn 11 lOMoARcPSD|364 906 32 TIME SERIES MODELS
•Forecaster looks for data patterns as
Data = historic pattern + random variation
•Historic pattern to be forecasted:
Level (long-term average) – data fluctuates around a constant mean
Trend – data exhibits an increasing or decreasing pattern
Seasonality – any pattern that regularly repeats itself and is of a constant length
Cycle – patterns created by economic fluctuations
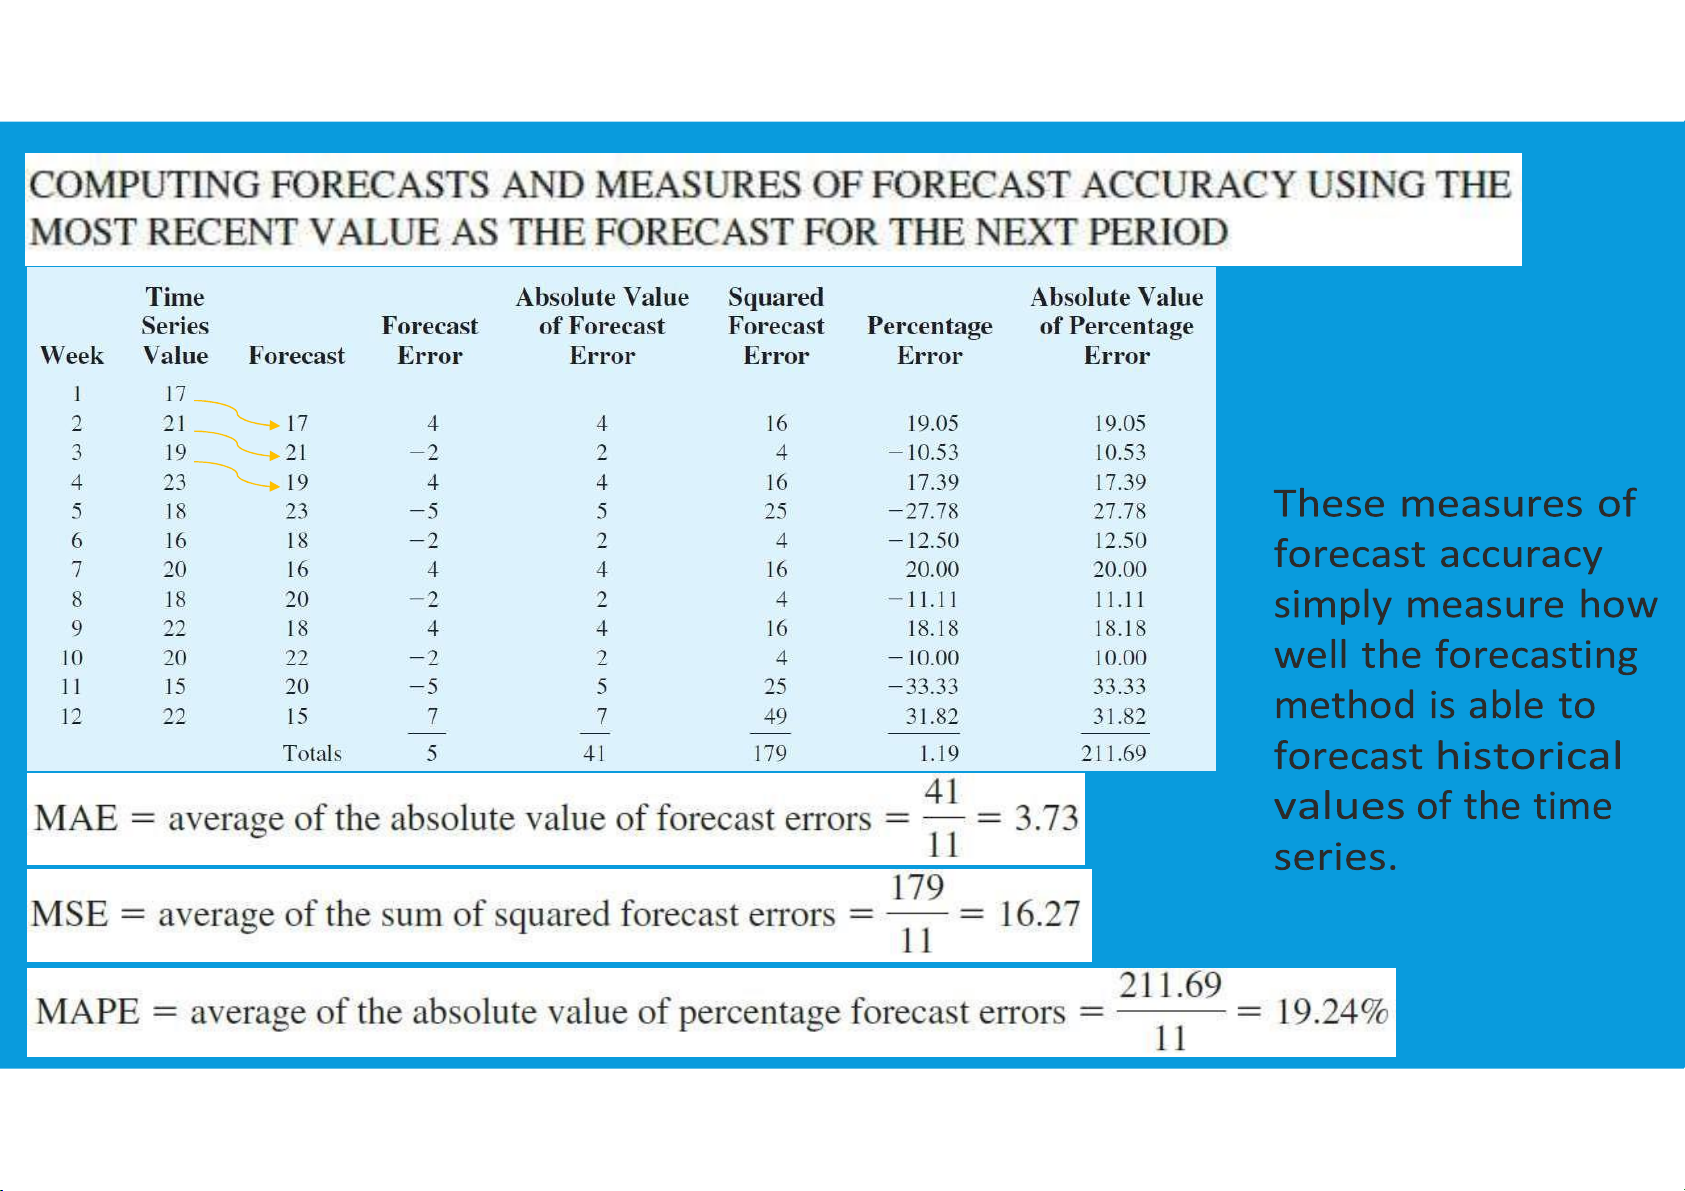
•Random Variation cannot be predicted tttu@hcmiu.edu.vn 12 lOMoARcPSD|364 906 32 TIME SERIES MODELS •Naive: Ft 1 At
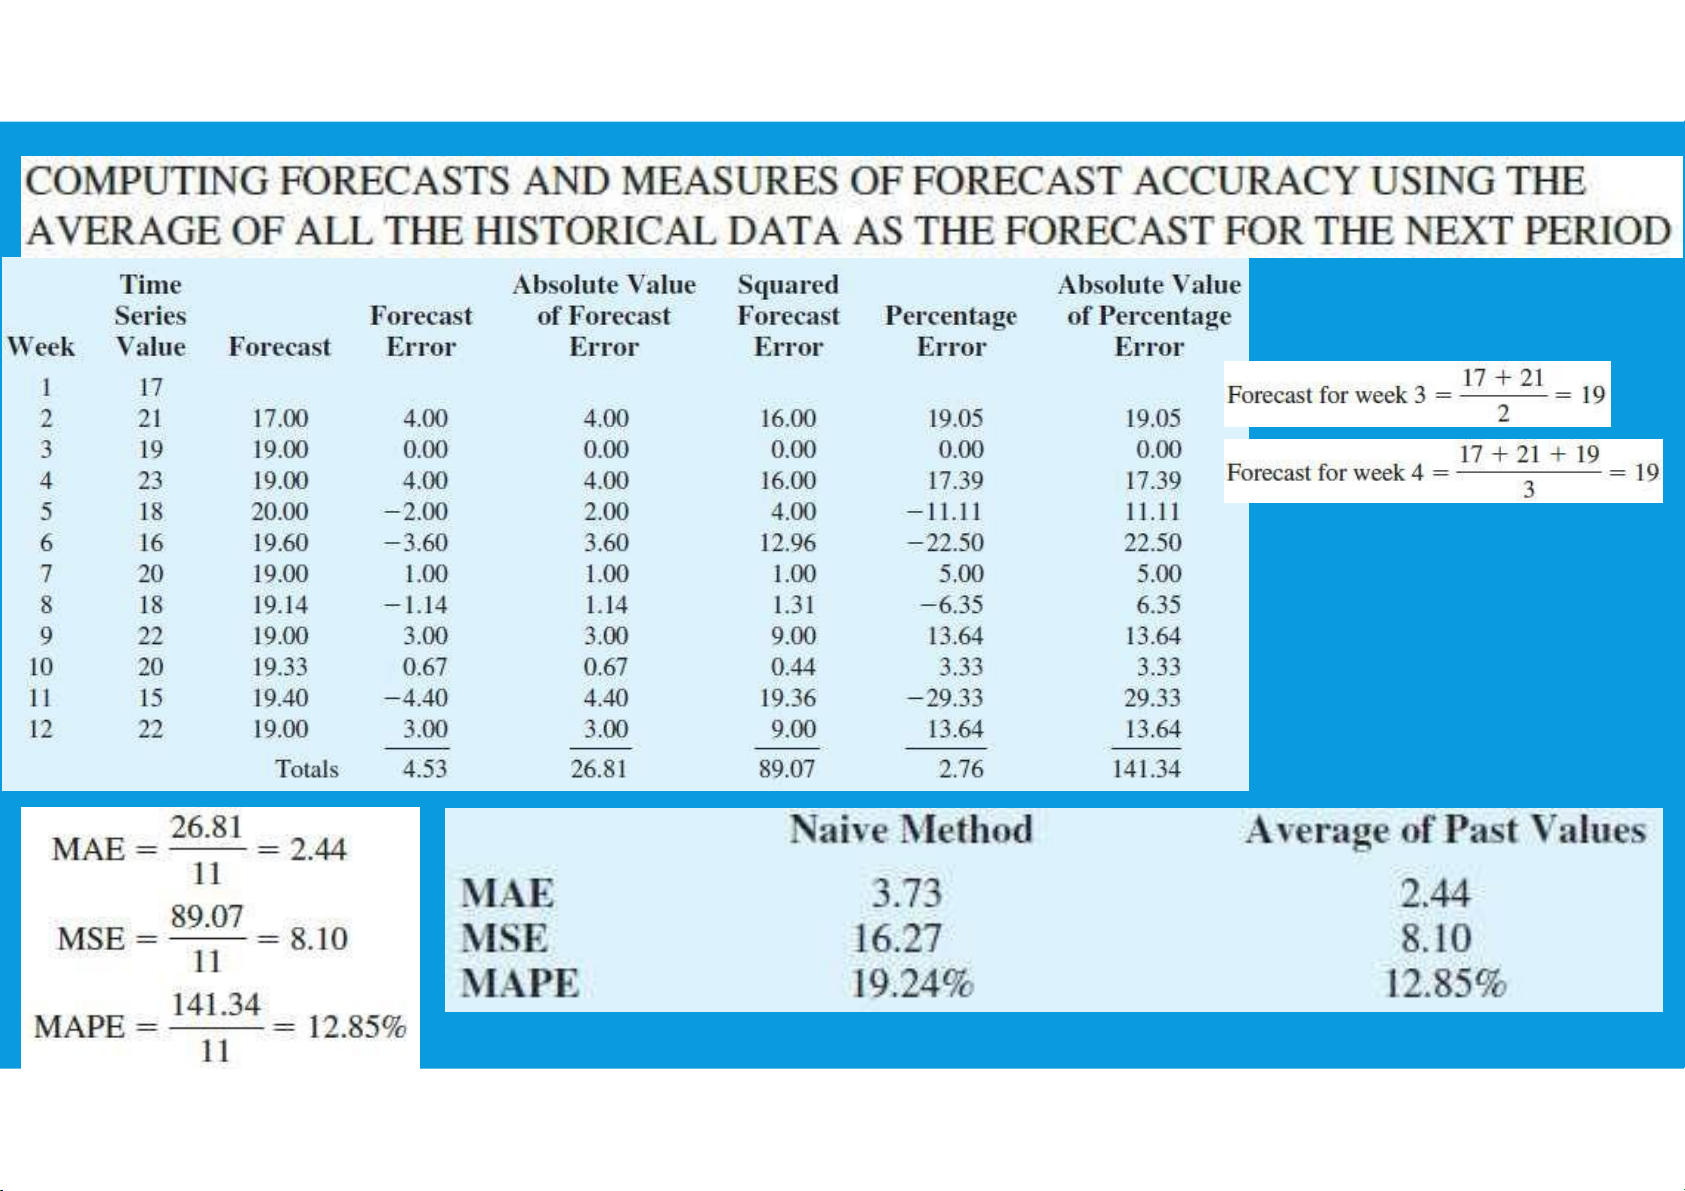
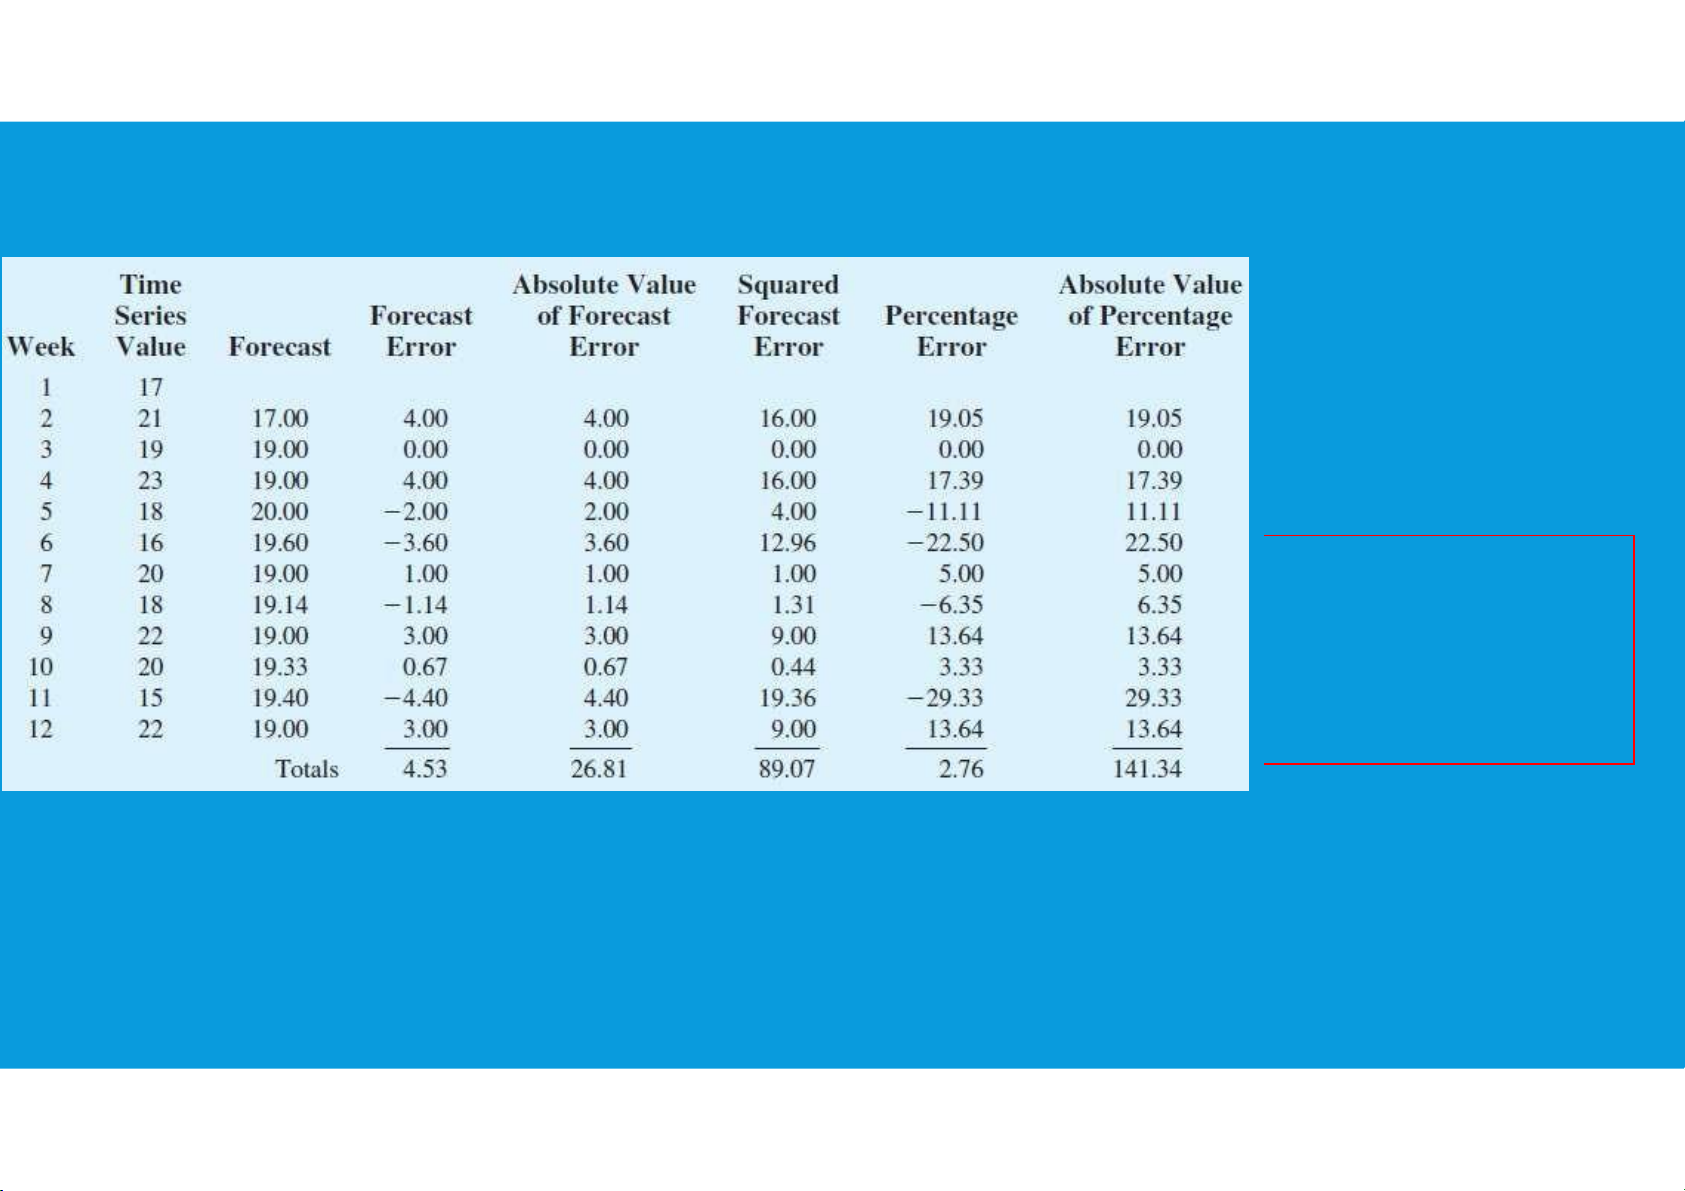
The forecast is equal to the actual value observed during the last period – good for level patterns •Simple Mean: Ft 1 At /n
The average of all available data - good for level patterns tttu@hcmiu.edu.vn 13 lOMoARcPSD|364 906 32 •Moving Average: Ft 1 At /n
The average value over a set time period (e.g.: the last four weeks)
Each new forecast drops the oldest data point & adds a new observation
More responsive to a trend but still lags behind actual data TIME SERIES MODELS
•Weighted Moving Average: Ft 1 CtAt
•All weights must add to 100% or 1.00 tttu@hcmiu.edu.vn 14 lOMoARcPSD|364 906 32
e.g. Ct =0.5, Ct-1 =0.3, Ct-2 =0.2 (weights add to 1.0)
•Allows emphasizing one period over others; above indicates more weight on recent data (Ct=0.5)
•Differs from the simple moving average that weighs all periods equally more responsive to trends tttu@hcmiu.edu.vn 15 lOMoARcPSD|364 906 32 TIME SERIES MODELS •Exponential Smoothing: Ft 1 αAt 1 α Ft
Most frequently used time series method because of ease of use and minimal amount of data needed
•Need just three pieces of data to start:
Last period’s forecast (Ft)
Last periods actual value (At)
Select value of smoothing coefficient, α,between 0 and 1.0
•If no last period forecast is available, average the last few periods or use naive method tttu@hcmiu.edu.vn 16 lOMoARcPSD|364 906 32
•Higher α values (e.g. 0.7 or 0.8) may place too much weight on last period’s random variation MEASURING FORECAST ERROR
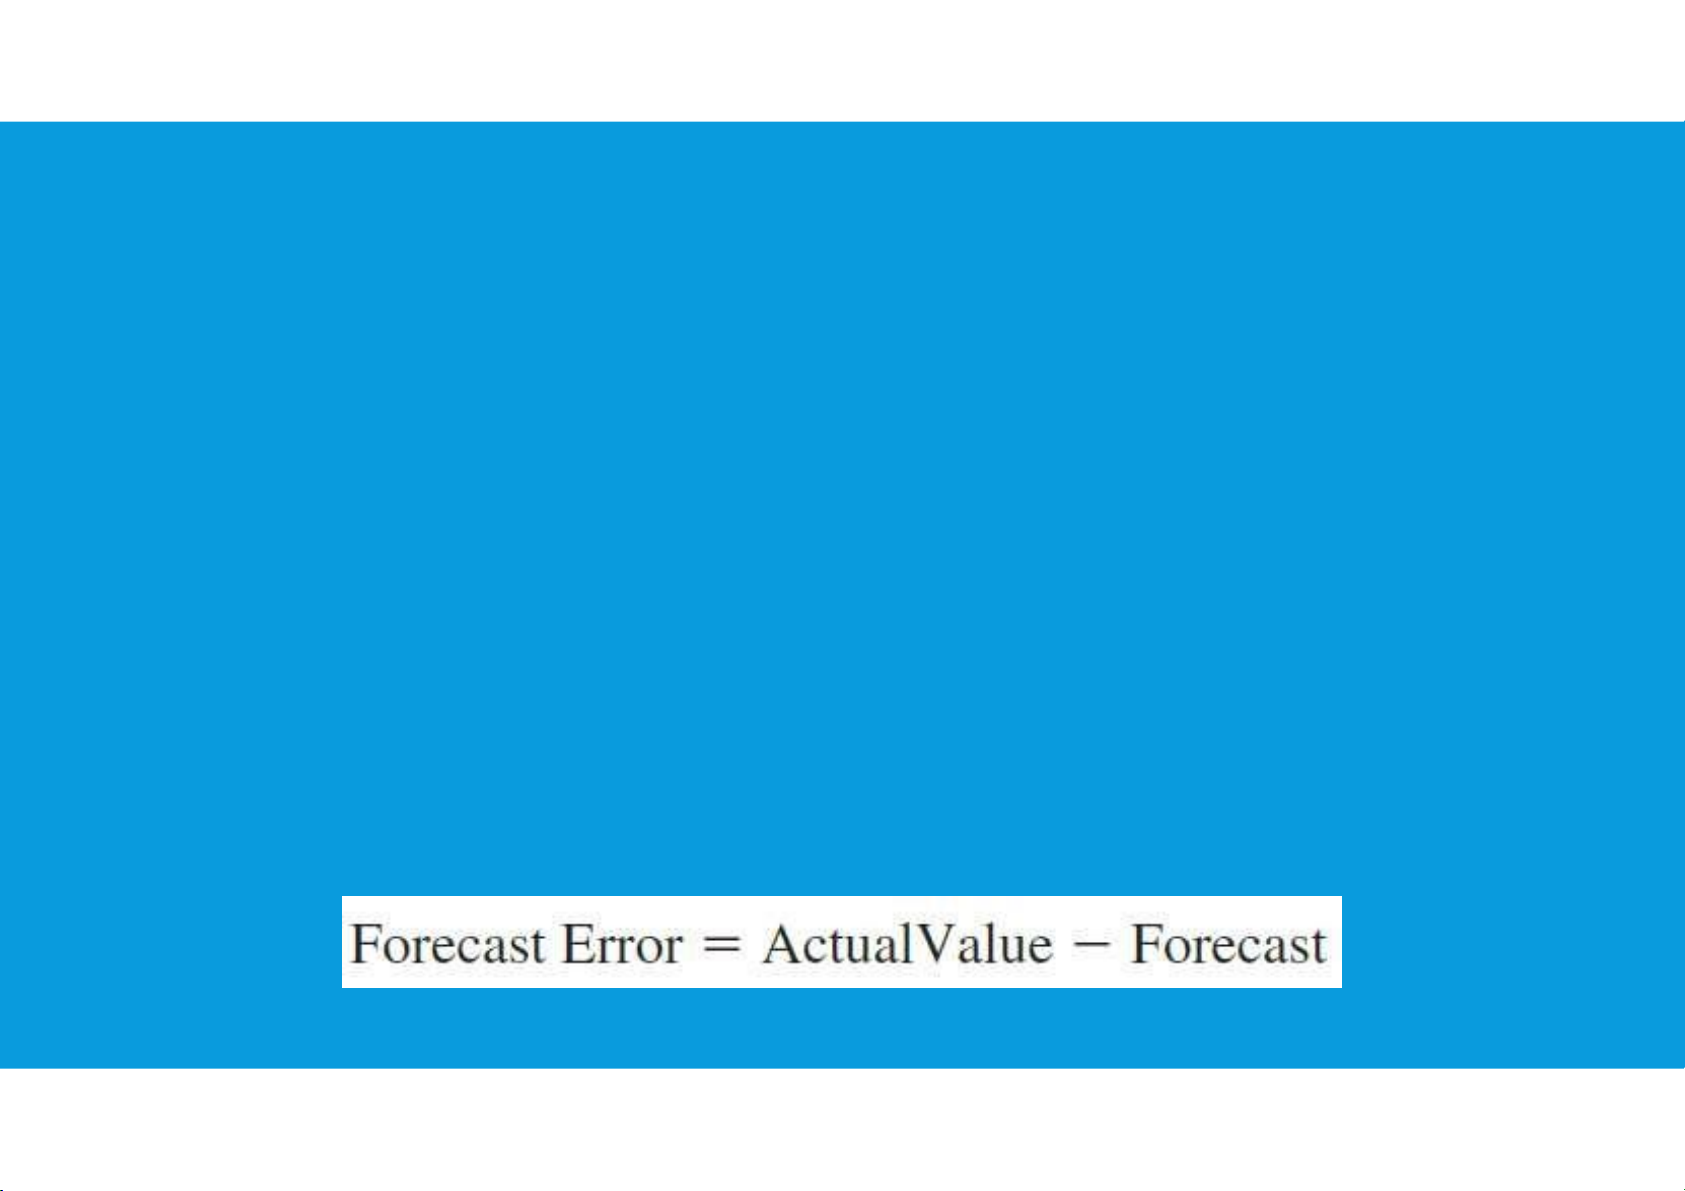
•Forecasts are never perfect
•Need to know how much we should rely on our chosen forecasting method •Measuring forecast error: Et At Ft
•Note that over-forecasts = negative errors and under-forecasts = positive errors tttu@hcmiu.edu.vn 17 lOMoARcPSD|364 906 32
MEASURING FORECASTING ACCURACY
•Mean Absolute Deviation (MAD) •Tracking Signal
measures the total error in a forecast Measures if your model without regard to sign is working MAD actual forecast n
•Cumulative Forecast Error (CFE)
Measures any bias in the forecast CFE actual forecast •Mean Square Error (MSE) Penalizes larger errors tttu@hcmiu.edu.vn 18 lOMoARcPSD|364 906 32 TS CFE MAD actual - forecast 2 MSE n tttu@hcmiu.edu.vn 19 lOMoARcPSD|364 906 32 tttu@hcmiu.edu.vn 20 lOMoARcPSD|364 906 32 tttu@hcmiu.edu.vn 21 lOMoARcPSD|364 906 32 tttu@hcmiu.edu.vn 22 lOMoARcPSD|364 906 32 HOMEWORKS (1) Note: Each table for each method tttu@hcmiu.edu.vn 23 lOMoARcPSD|364 906 32
Compute the forecasts and measures of forecast accuracy, using:
1. Weighted moving averages as the forecast for the next period, assuming that:
- Period is 3-week observations
- The assigned weights: 3/6 to the most recent observation, 2/6 to the second most recent
observation, and 1/6 to the third most recent observation tttu@hcmiu.edu.vn 24 lOMoARcPSD|364 906 32 HOMEWORKS (2) Note: Each table for each method tttu@hcmiu.edu.vn 25 lOMoARcPSD|364 906 32
Compute the forecasts and measures of forecast accuracy, using:
2. Exponential smoothing, assuming that: - α = 0.4 tttu@hcmiu.edu.vn 26
Document Outline
- APPLIED STATISTICS
- CHAPTER 8: TIME SERIES ANALYSIS AND FORECASTING
- 8.1. TIME SERIES PATTERNS
- 8.1. TIME SERIES PATTERNS (1)
- 8.1. TIME SERIES PATTERNS (2)
- 8.2. FORECAST ACCURACY
- TYPES OF FORECASTING METHODS
- TYPES OF FORECASTING METHODS (1)
- QUANTITATIVE METHODS
- TIME SERIES MODELS
- TIME SERIES MODELS (1)
- •Naive: Ft1 At
- •Moving Average: Ft1 At /n
- TIME SERIES MODELS (2)
- •Weighted Moving Average: Ft1 CtAt
- TIME SERIES MODELS (3)
- •Exponential Smoothing: Ft1 αAt 1αFt
- MEASURING FORECAST ERROR
- MEASURING FORECASTING ACCURACY
- MSE
- TS CFE MAD
- HOMEWORKS (1)
- HOMEWORKS (2)
Tài liệu liên quan:
-

Data and Statistics | Bài giảng số 1 chương 1 học phần Applied statistics | Trường Đại học Quốc tế, Đại học Quốc gia Thành phố Hồ Chí Minh
266 133 -

Data and Statistics | Bài giảng số 2 chương 1 học phần Applied statistics | Trường Đại học Quốc tế, Đại học Quốc gia Thành phố Hồ Chí Minh
360 180 -

Plotting and Smoothing data | Bài giảng số 3 chương 2 học phần Applied statistics | Trường Đại học Quốc tế, Đại học Quốc gia Thành phố Hồ Chí Minh
203 102 -

Descriptive statistics | Bài giảng số 4 chương 3 học phần Applied statistics | Trường Đại học Quốc tế, Đại học Quốc gia Thành phố Hồ Chí Minh
207 104 -

Descriptive statistics | Bài giảng số 5 chương 3 học phần Applied statistics | Trường Đại học Quốc tế, Đại học Quốc gia Thành phố Hồ Chí Minh
241 121