Lecture 15 Chapter 8: Time series analysis and forecasting | Trường Đại học Quốc tế, Đại học Quốc gia Thành phố Hồ Chí Minh
CHAPTER 8: TIME SERIES ANALYSIS AND FORECASTING 8.1. Time series patterns 8.2. Forecast accuracy 8.3. Trend projection 8.4. Time series decomposition. Each of the independent variables zj (where j = 1, 2, . . . , p) is a function of x1, x2, . . . , xk (the variables for which data are collected). In some cases, each zj may be a function of only one x variable. Tài liệu giúp bạn tham khảo, ôn tập và đạt kết quả cao. Mời bạn đọc đón xem!
Môn: Applied statistics (ENEE1006IU) 47 tài liệu
Trường: Trường Đại học Quốc tế, Đại học Quốc gia Thành phố Hồ Chí Minh 1.9 K tài liệu
Tác giả:


Preview text:
lOMoAR cPSD| 45903860 APPLIED STATISTICS COURSE CODE: ENEE1006IU Lecture 15:
Chapter 8: Time series analysis and forecasting
(3 credits: 2 is for lecture, 1 is for lab-work) 1 lOMoAR cPSD| 45903860
CHAPTER 8: TIME SERIES ANALYSIS AND FORECASTING •8.1. Time series patterns •8.2. Forecast accuracy •8.3. Trend projection
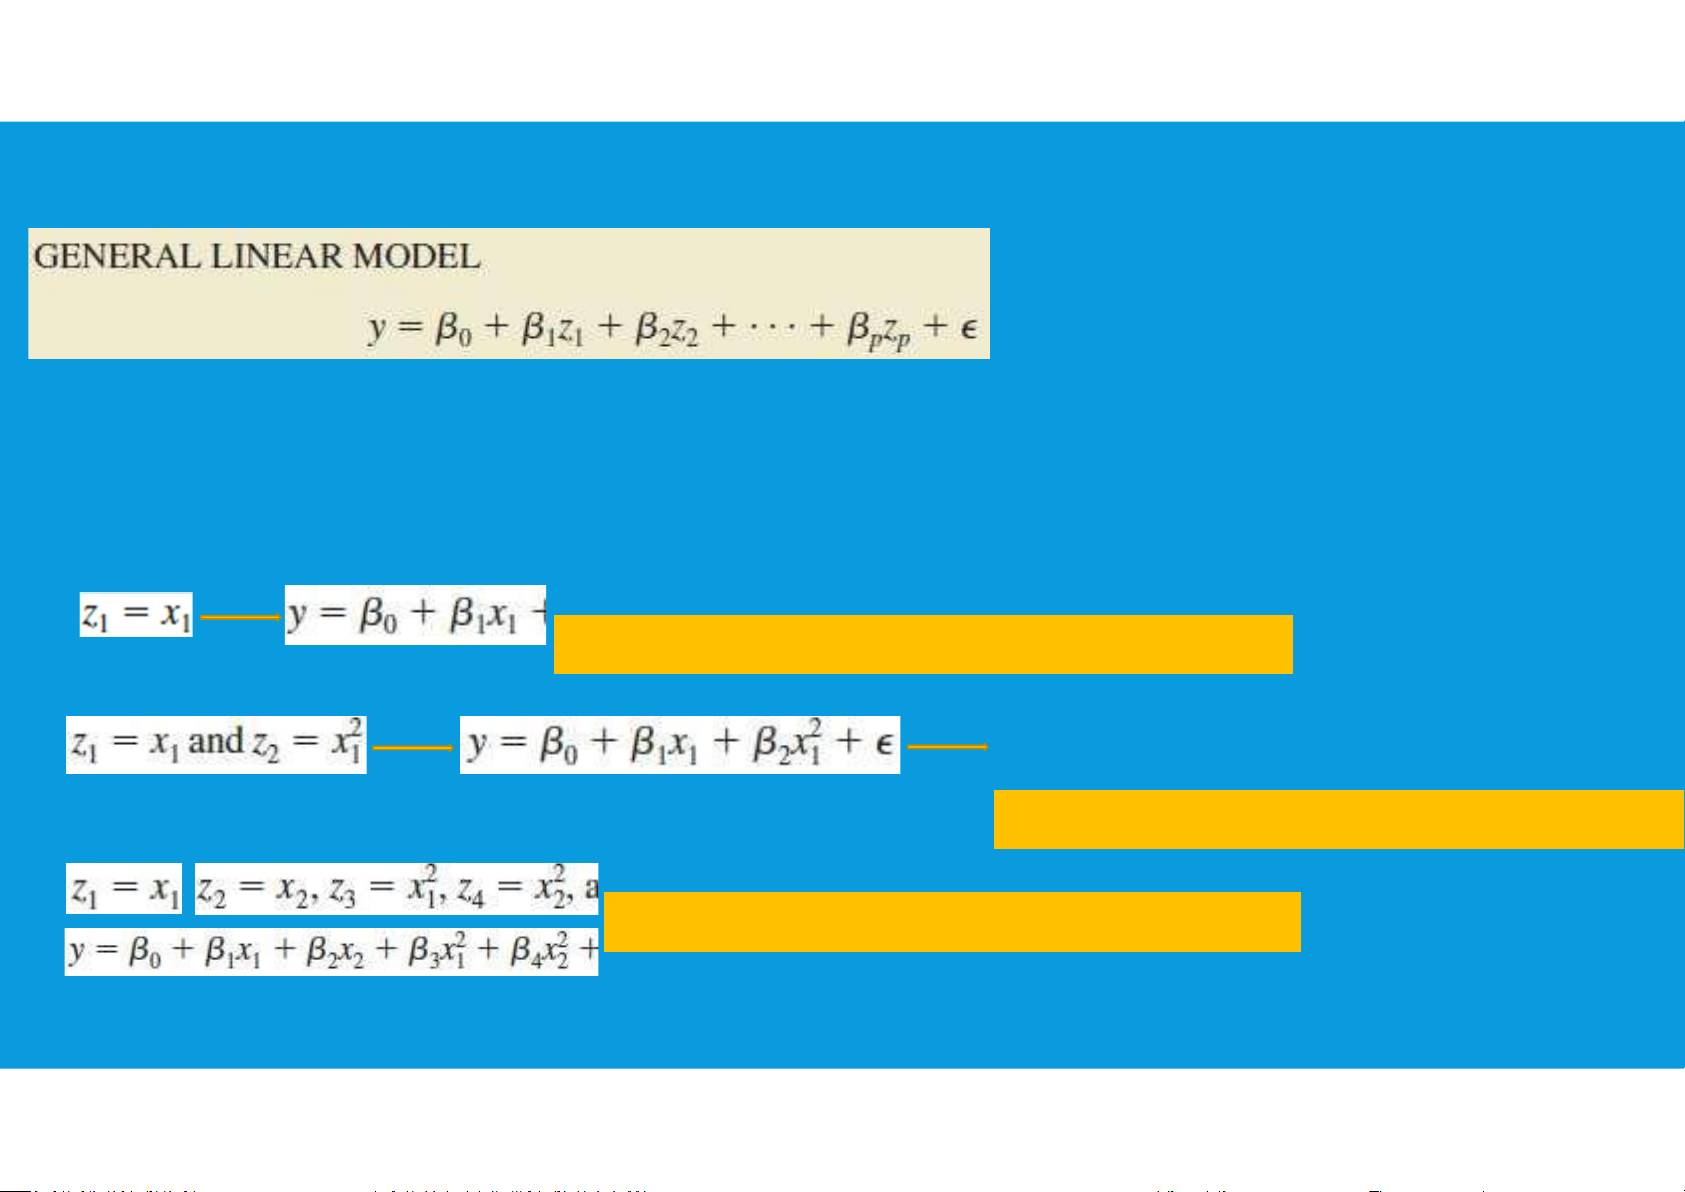
•8.4. Time series decomposition 2 lOMoAR cPSD| 45903860 LINEAR MODEL
Each of the independent variables zj (where j = 1, 2, . . . , p) is a function of x1, x2, . . . , xk (the variables for which data are collected).
In some cases, each zj may be a function of only one x variable. straight-line relationship
simple first-order model with one predictor variable curvilinear relationship
second-order model with one predictor variable interaction
second-order model with two predictor variable lOMoAR cPSD| 45903860 4 lOMoAR cPSD| 45903860
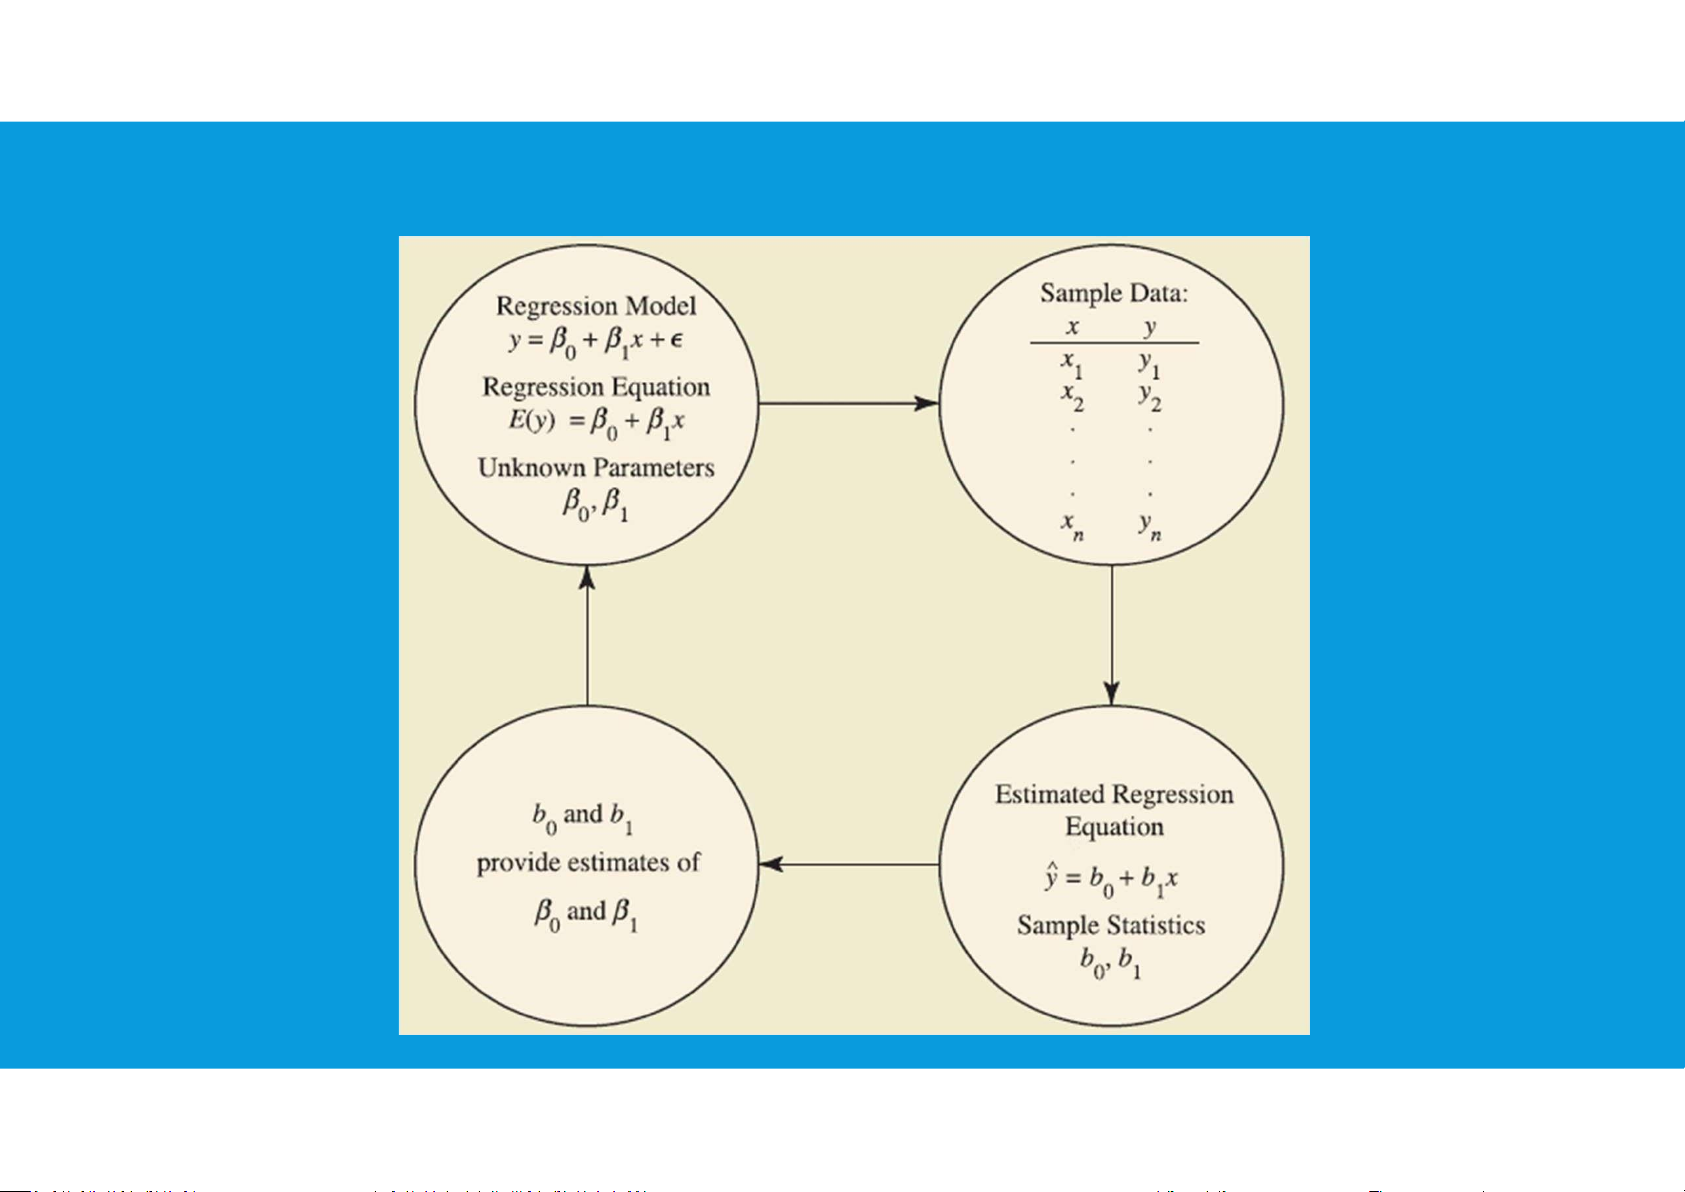
LINEAR REGRESSION ESTIMATION PROCESS Simple regression lOMoAR cPSD| 45903860
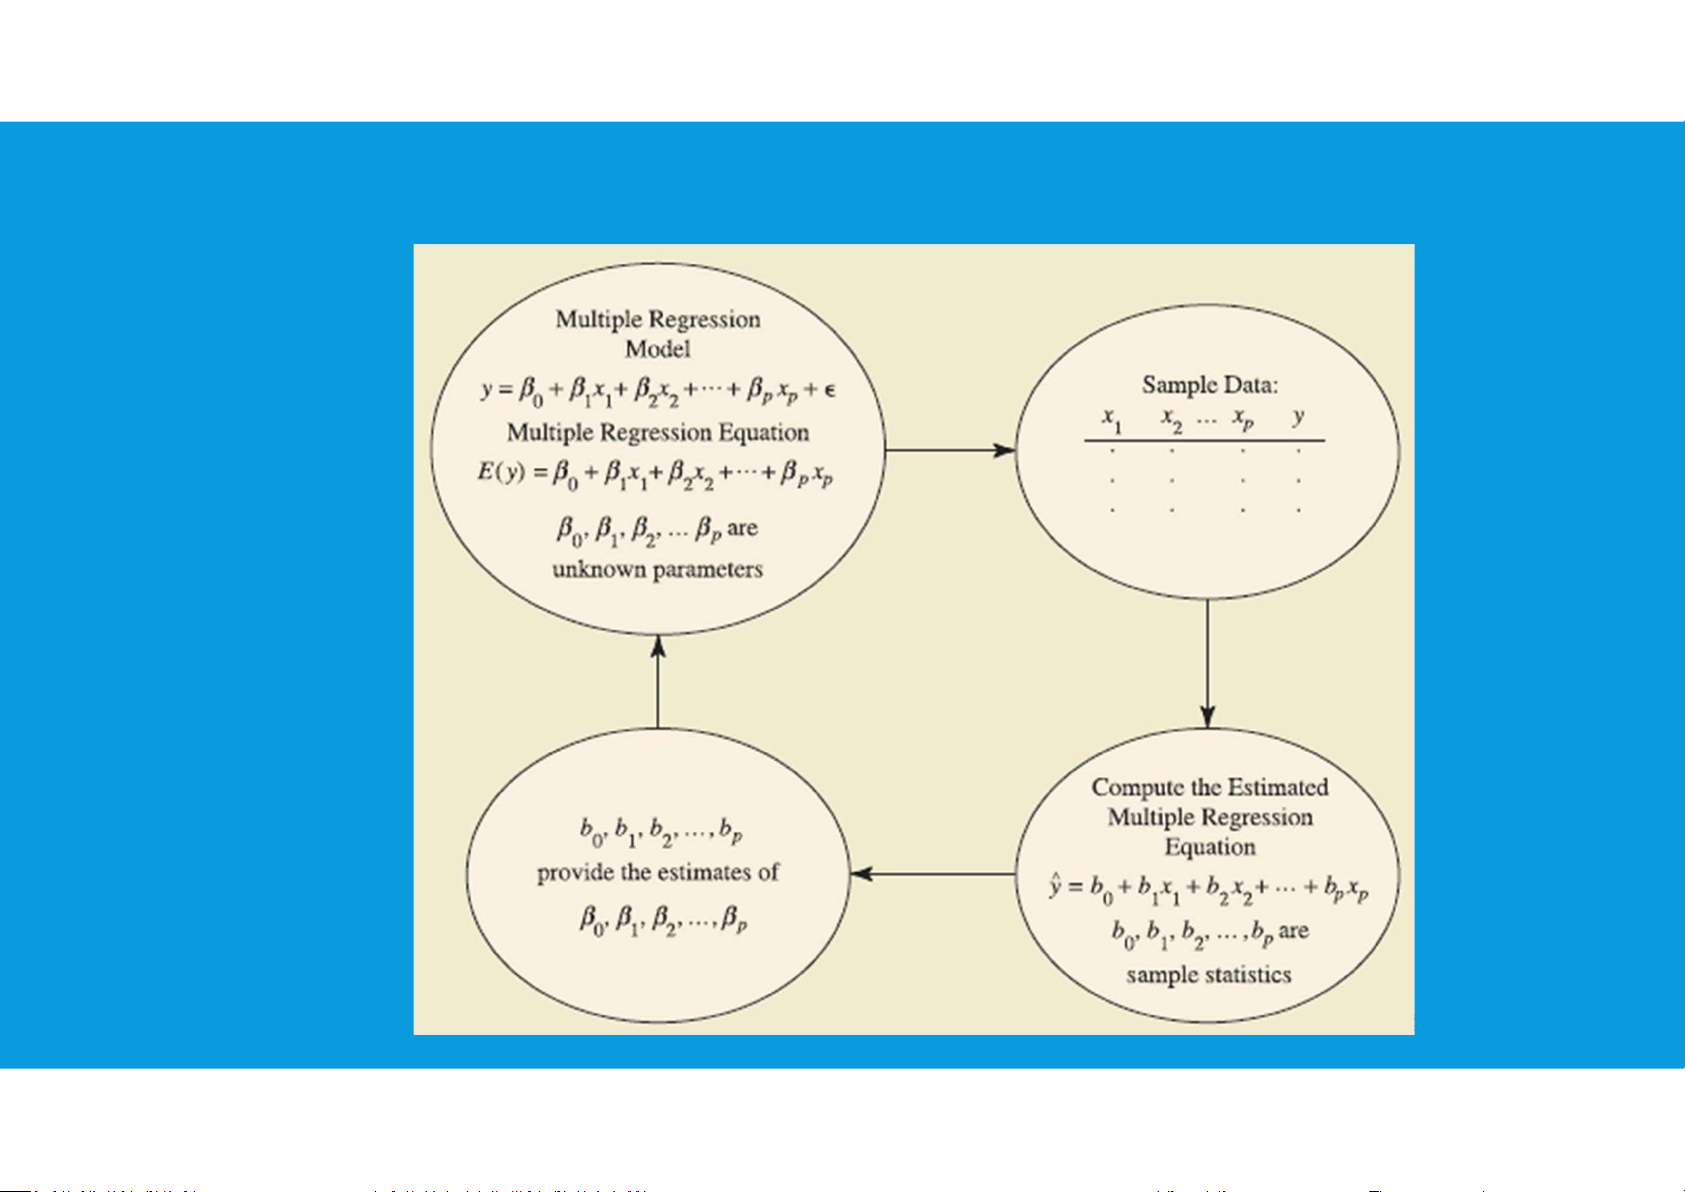
LINEAR REGRESSION ESTIMATION PROCESS Multiple regression 6 lOMoAR cPSD| 45903860 8.3. TREND PROJECTION
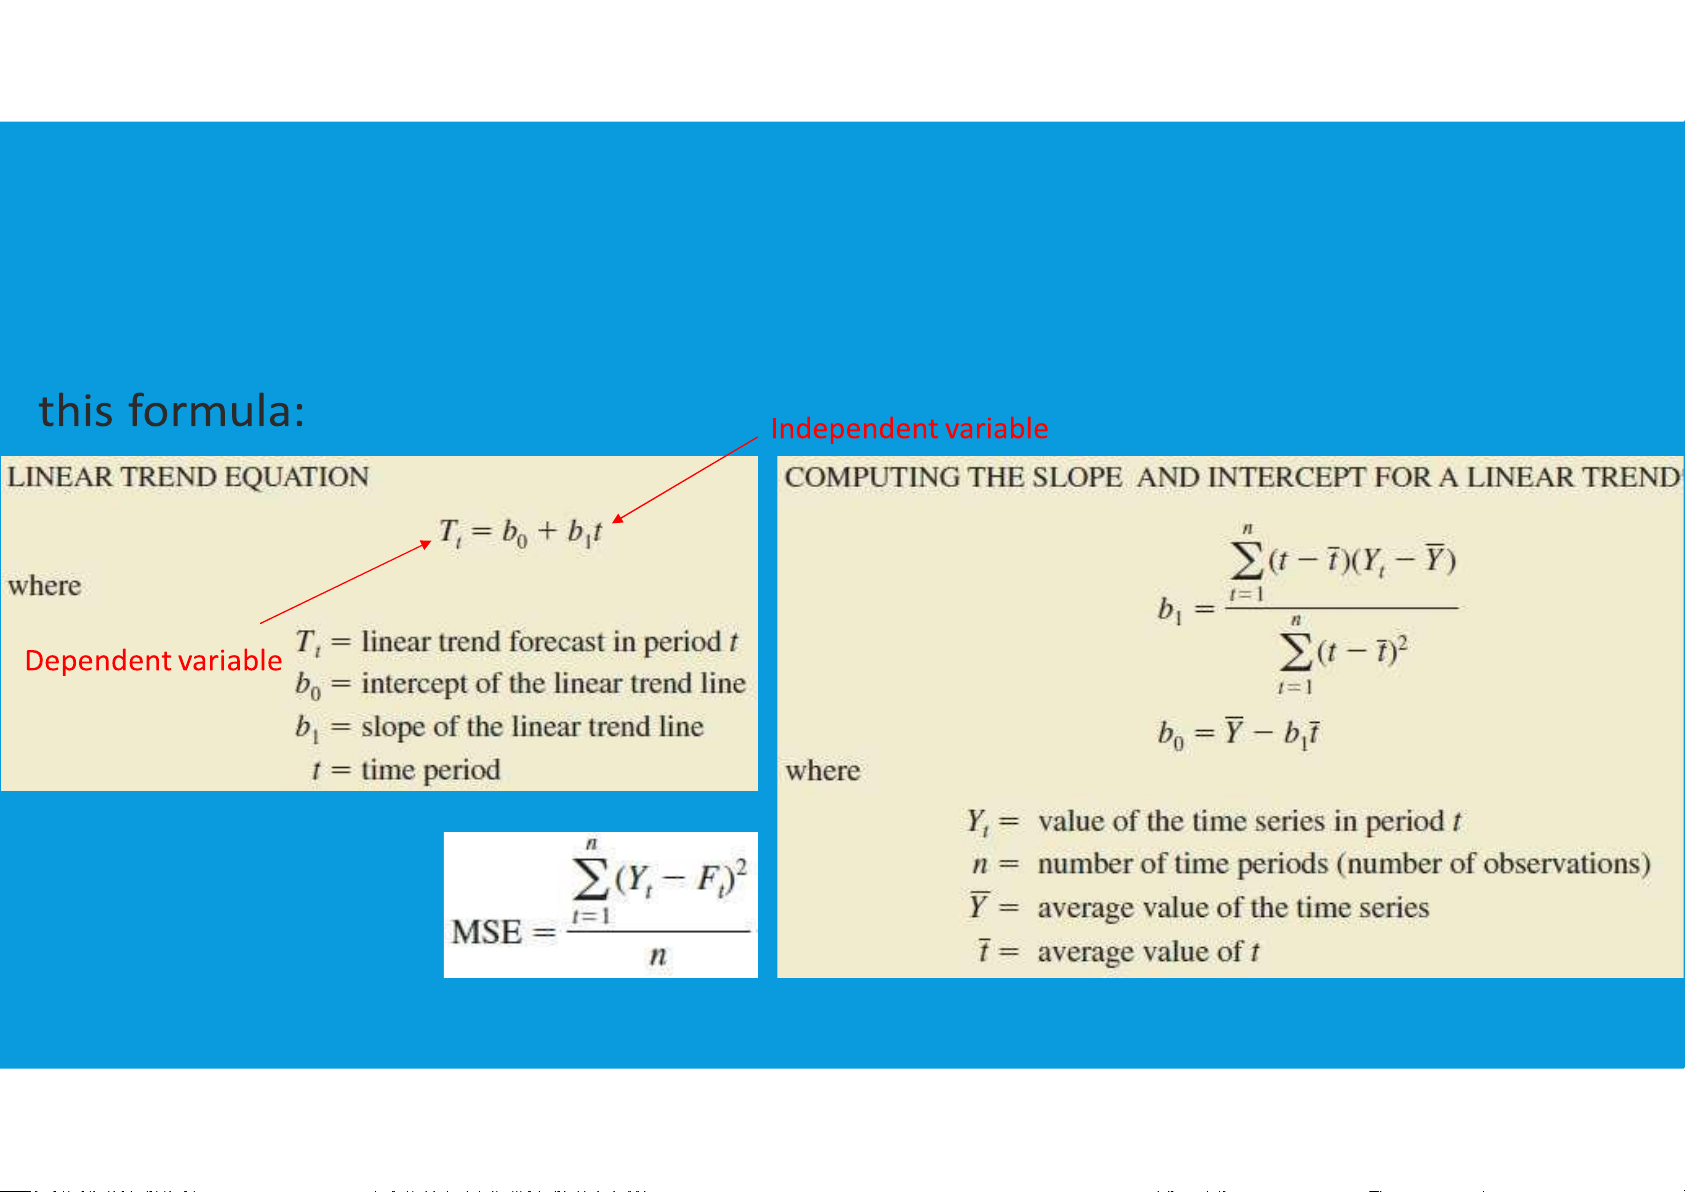
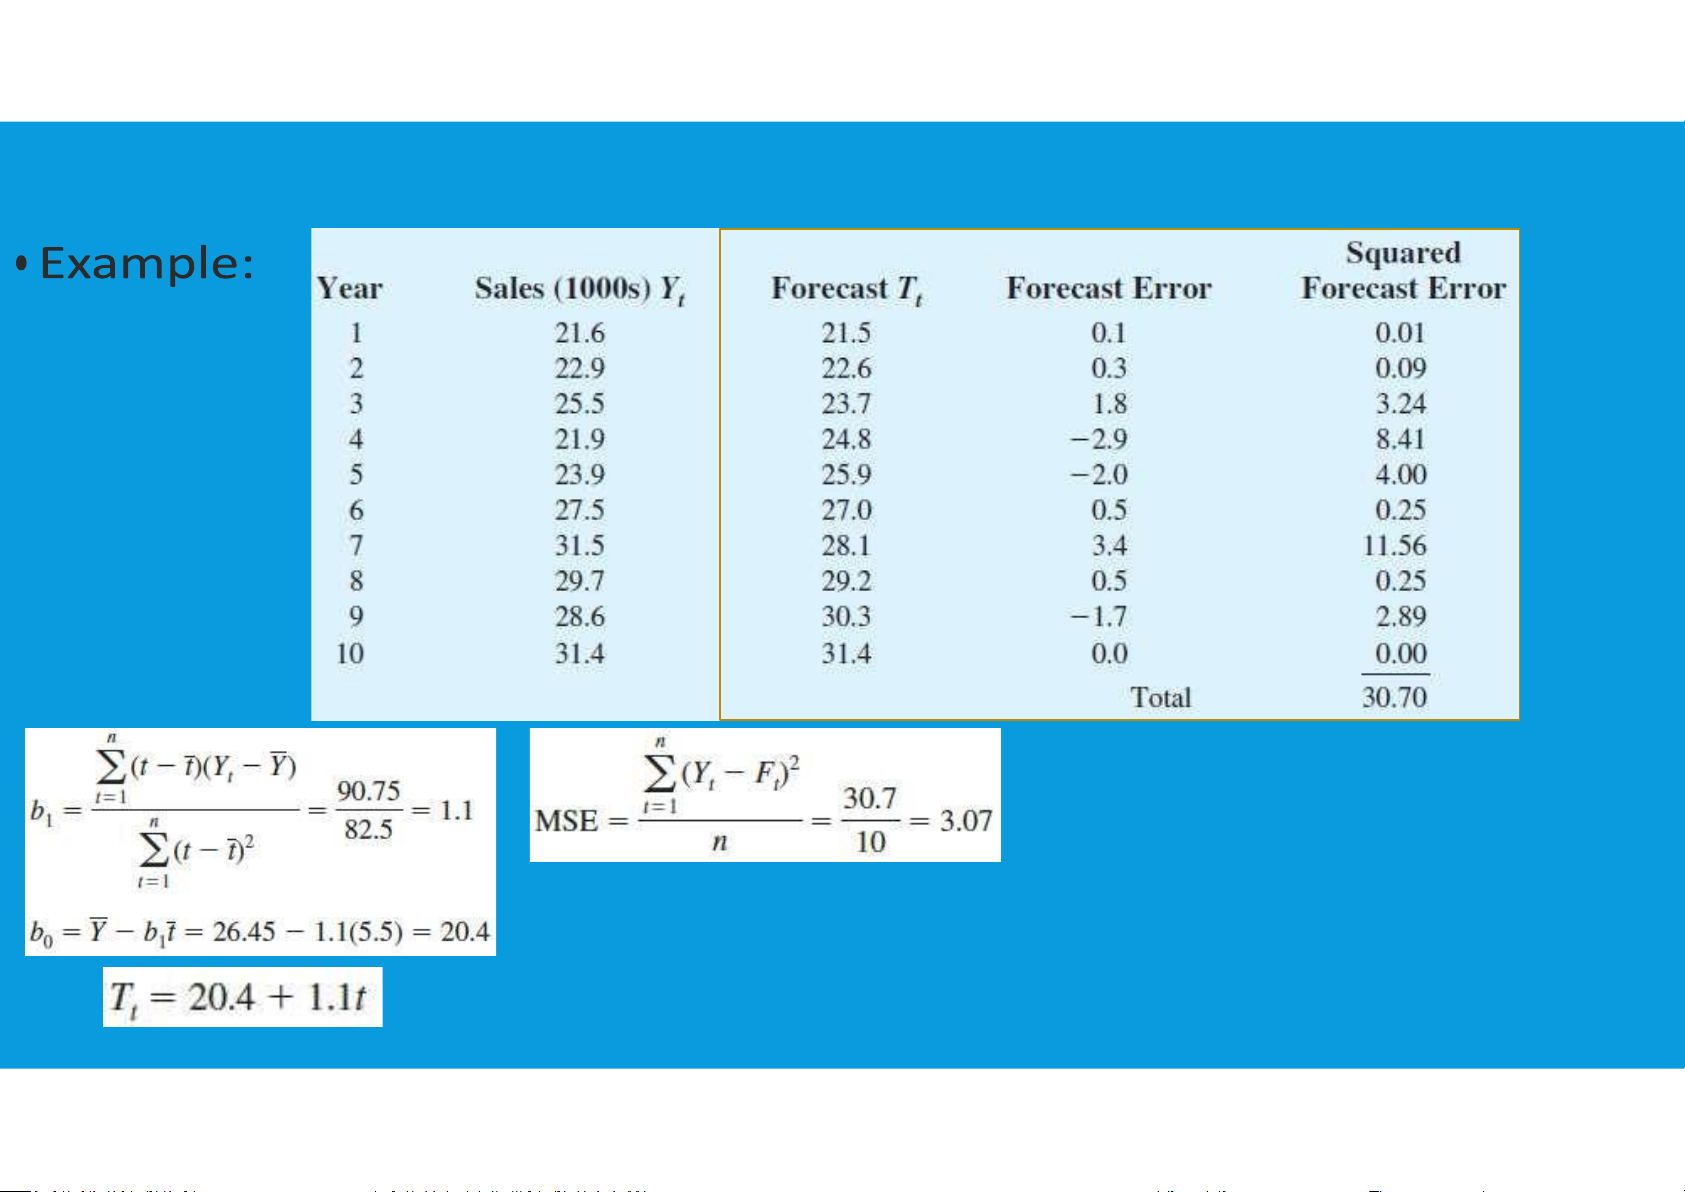
•Linear Trend Regression: A time series technique that computes a forecast with
trend by drawing a straight line through a set of data using lOMoAR cPSD| 45903860 8.3. TREND PROJECTION 8 lOMoAR cPSD| 45903860 8.3. TREND PROJECTION
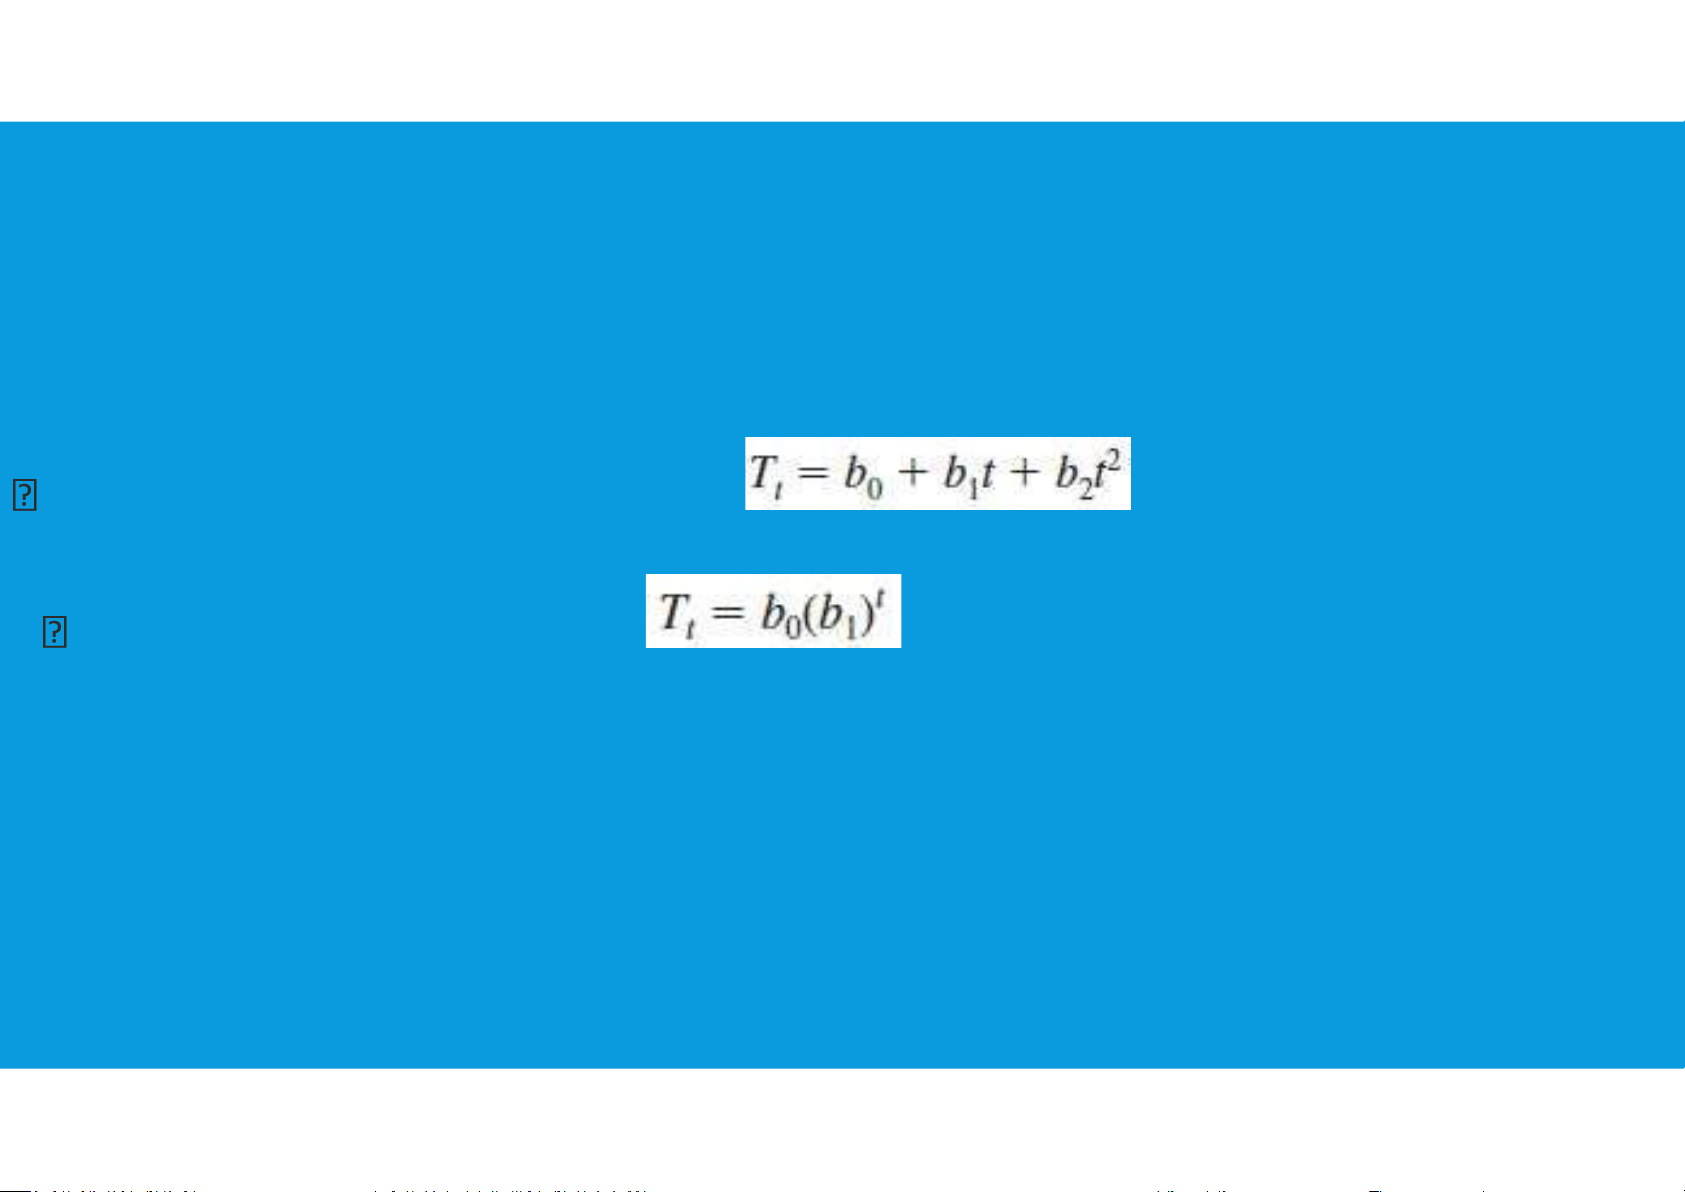
•Nonlinear Trend Regression: a curvilinear function appears to be needed to model the long-term trend: Quadratic trend equation: Exponential trend equation: lOMoAR cPSD| 45903860 10 lOMoAR cPSD| 45903860 i i i i i i i i i
DECOMPOSITION OF THE TOTAL DEVIATION IN A LINEAR lOMoAR cPSD| 45903860
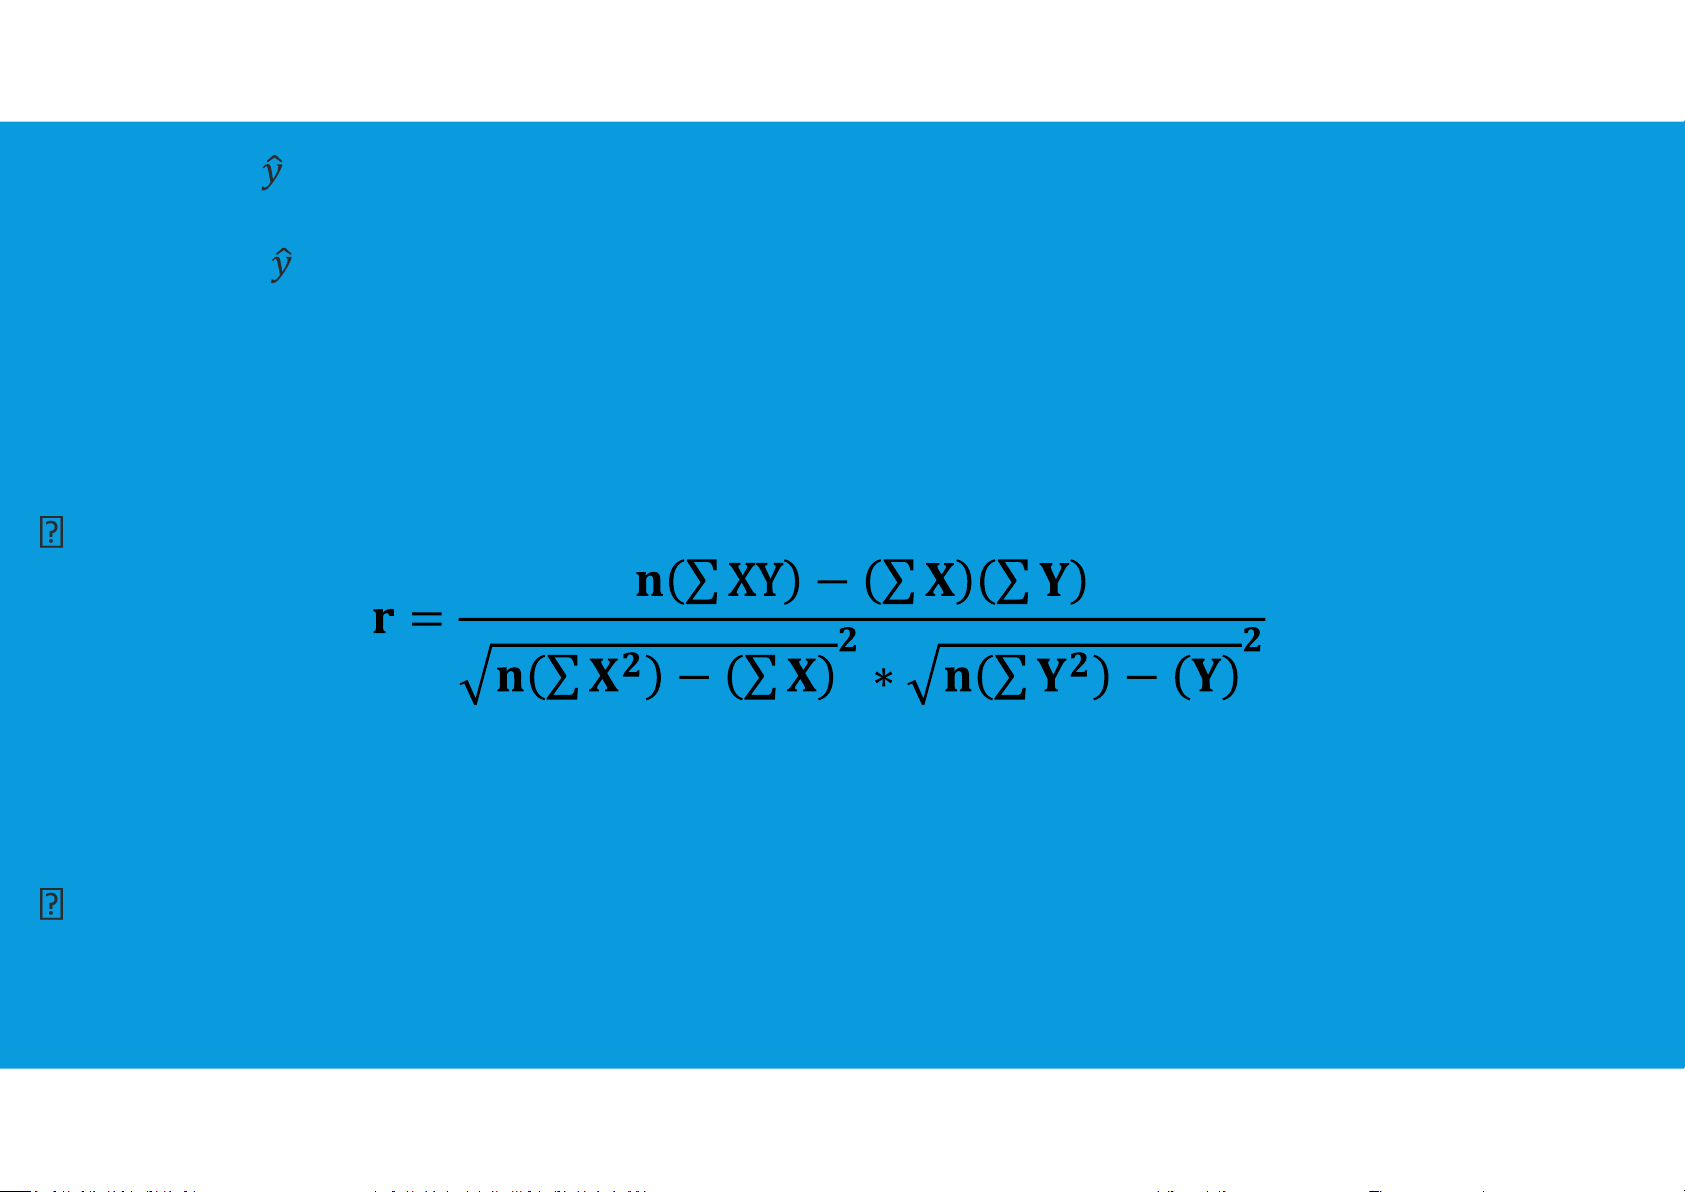
CORRELATION COEFFICIENT - HOW GOOD IS THE FIT?
•Correlation coefficient (r) measures the direction and strength of the linear
relationship between two variables.
The closer the r value is to 1.0 the better the regression line fits the data points.
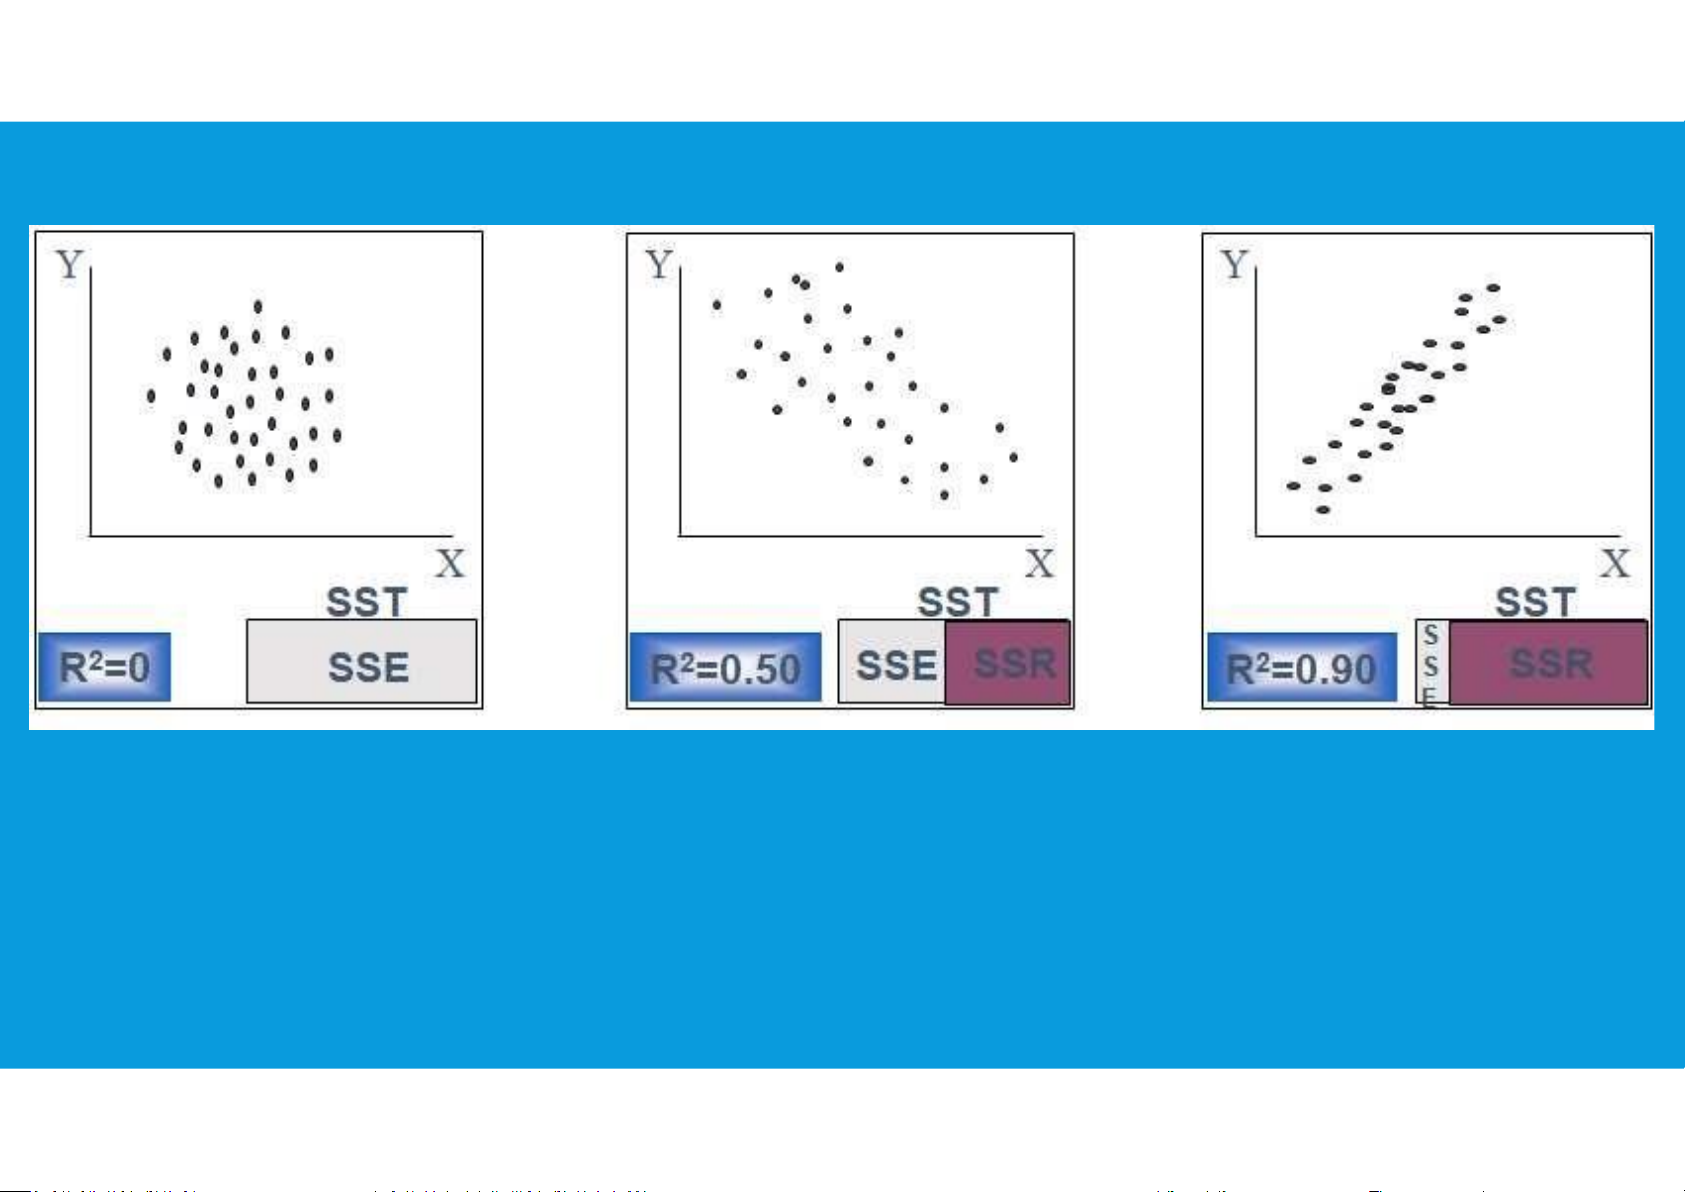
•Coefficient of determination (r2) measures the amount of variation in the
dependent variable about its mean that is explained by the regression line.
provides a measure of the goodness of fit for the estimated regression equation
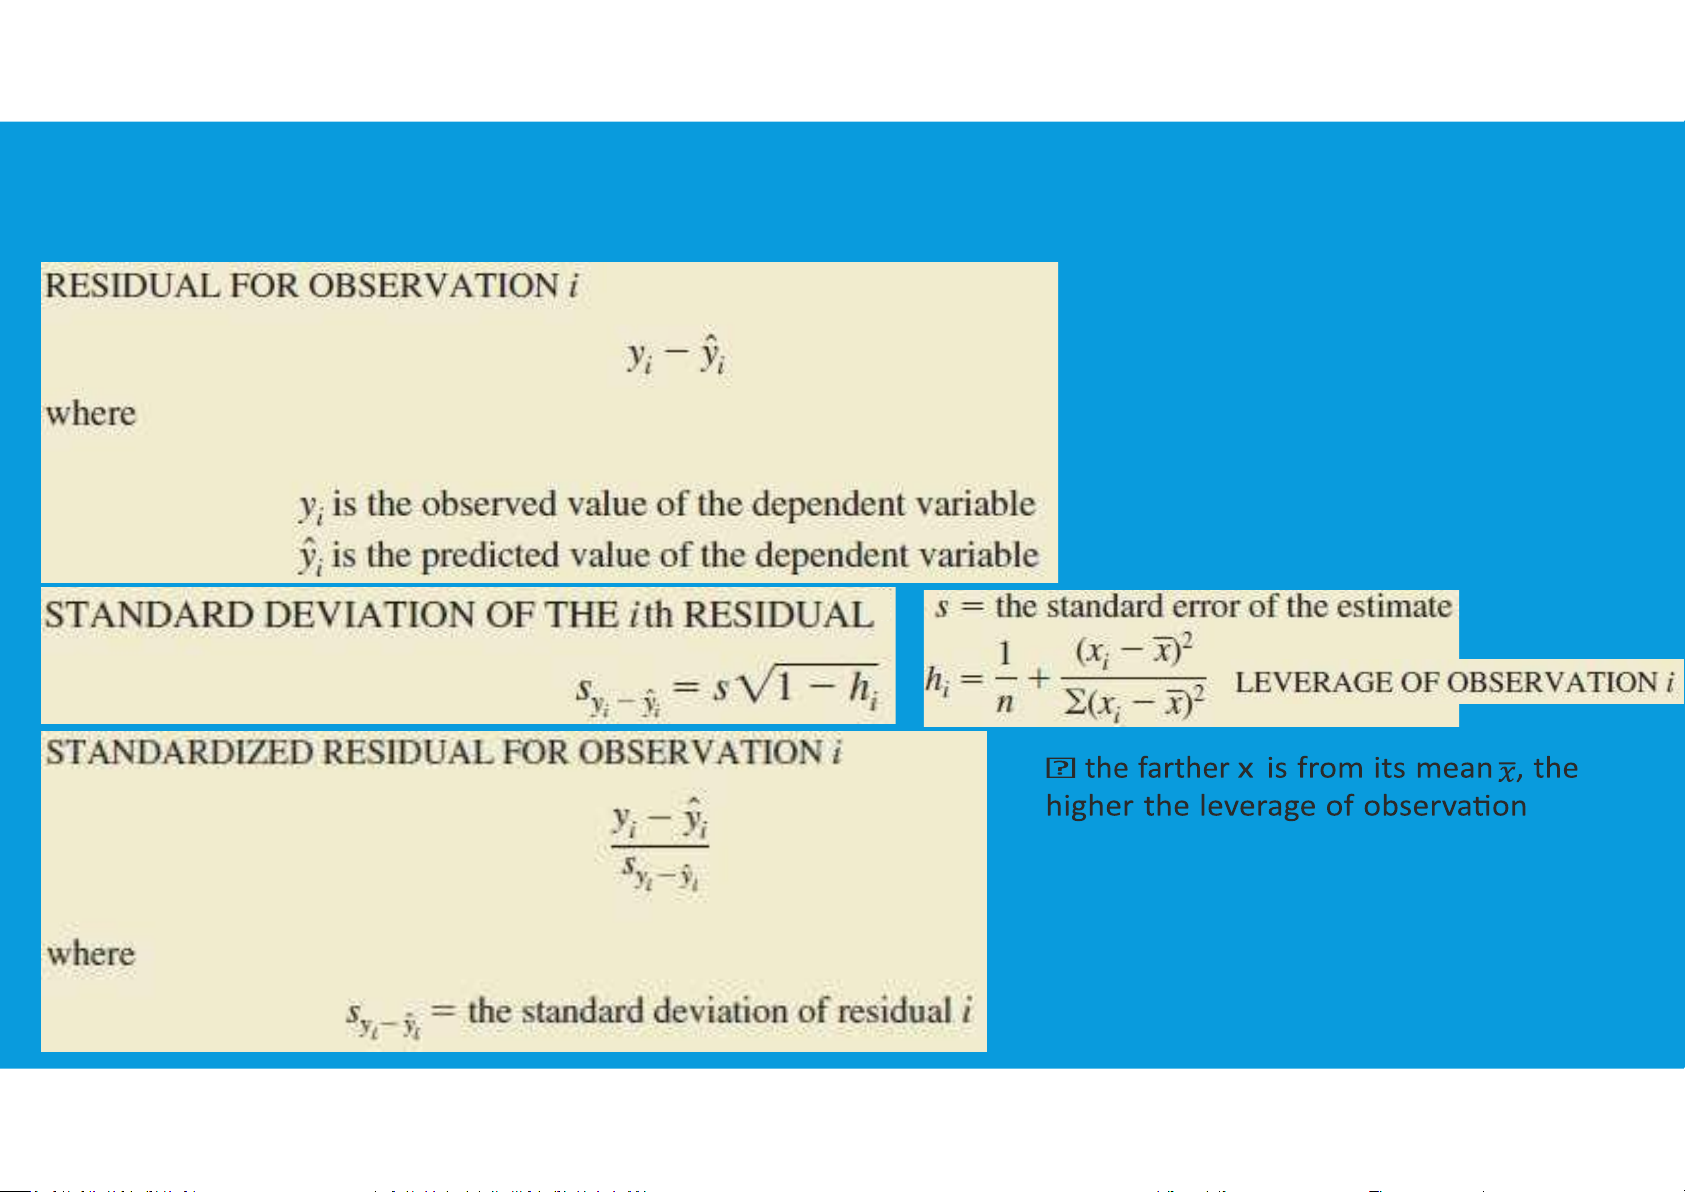
•Values of (r2) close to 1.0 are desirable. 12 lOMoAR cPSD| 45903860 HOW GOOD IS THE REGRESSION lOMoAR cPSD| 45903860 RESIDUAL ANALYSIS i i 14 lOMoAR cPSD| 45903860
DETECTING OUTLIERS AND INFLUENTIAL OBSERVATIONS
•Outliers: The presence of one or more outliers in a data set tends to increase s,
the standard error of the estimate increase , , the standard deviation of residual i
•Influential observations: the value of the independent variable may have a strong
influence on the regression results lOMoAR cPSD| 45903860
THE F TEST OF A MULTIPLE REGRESSION MODEL 16 lOMoAR cPSD| 45903860
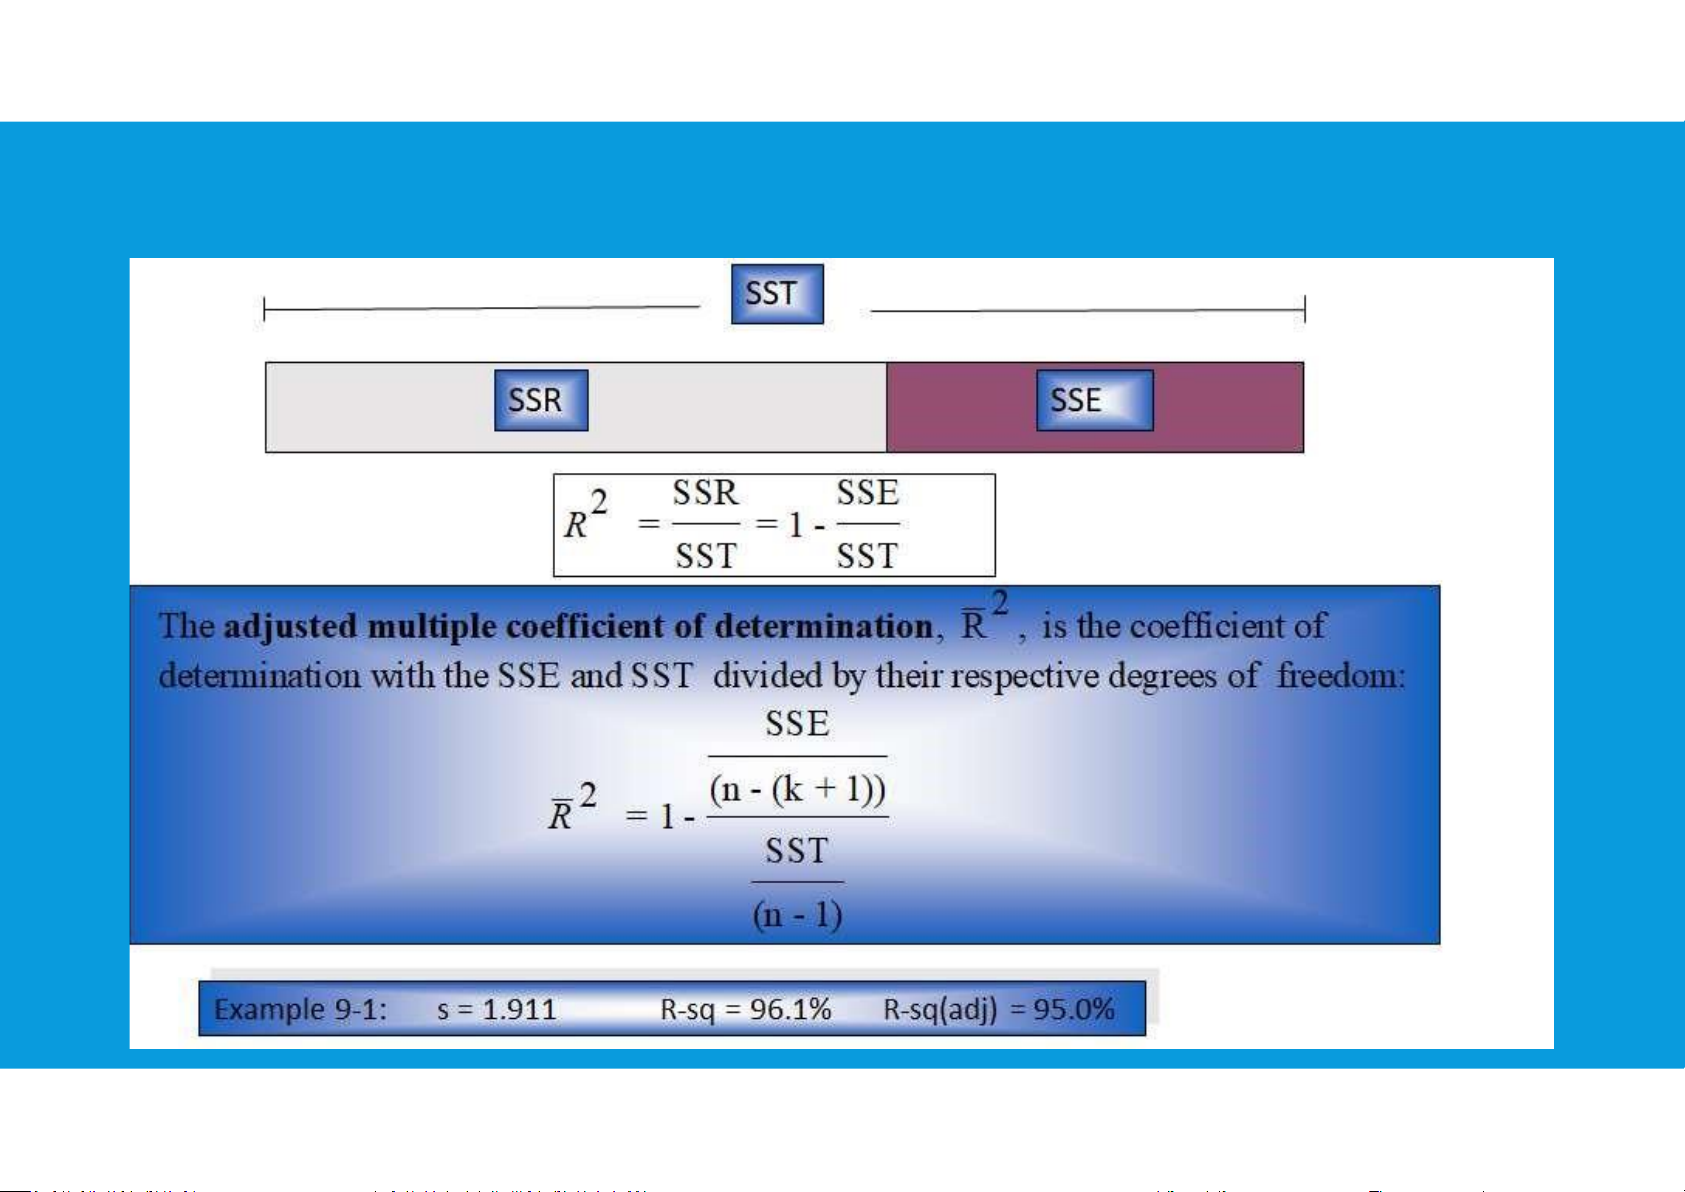
DECOMPOSITION OF THE SUM OF SQUARES AND THE ADJUSTED COEFFICIENT OF DETERMINATION lOMoAR cPSD| 45903860
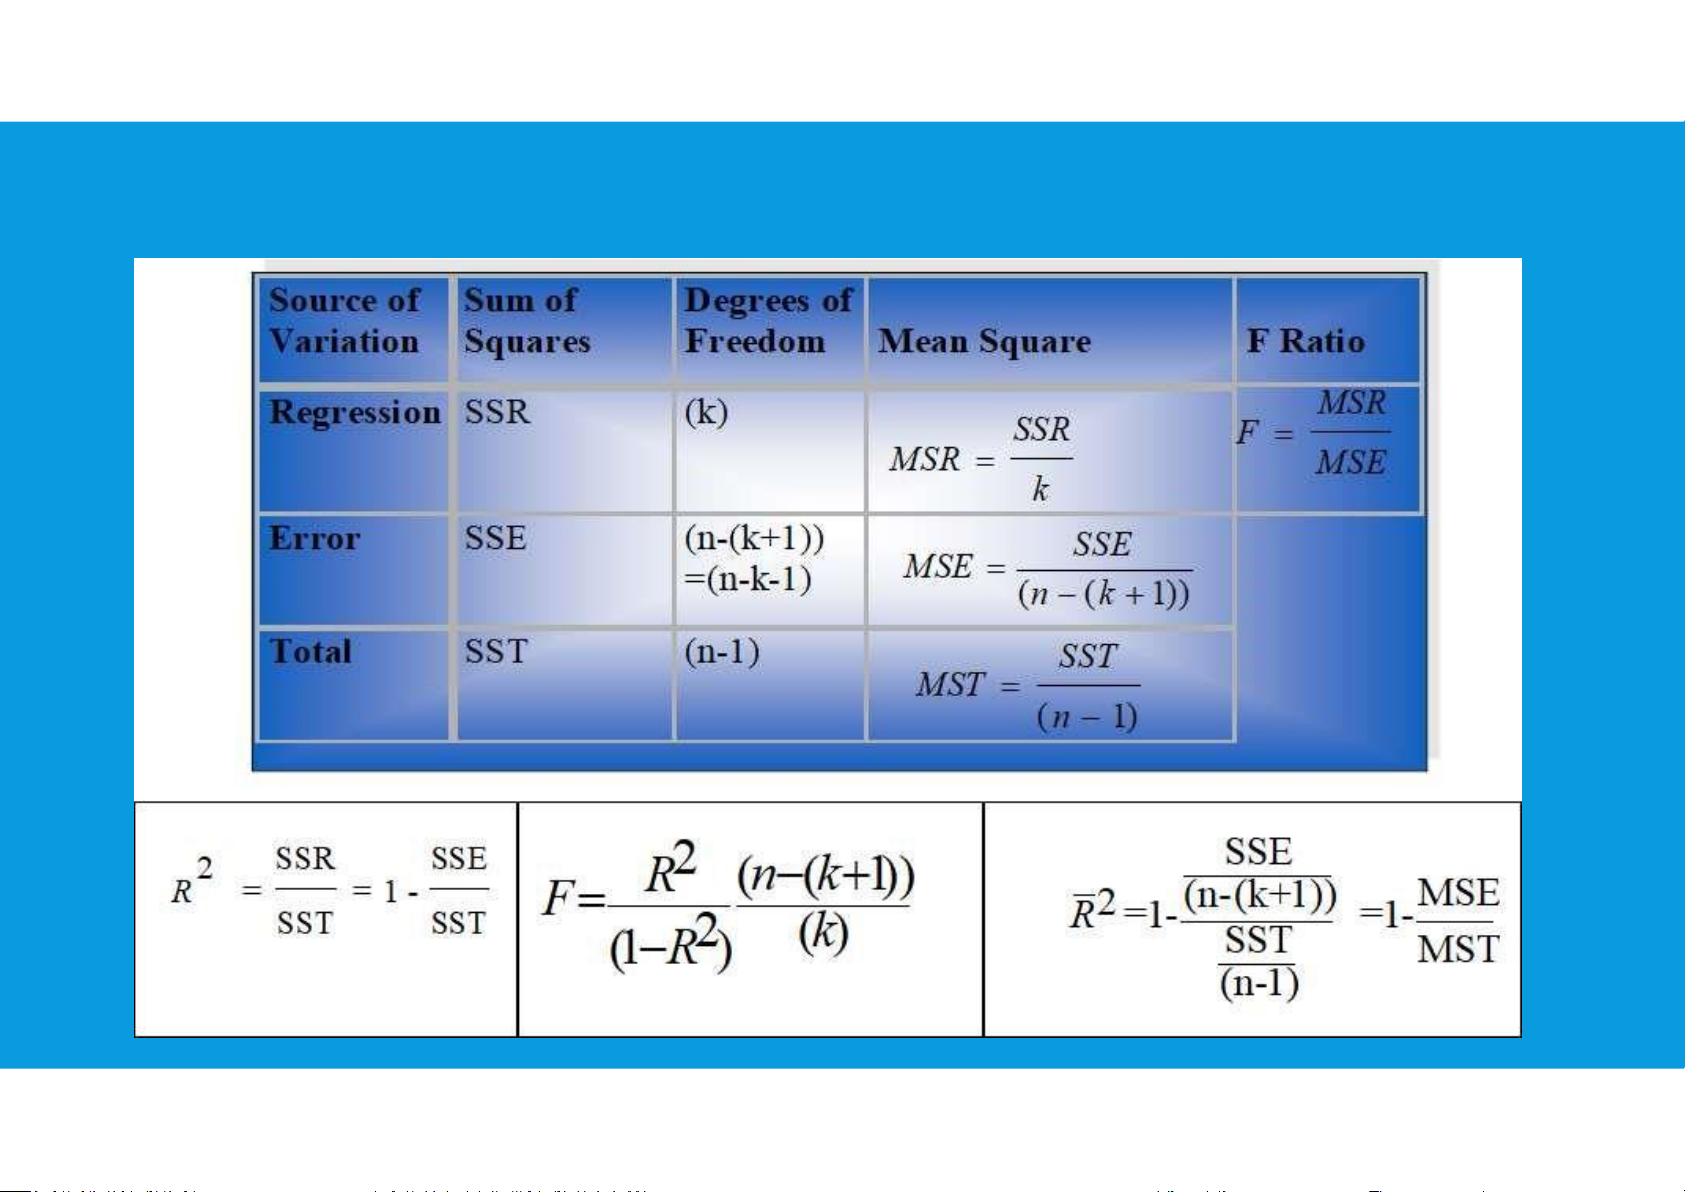
MEASURES OF PERFORMANCE IN MULTIPLE REGRESSION AND THE ANOVA TABLE 18 lOMoAR cPSD| 45903860
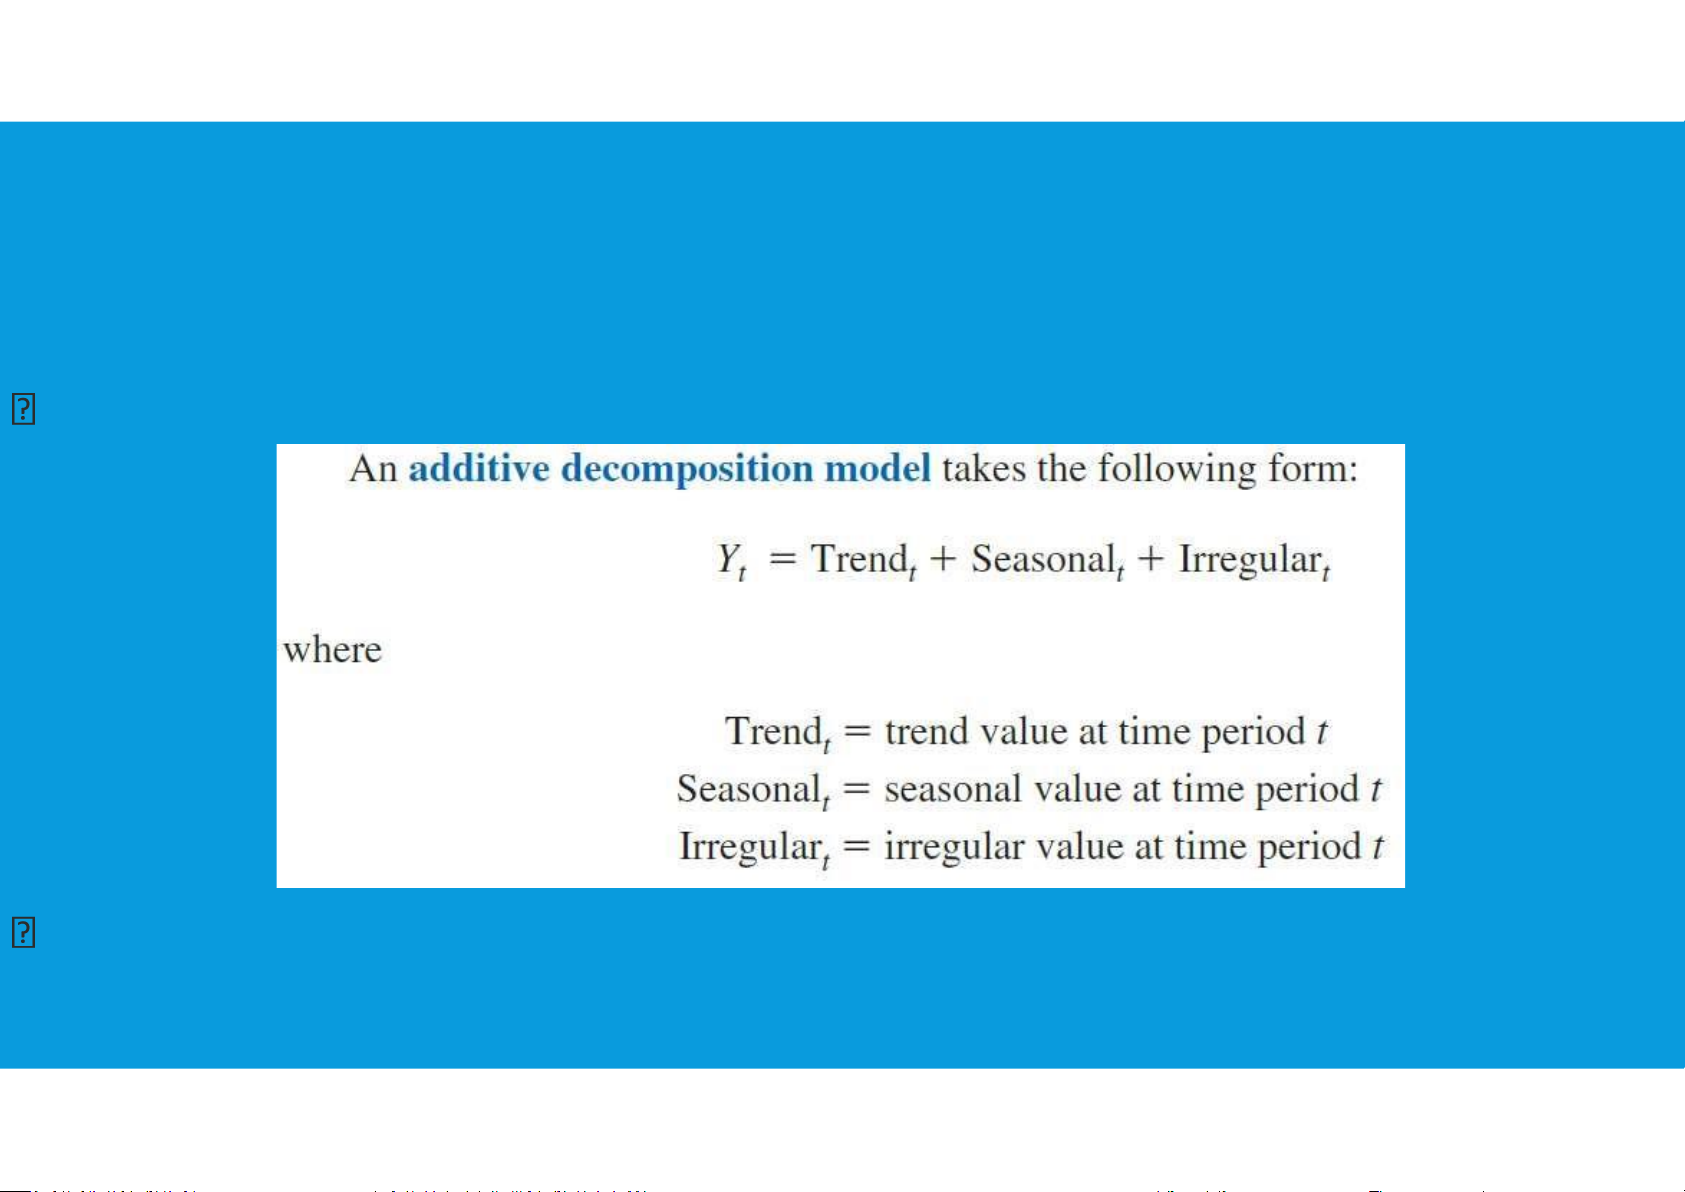
8.4. TIME SERIES DECOMPOSITION
•Time series decomposition can be used to separate or decompose a time series
into seasonal, trend, and irregular components.
get a better understanding of the time series
an additive model is appropriate in situations where the seasonal fluctuations do
not depend upon the level of the time series. lOMoAR cPSD| 45903860
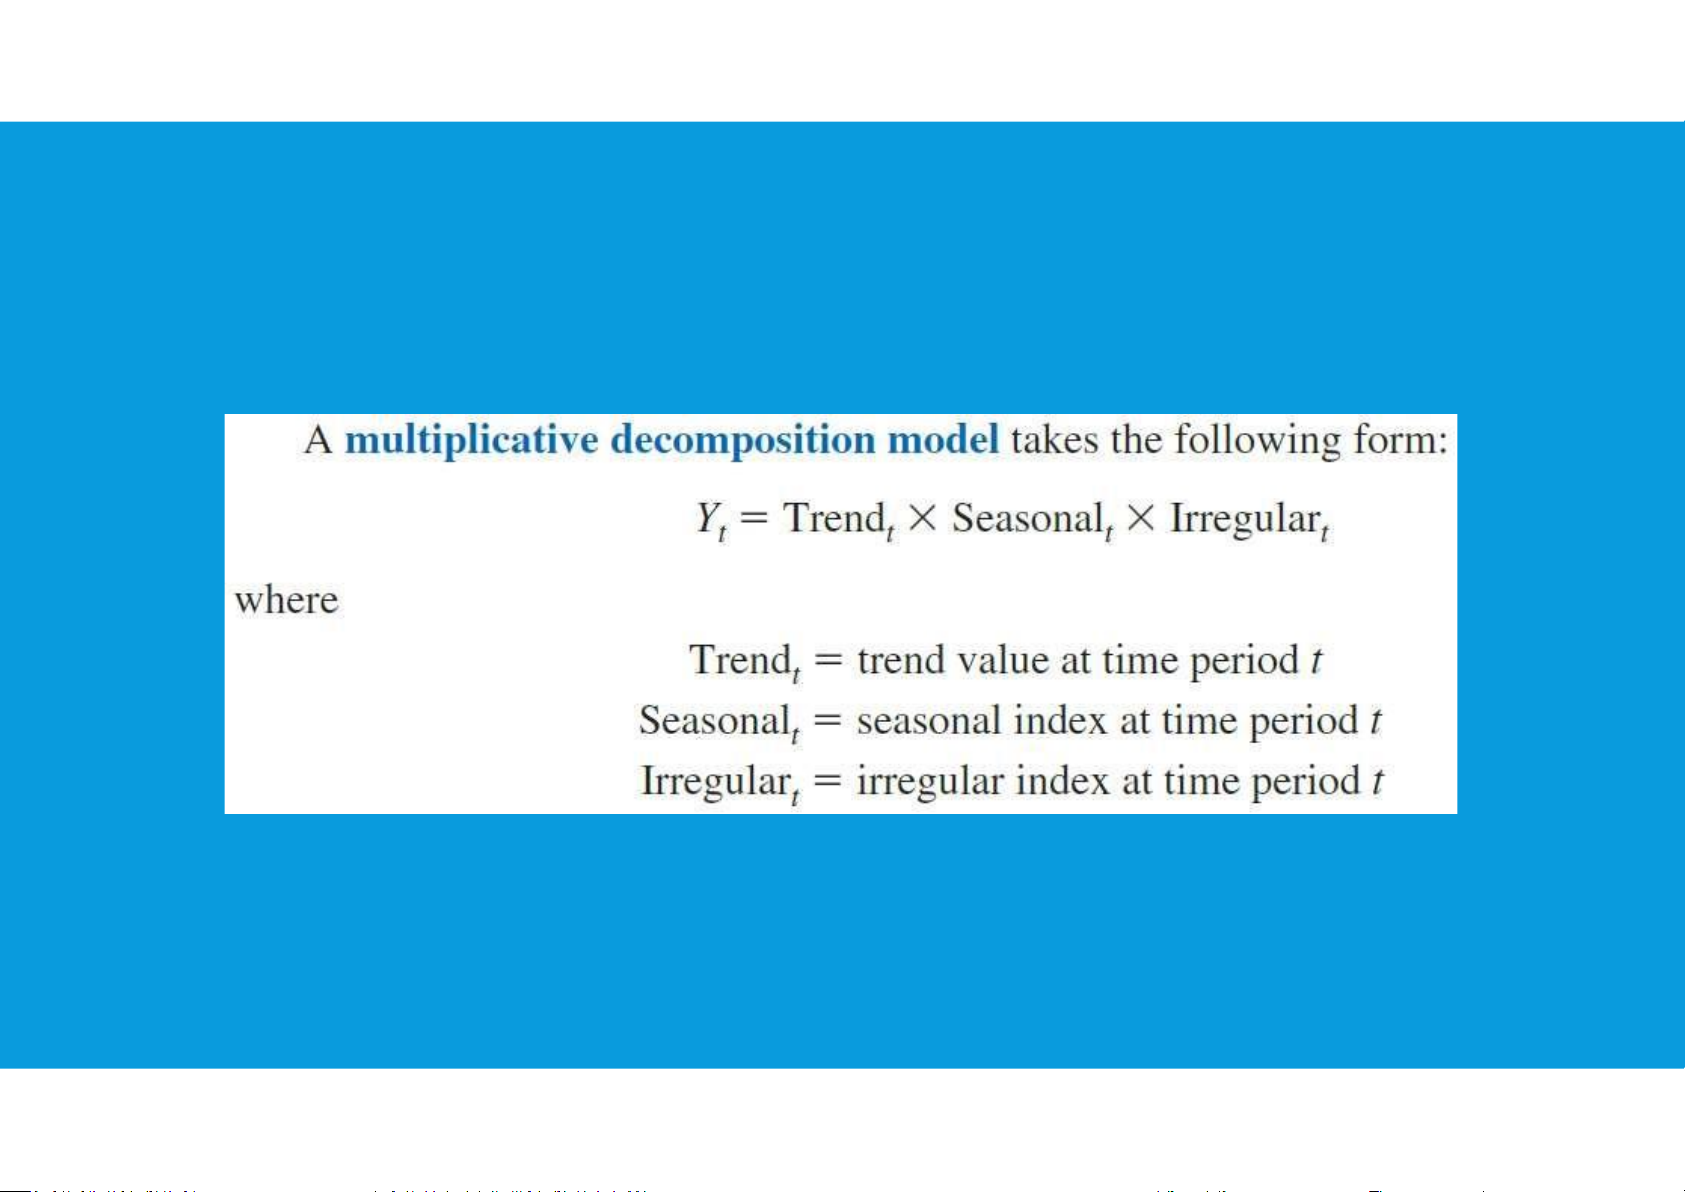
8.4. TIME SERIES DECOMPOSITION
•If the seasonal fluctuations change over time, growing larger as the sales volume
increases because of a long-term linear trend, then a multiplicative model should be used 20
Tài liệu liên quan:
-
Data and Statistics | Bài giảng số 1 chương 1 học phần Applied statistics | Trường Đại học Quốc tế, Đại học Quốc gia Thành phố Hồ Chí Minh
266 133 -

Data and Statistics | Bài giảng số 2 chương 1 học phần Applied statistics | Trường Đại học Quốc tế, Đại học Quốc gia Thành phố Hồ Chí Minh
361 181 -

Plotting and Smoothing data | Bài giảng số 3 chương 2 học phần Applied statistics | Trường Đại học Quốc tế, Đại học Quốc gia Thành phố Hồ Chí Minh
203 102 -

Descriptive statistics | Bài giảng số 4 chương 3 học phần Applied statistics | Trường Đại học Quốc tế, Đại học Quốc gia Thành phố Hồ Chí Minh
207 104 -

Descriptive statistics | Bài giảng số 5 chương 3 học phần Applied statistics | Trường Đại học Quốc tế, Đại học Quốc gia Thành phố Hồ Chí Minh
242 121