Lecture 4 - ENEE1006IU
Tài liệu học tập môn Applied statistics (ENEE1006IU) tại Trường Đại học Quốc tế, Đại học Quốc gia Thành phố Hồ Chí Minh. Tài liệu gồm 24 trang giúp bạn ôn tập hiệu quả và đạt điểm cao! Mời bạn đọc đón xem!
Môn: Applied statistics (ENEE1006IU) 47 tài liệu
Trường: Trường Đại học Quốc tế, Đại học Quốc gia Thành phố Hồ Chí Minh 1.9 K tài liệu
Tác giả:


Preview text:
lOMoARcPSD|359 747 69 APPLIED STATISTICS COURSE CODE: ENEE1006IU Lecture 4:
Chapter 3: Descriptive statistics
(3 credits: 2 is for lecture, 1 is for lab-work)
Instructor: TRAN THANH TU Email: tttu@hcmiu.edu.vn tttu@hcmiu.edu.vn 1 lOMoARcPSD|359 747 69 REVIEW PREVIOUS LECTURES tttu@hcmiu.edu.vn 2 lOMoARcPSD|359 747 69 REVIEW PREVIOUS LECTURES
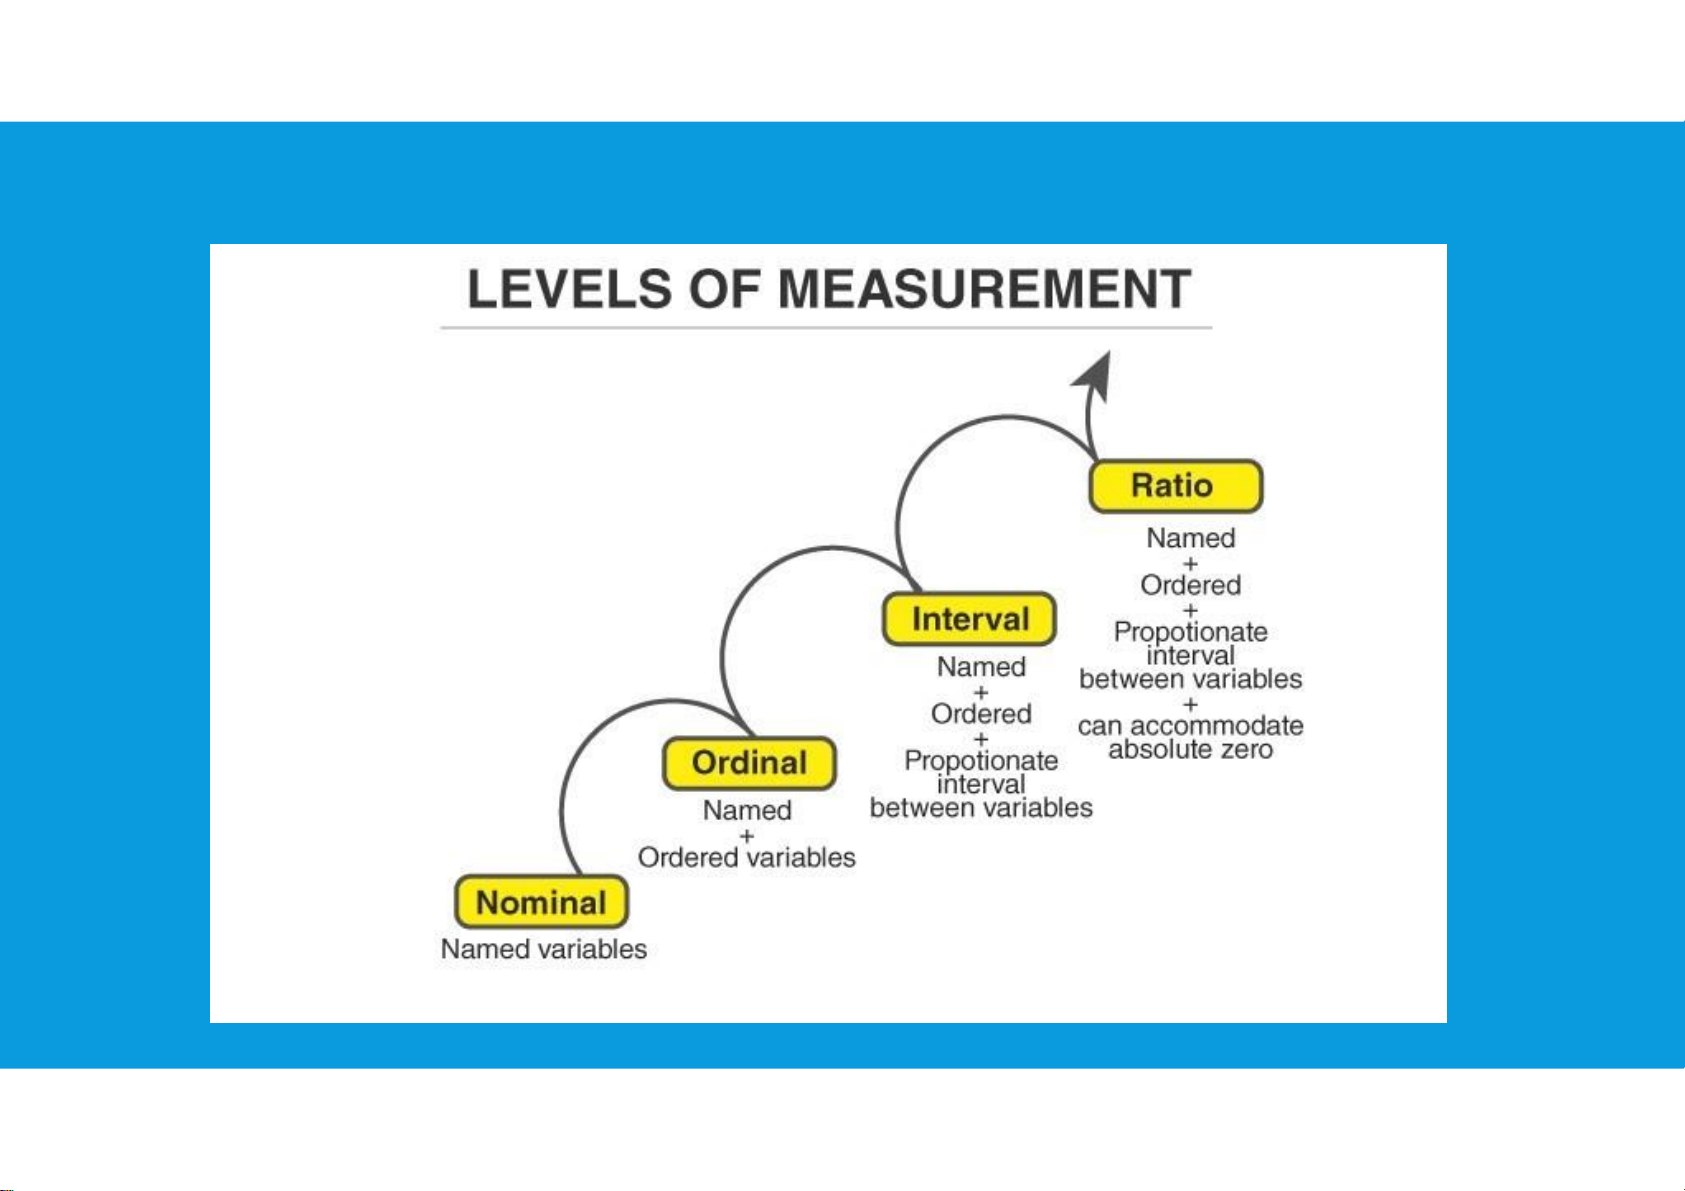
Examples of interval and ratio scales:
Ratio scale: a weight of 4 grams is twice as heavy as a weight of 2 grams Interval
scale: a temperature of 10 degrees C should not be considered twice as hot as 5
degrees C. If it were, a conflict would be created because 10 degrees C is 50
degrees F and 5 degrees C is 41 degrees F. Clearly, 50 degrees is not twice 41 degrees.
a pH of 3 is not twice as acidic as a pH of 6, because pH is not a ratio variable.
Ratio scale doesn’t have negative numbers, because of its zero-point feature
Division between two values has meaning
(besides the subtraction like in interval scale)
Allow unit conversion (e.g. kg/gr calories) tttu@hcmiu.edu.vn 3 lOMoARcPSD|359 747 69 TODAY’S CONTENT 3.1. Measures of location 3.2. Measures of variability tttu@hcmiu.edu.vn 4 lOMoARcPSD|359 747 69 3.1. MEASURES OF LOCATION •Mean •Weighted Mean •Median •Geometric Mean •Mode •Percentiles •Quartiles tttu@hcmiu.edu.vn 5 lOMoARcPSD|359 747 69 3.1. MEASURES OF LOCATION
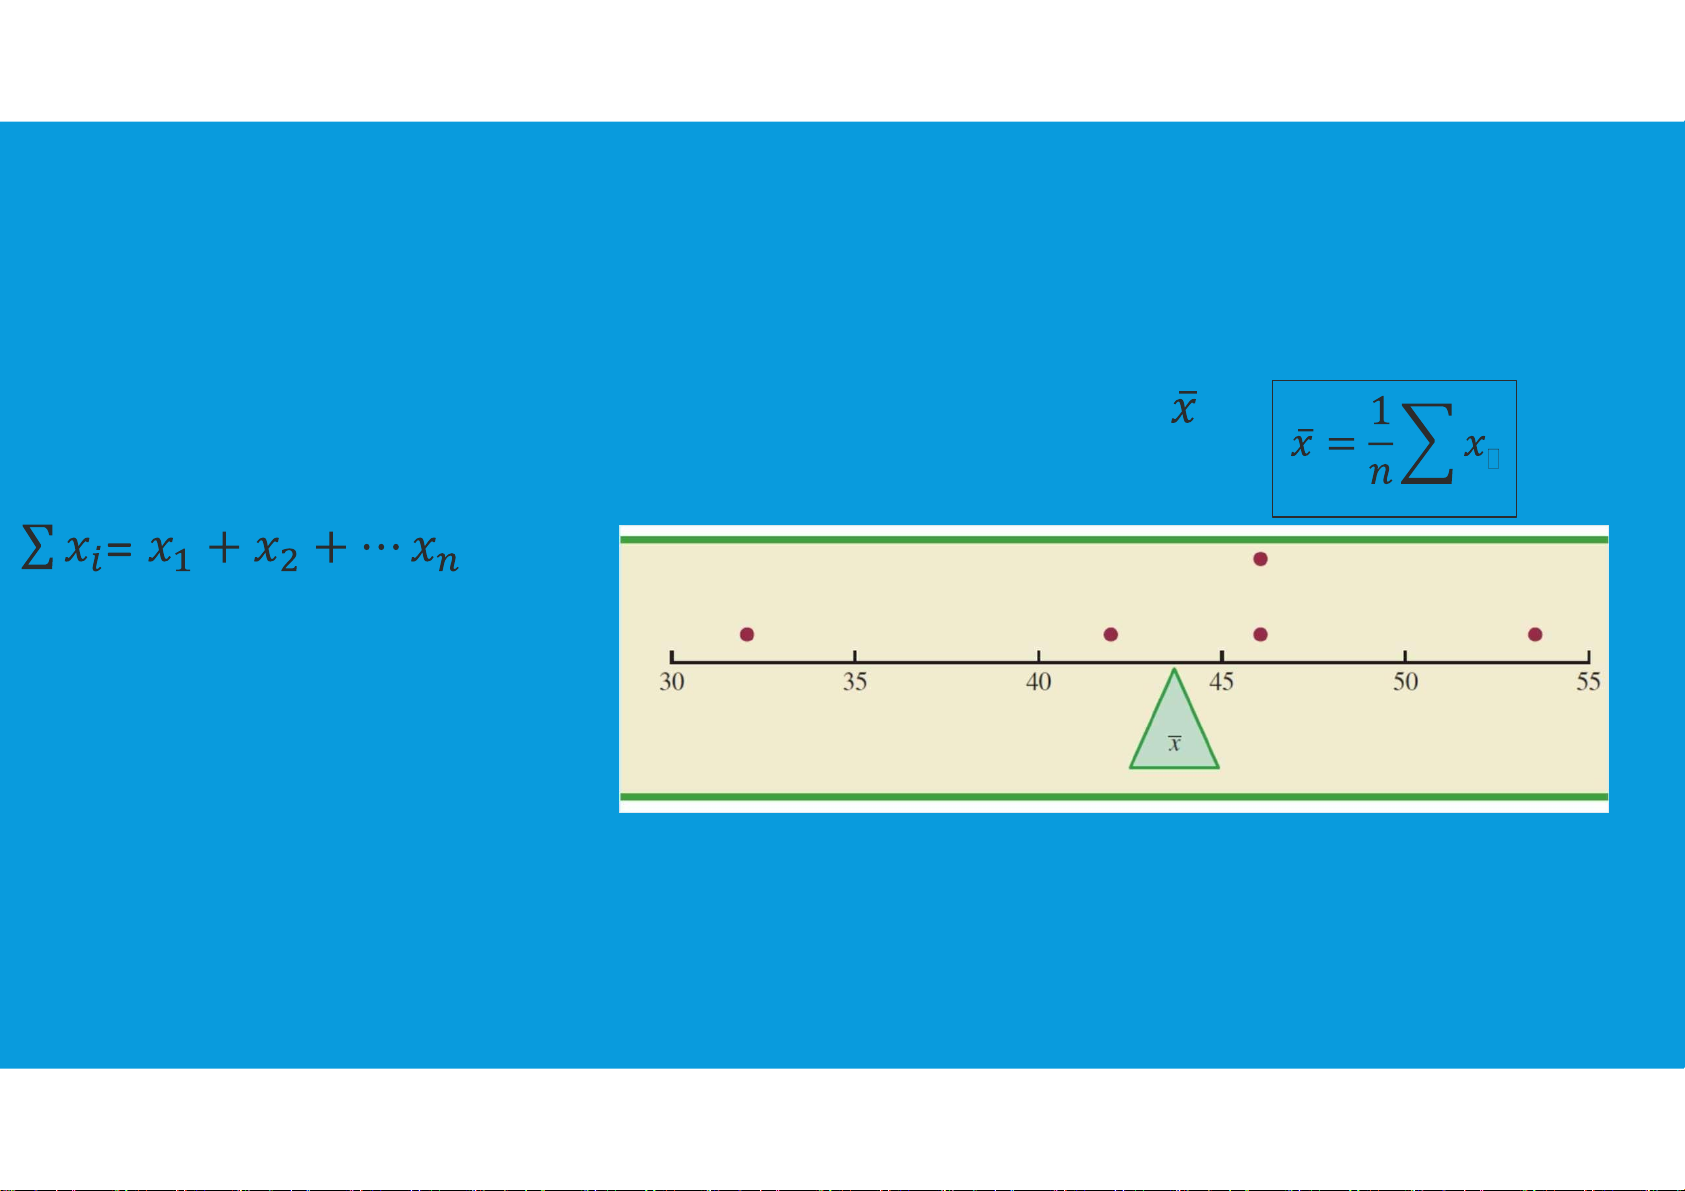
•Mean (average value): provides a measure of central location for the data
-if the data are for a sample: the mean is denoted by ( ) n: number of observation
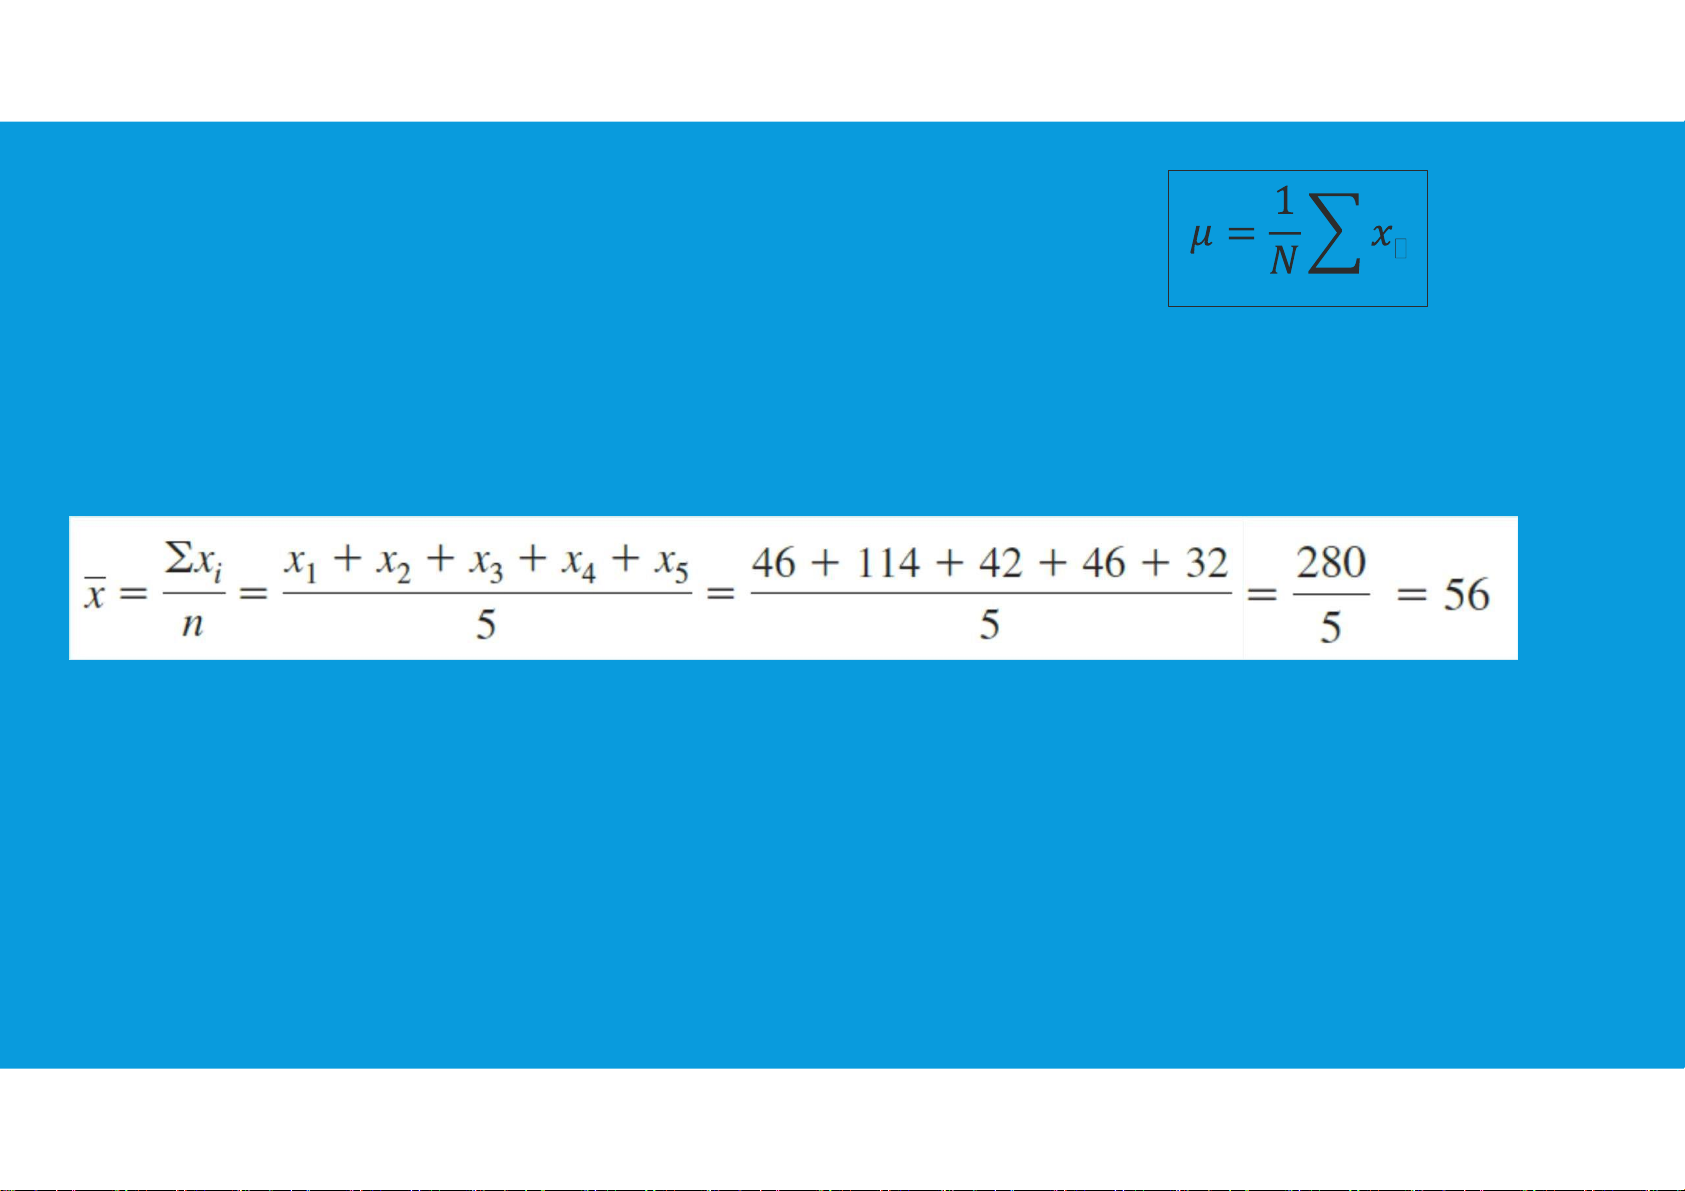
- if the data are for a population: the mean is denoted by the Greek letter µ tttu@hcmiu.edu.vn 6 lOMoARcPSD|359 747 69
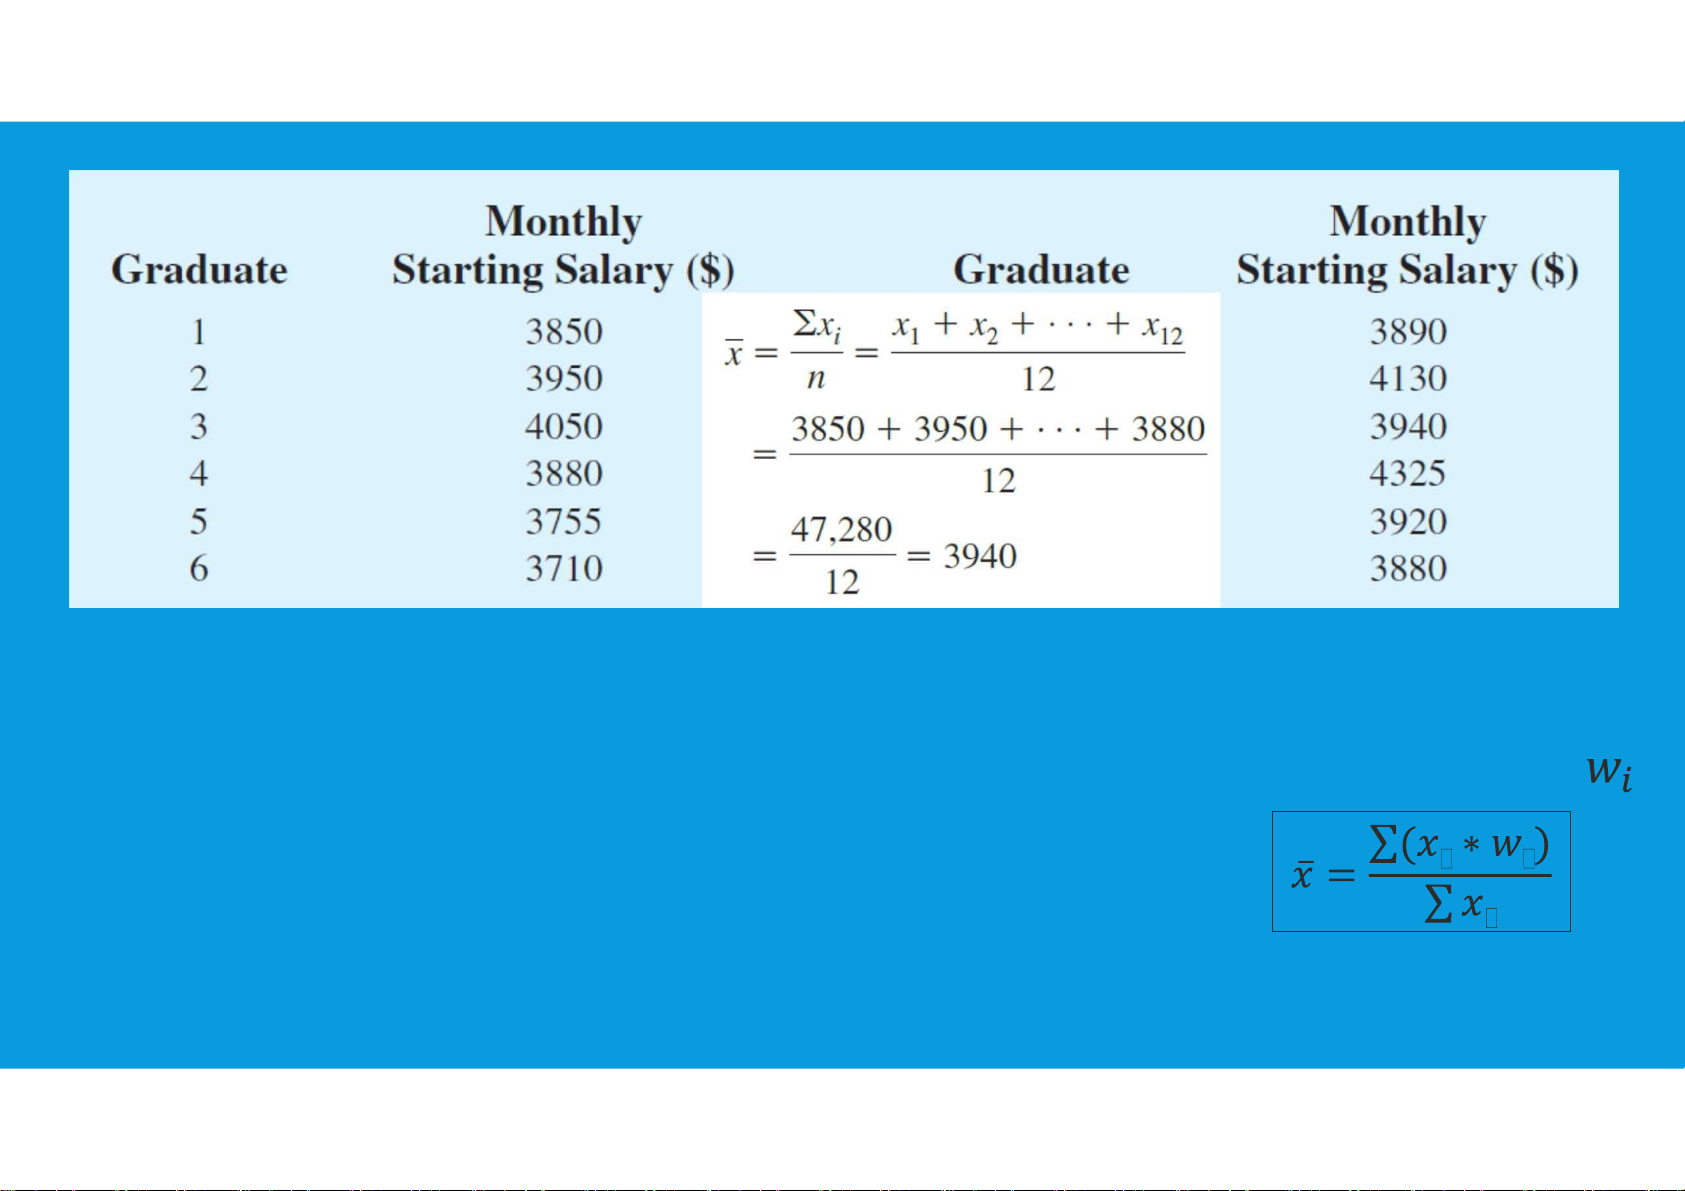
N: total observations in a population 3.1. MEASURES OF LOCATION Mean: Example tttu@hcmiu.edu.vn 7 lOMoARcPSD|359 747 69 3.1. MEASURES OF LOCATION
•Weighted Mean: in n observations, each observation i shares the weight
(Mean: each observation share the same weight w=1/n) tttu@hcmiu.edu.vn 8 lOMoARcPSD|359 747 69 3.1. MEASURES OF LOCATION
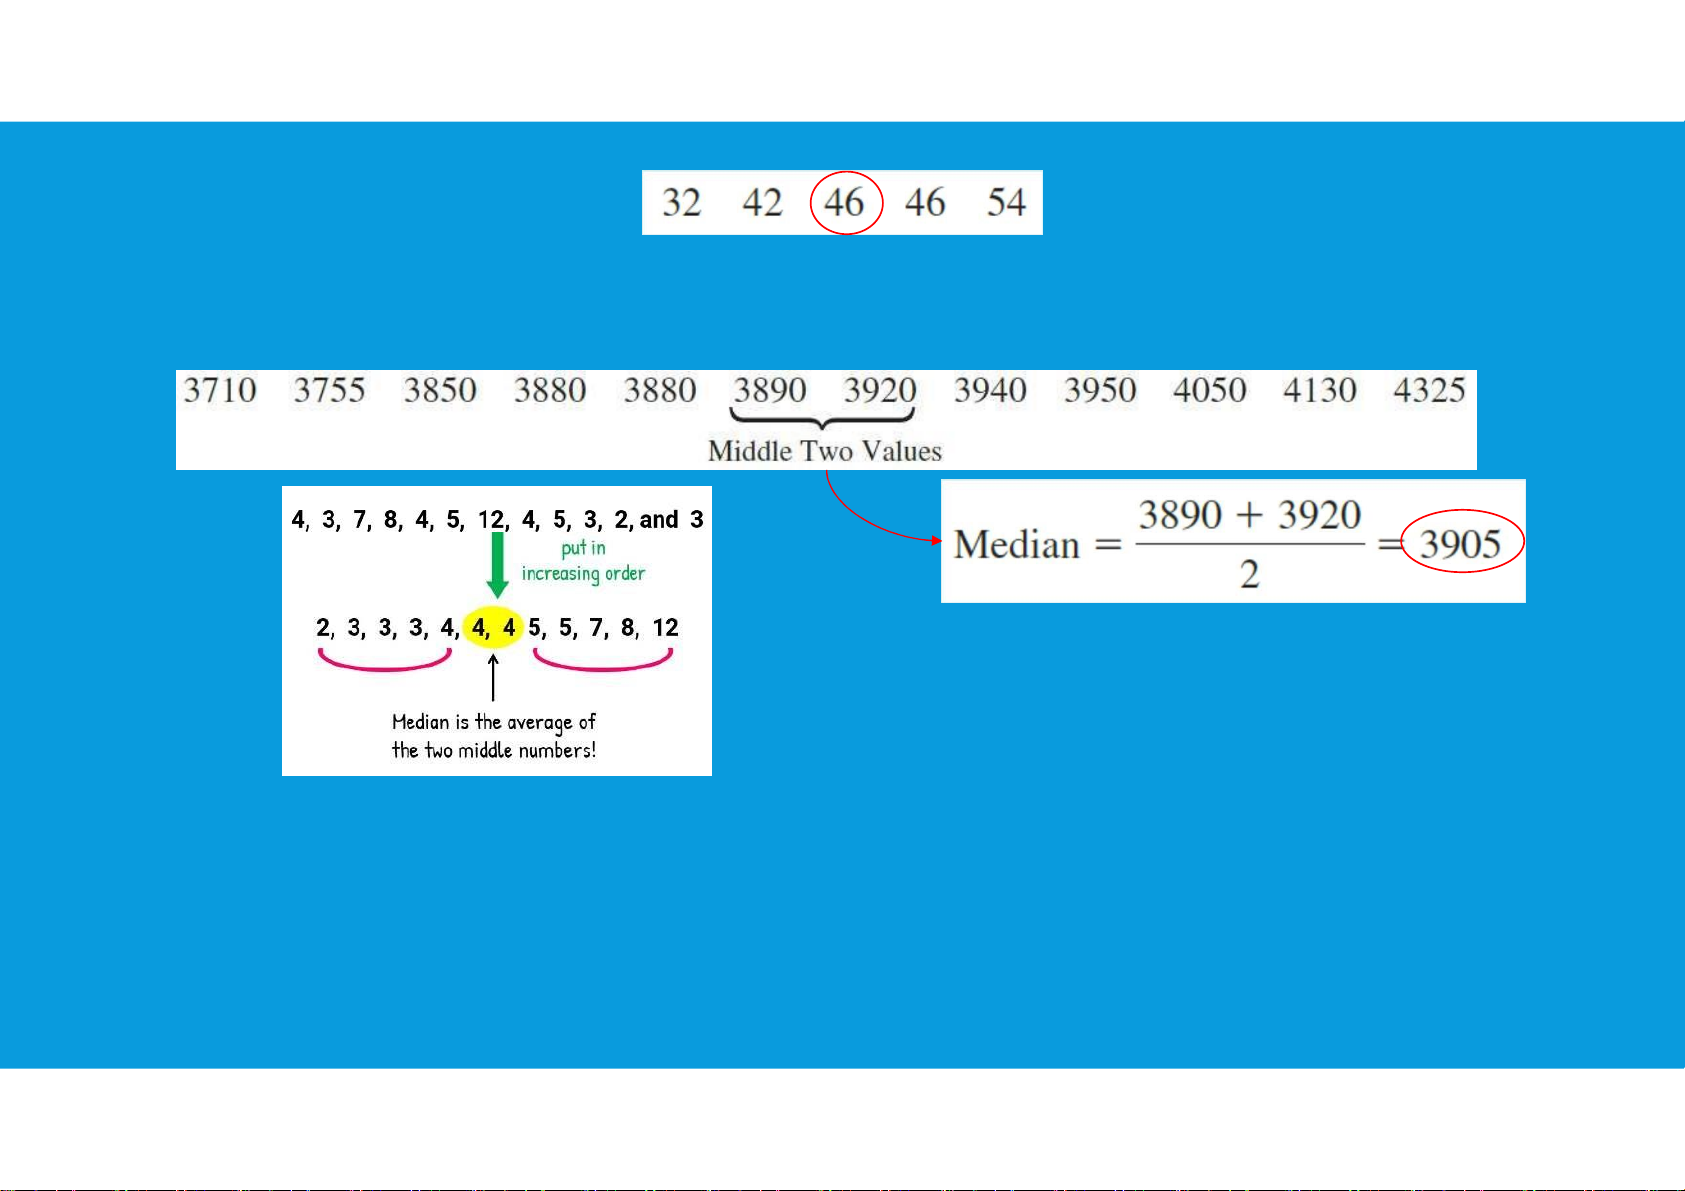
•Median: Arrange the data in ascending order (smallest value to largest value):
(a) For an odd number of observations, the median is the middle value. tttu@hcmiu.edu.vn 9 lOMoARcPSD|359 747 69
(b) For an even number of observations, the median is the average of the two middle values. tttu@hcmiu.edu.vn 10 lOMoARcPSD|359 747 69 3.1. MEASURES OF LOCATION
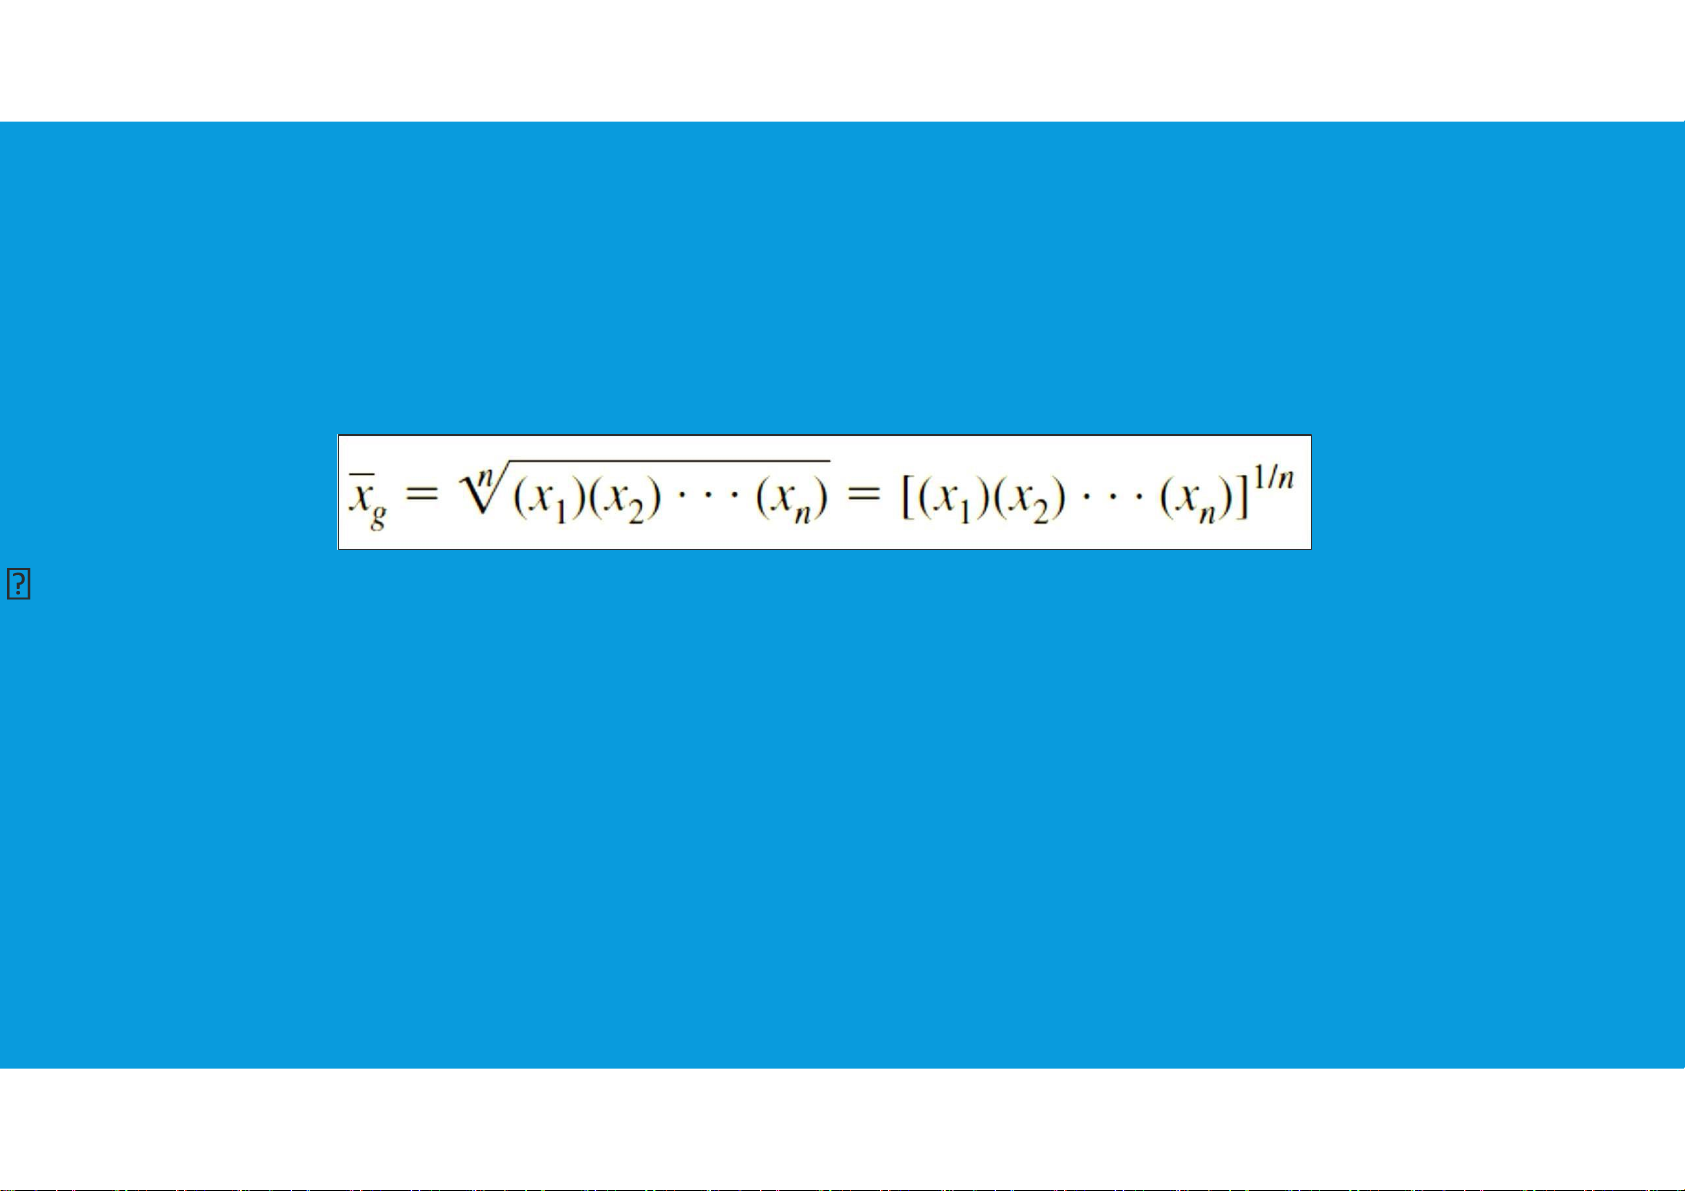
•Geometric Mean: measure of location that is calculated by finding the nth
root of the product of n values
is often used in analyzing growth rates tttu@hcmiu.edu.vn 11 lOMoARcPSD|359 747 69 3.1. MEASURES OF LOCATION •Geometric Mean:
- Other common applications: changes in populations of species, crop yields, pollution levels, and birth and death rates, etc. tttu@hcmiu.edu.vn 12 lOMoARcPSD|359 747 69
- Also note that the geometric mean can be applied to changes that occur over any number of
successive periods of any length.
- In addition to annual changes, the geometric mean is often
applied to find the mean rate of change over quarters, months, weeks, and even days. 3.1. MEASURES OF LOCATION tttu@hcmiu.edu.vn 13 lOMoARcPSD|359 747 69
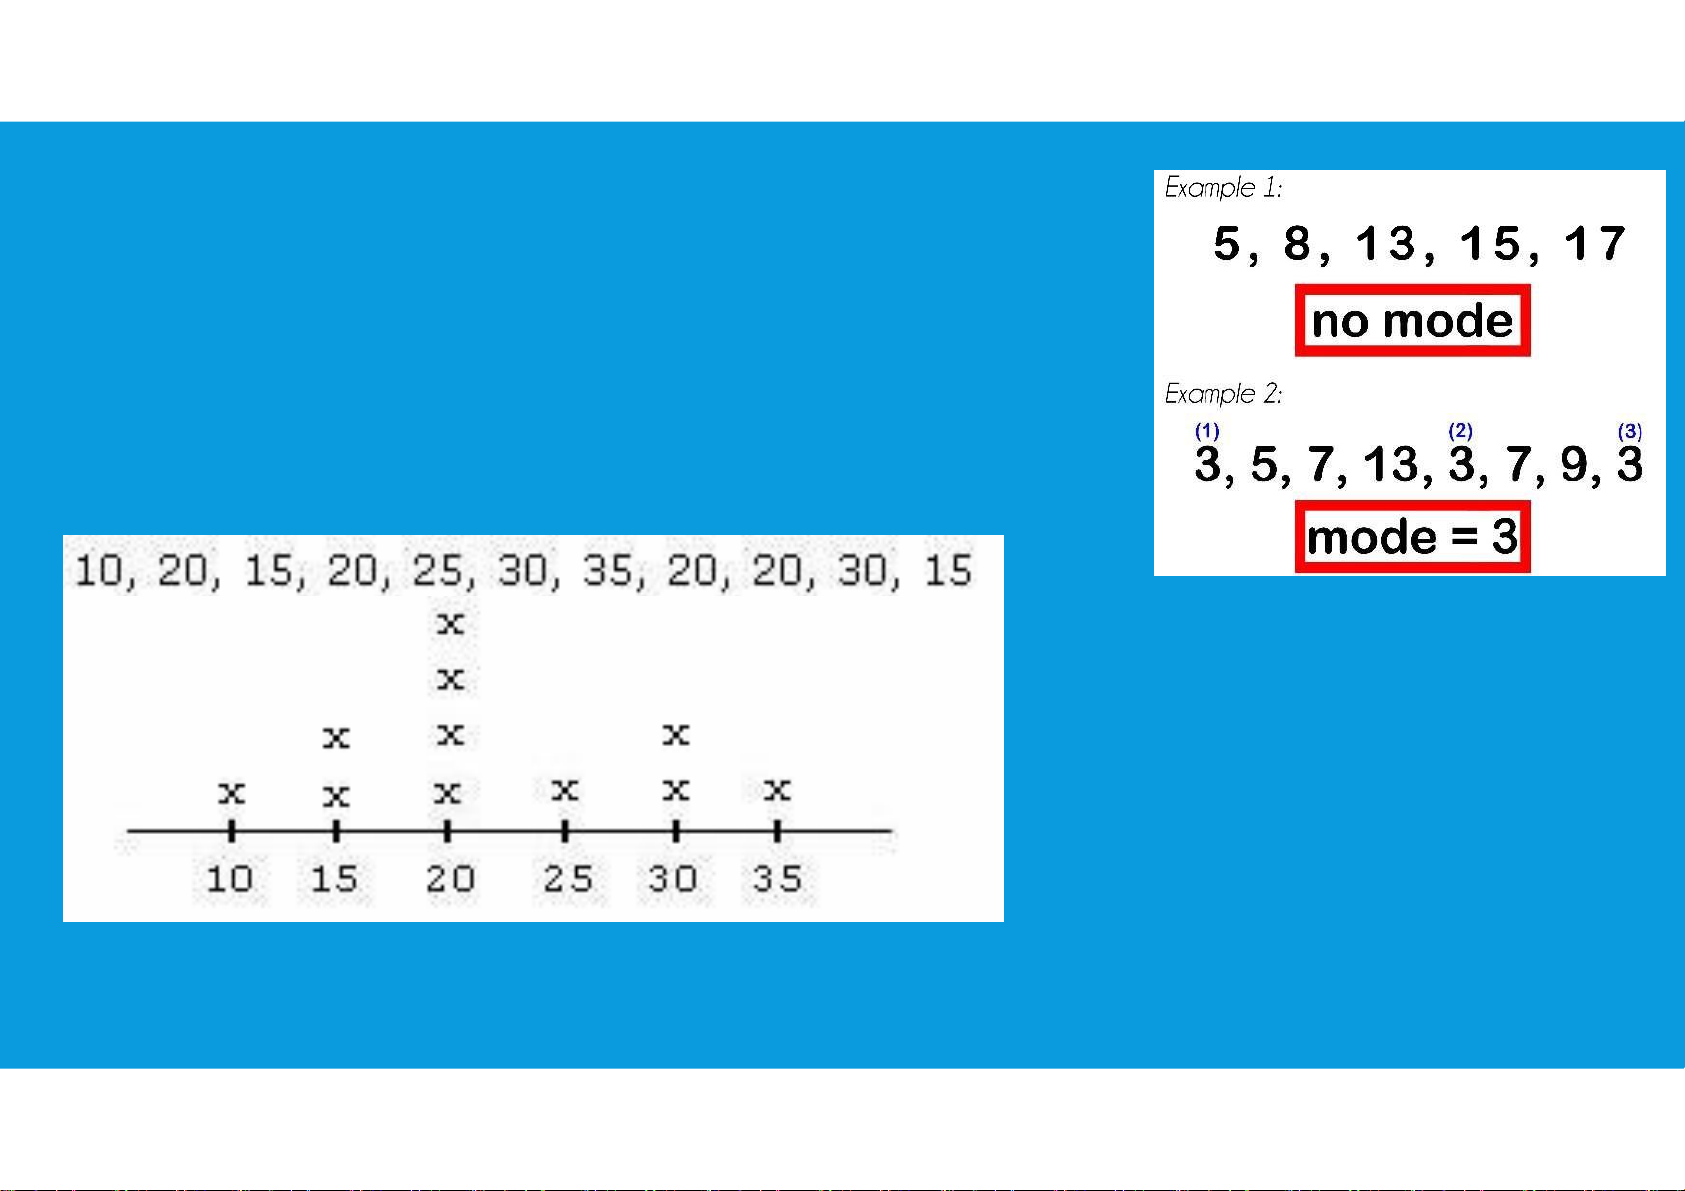
•Mode: value that occurs with greatest frequency Mean=? Median=? Mode=? 3.1. MEASURES OF LOCATION •Percentiles: provides
information about how the data are spread over the interval
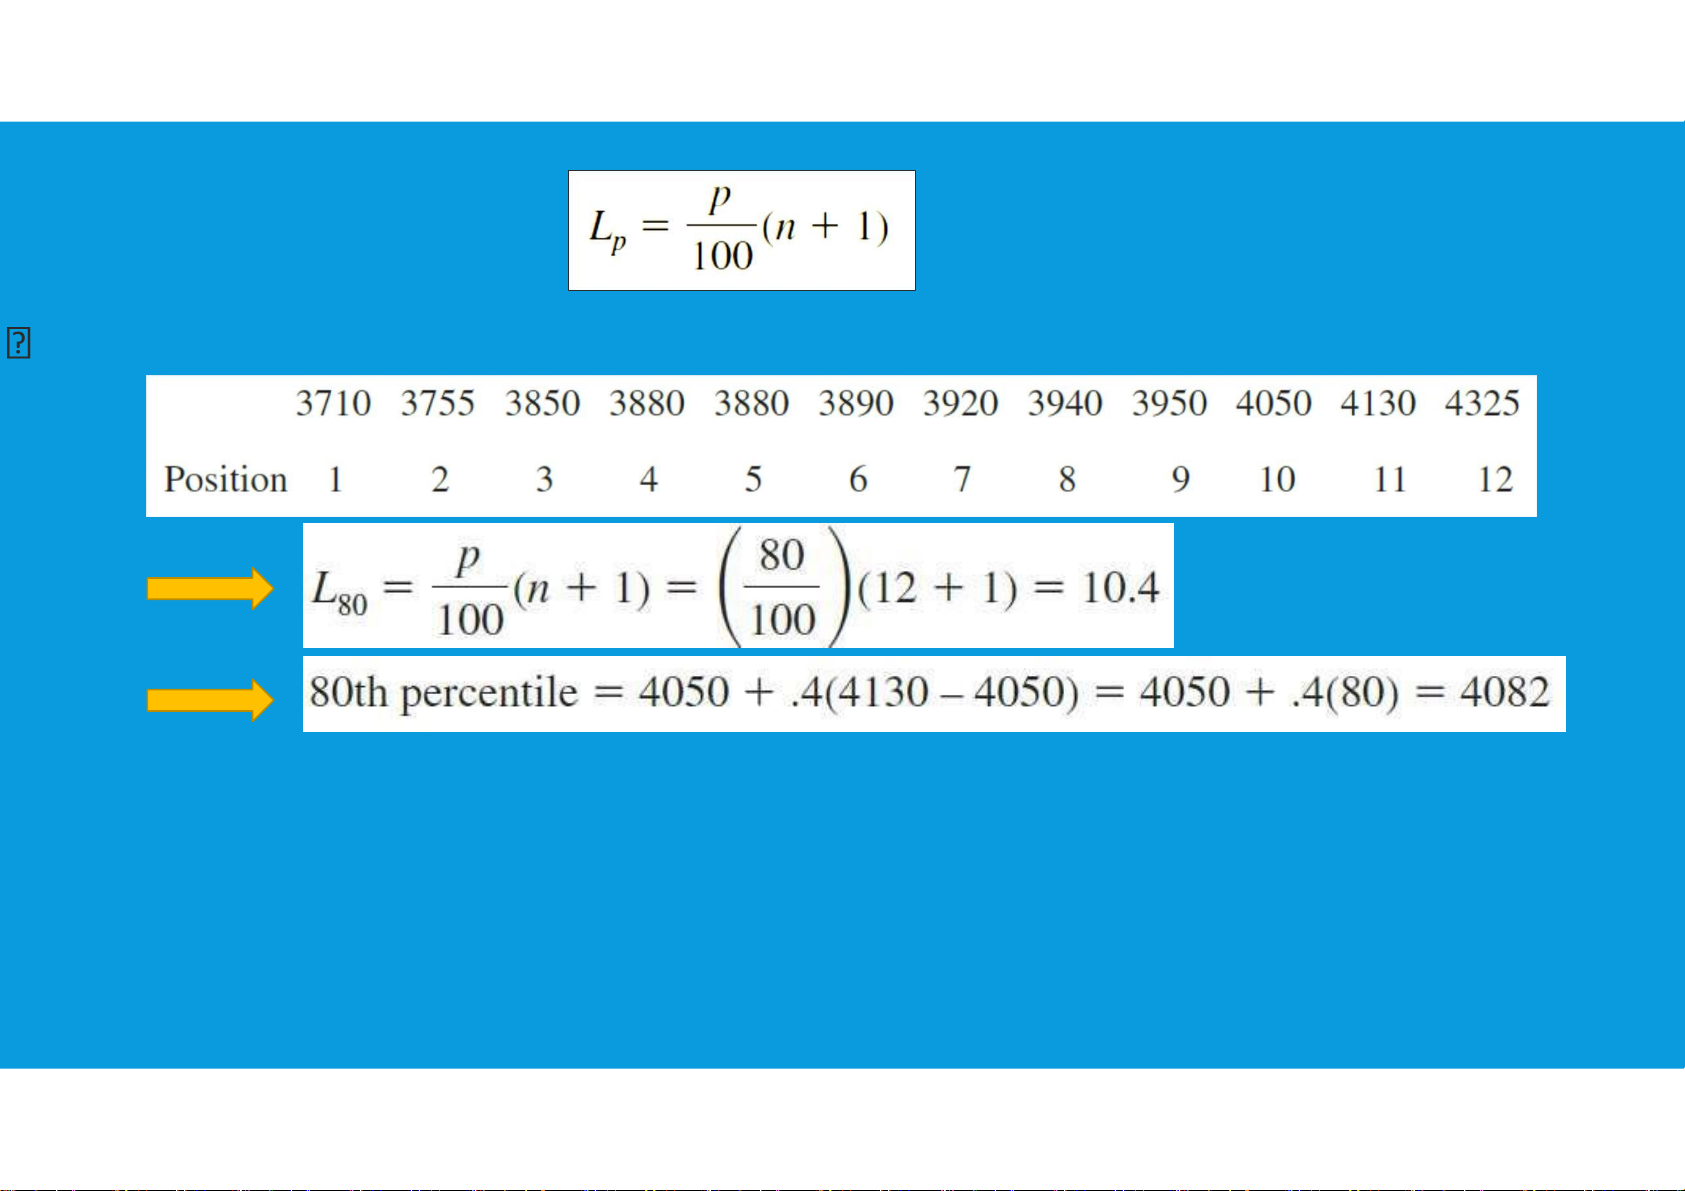
from the smallest value to the largest value. tttu@hcmiu.edu.vn 14 lOMoARcPSD|359 747 69
•Location of pth percentile:
Calculate the value of pth percentile based on Lp 50th percentile=??? tttu@hcmiu.edu.vn 15 lOMoARcPSD|359 747 69 3.1. MEASURES OF LOCATION
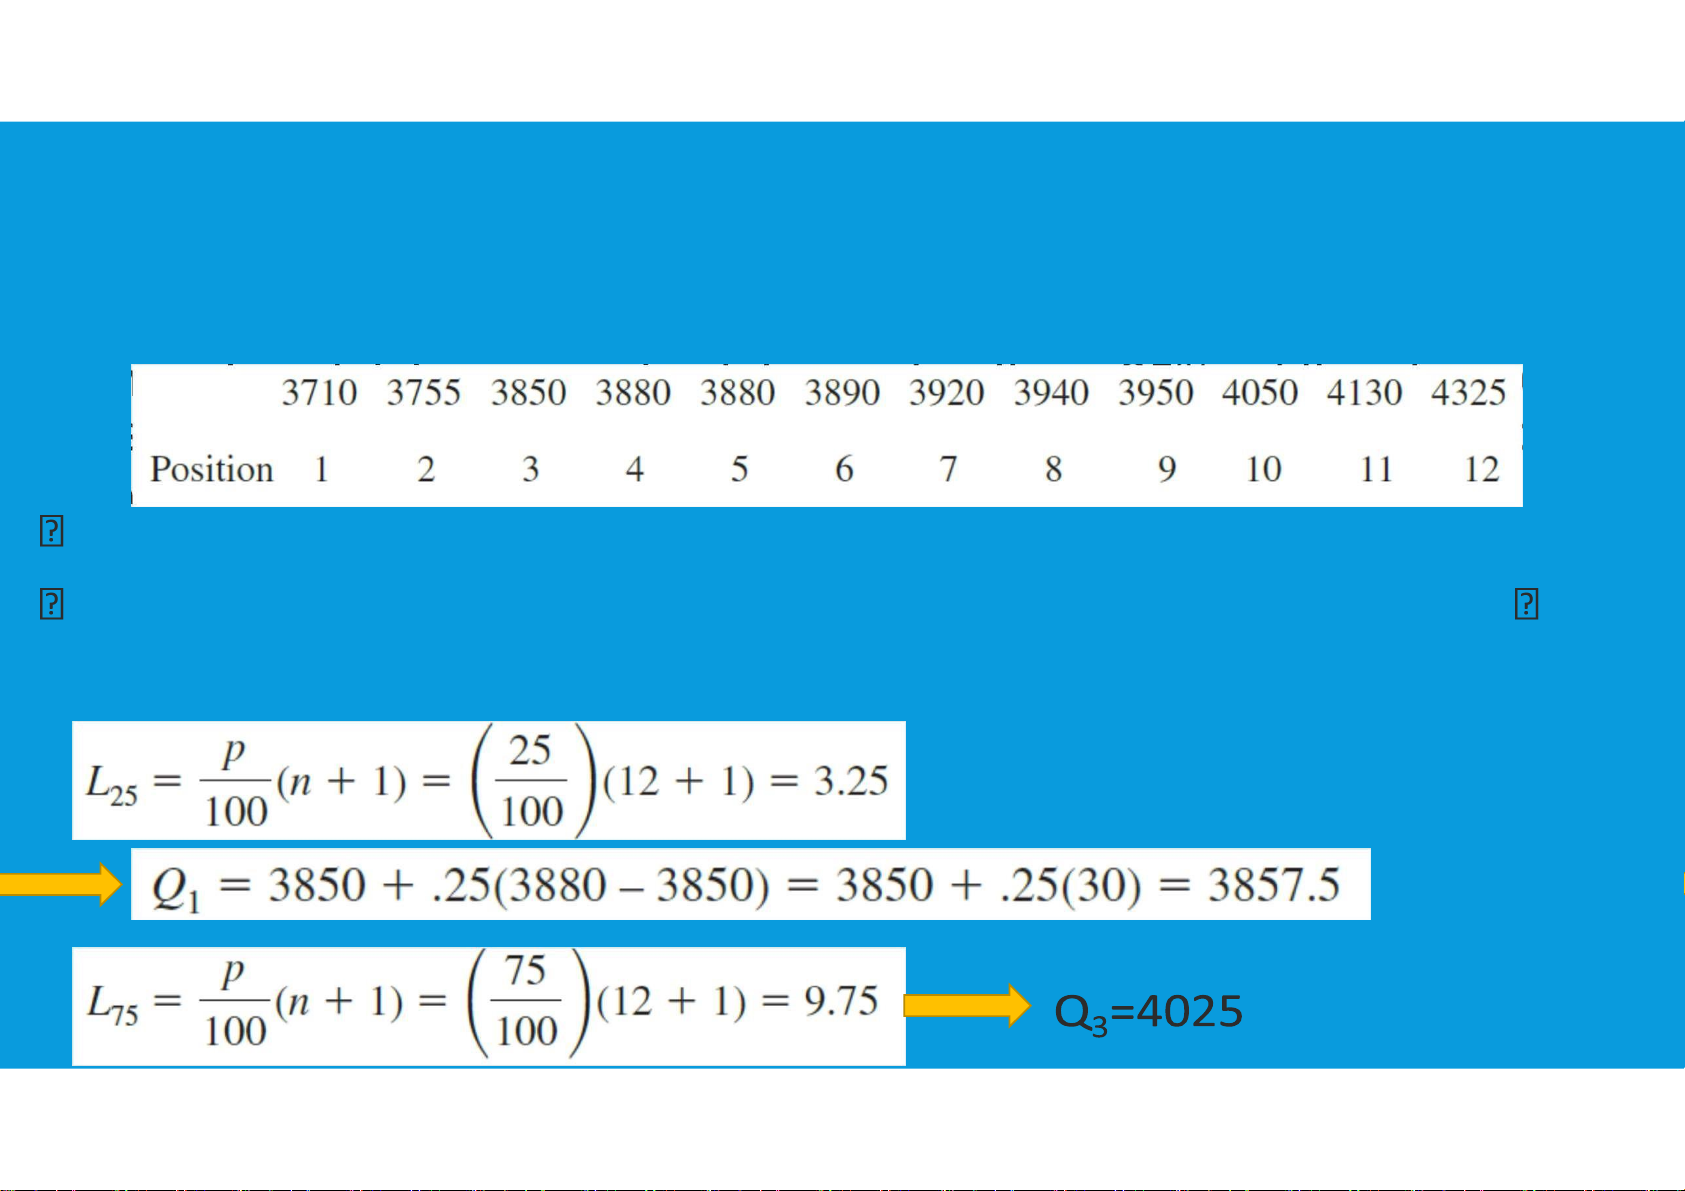
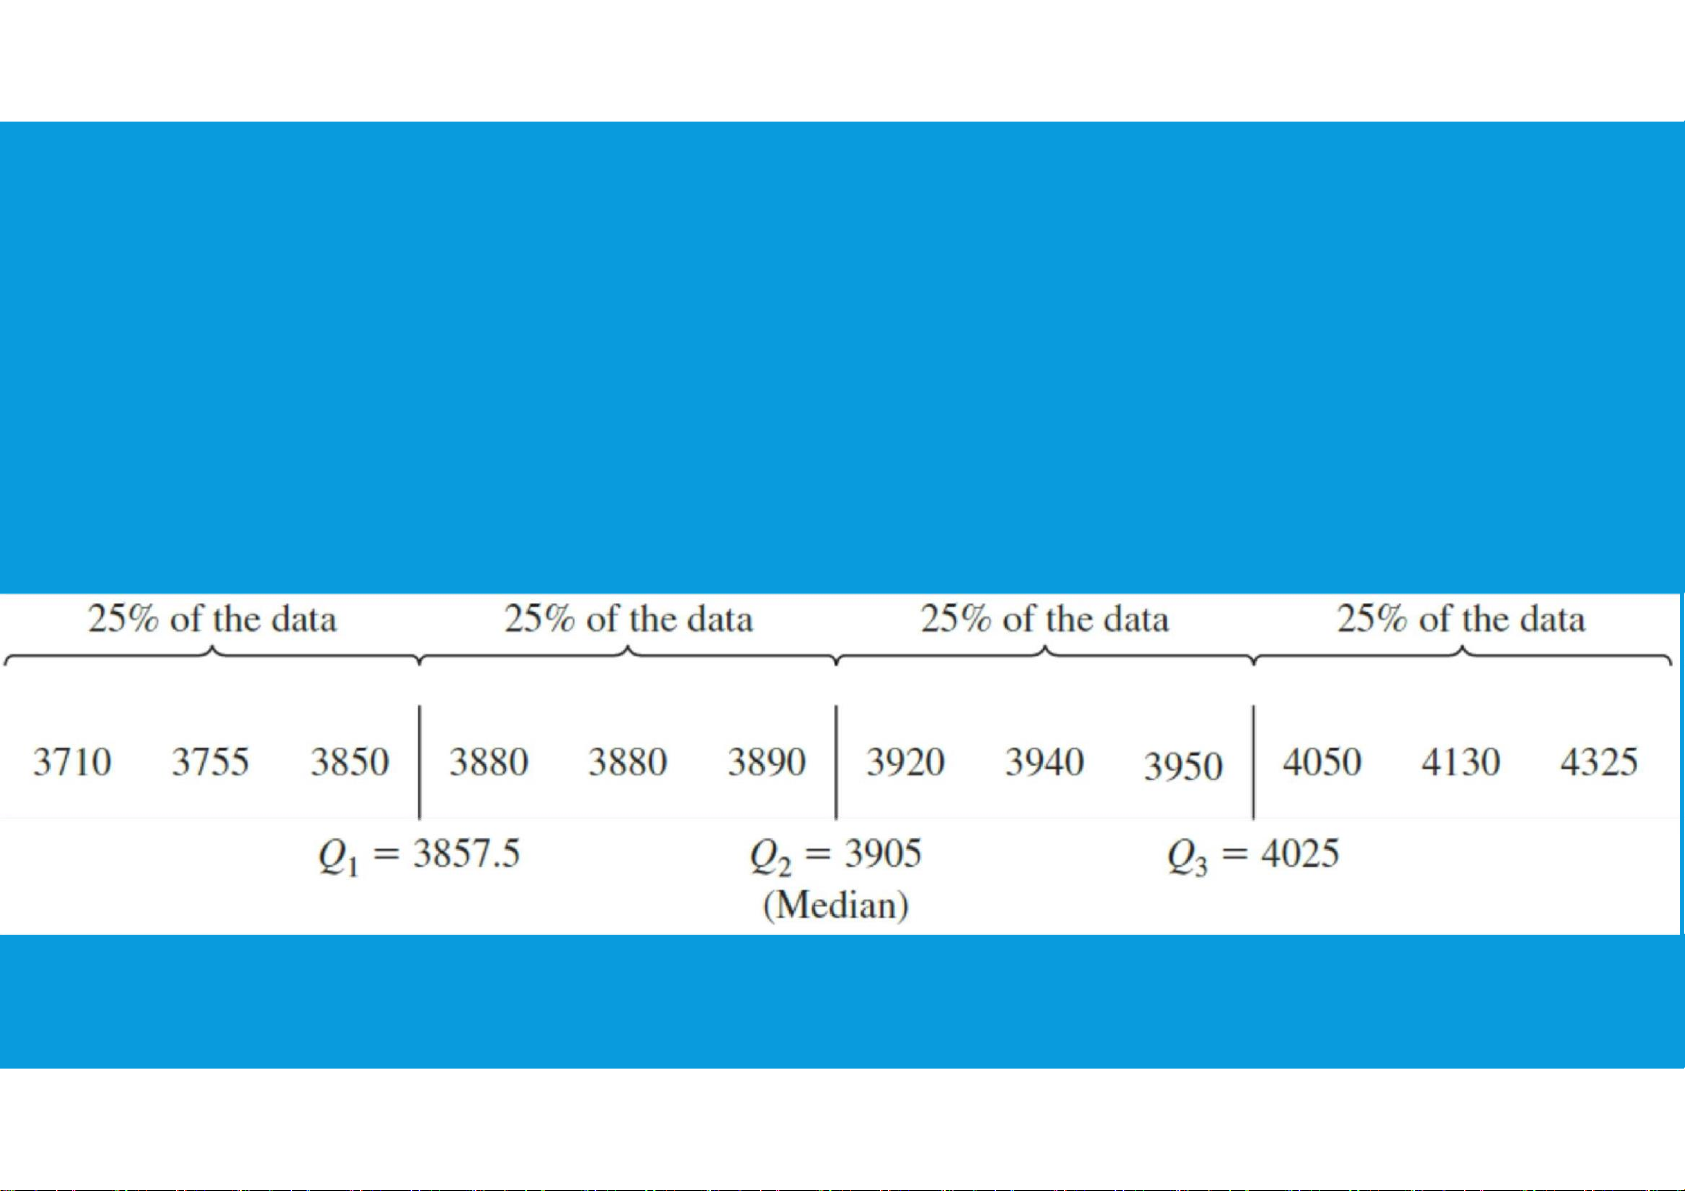
•Quartiles: it is often desirable to divide a data set into four parts, with each
part containing approximately one-fourth, or 25%, of the observations. These
division points are referred to as the quartiles and are defined as follows:
Q1 = first quartile, or 25th percentile (Location: L25)
Q2 = second quartile, or 50th percentile (also the median) (Location: L50) Q3 =
third quartile, or 75th percentile (Location: L75) tttu@hcmiu.edu.vn 16 lOMoARcPSD|359 747 69 3.1. MEASURES OF LOCATION Mean=? 25th percentile=? Median=? 50th percentile=? Mode=? 75th percentile=? tttu@hcmiu.edu.vn 17 lOMoARcPSD|359 747 69 End of file 1. Any questions? tttu@hcmiu.edu.vn 16 3.2. MEASURES OF VARIABILITY
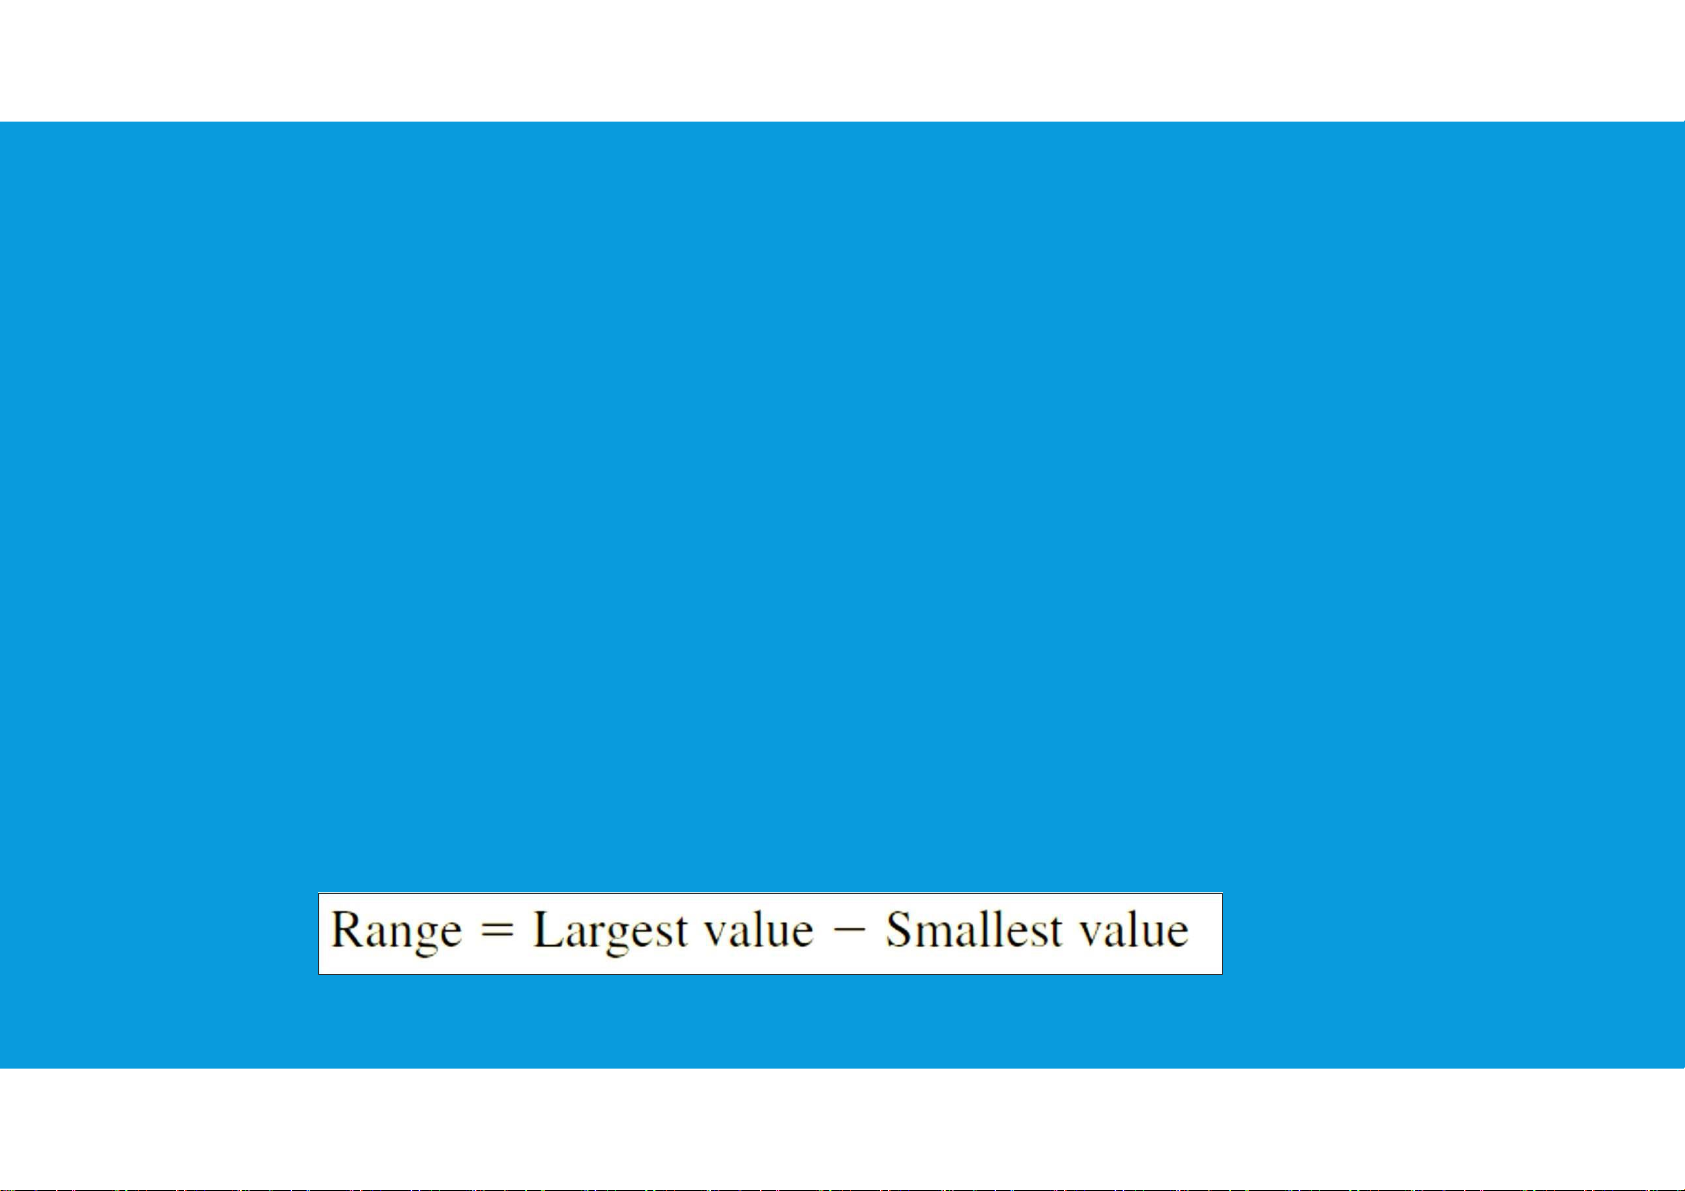
•Range: simplest measure of variability lOMoARcPSD|359 747 69
•It is seldom used as the only measure. The reason is that the range is based
on only two of the observations and thus is highly influenced by extreme values.
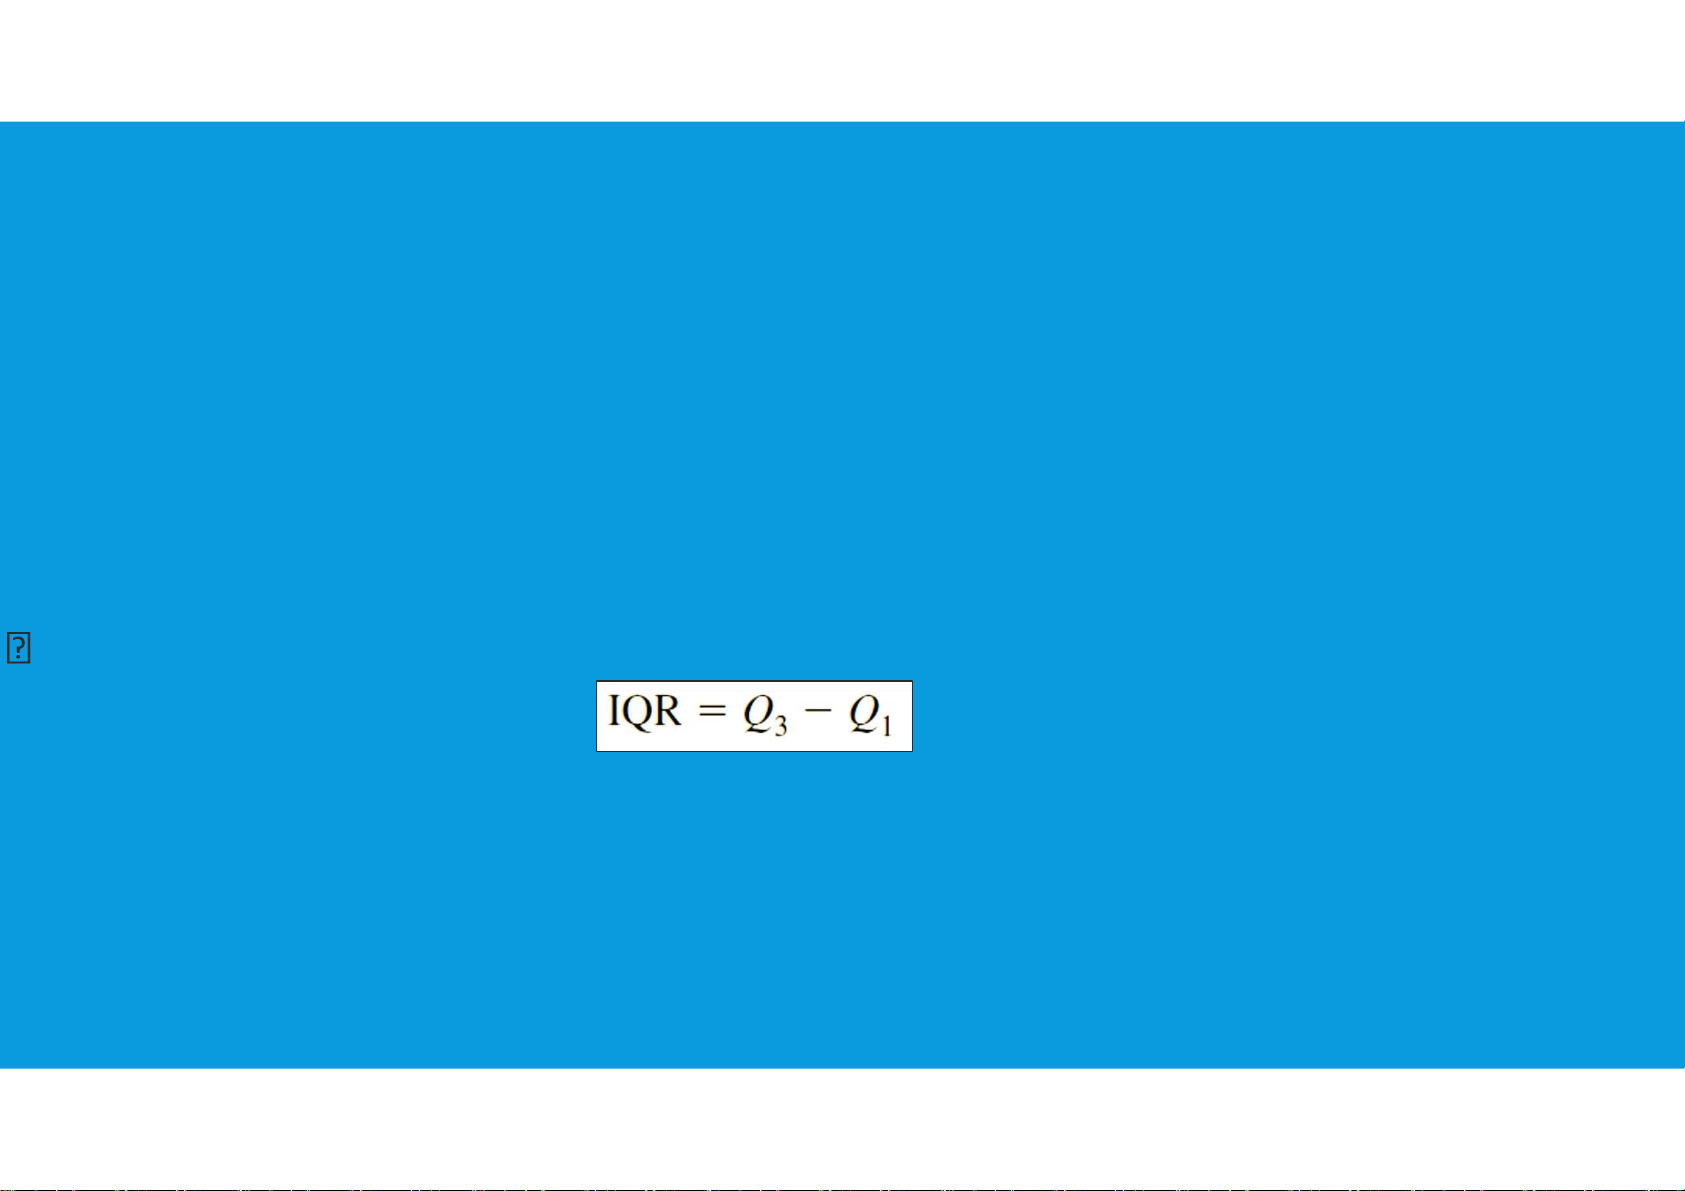
•Interquartile Range: A measure of variability that overcomes the dependency on extreme values.
difference between the third quartile, Q3, and the first quartile, Q1 3.2. MEASURES OF VARIABILITY
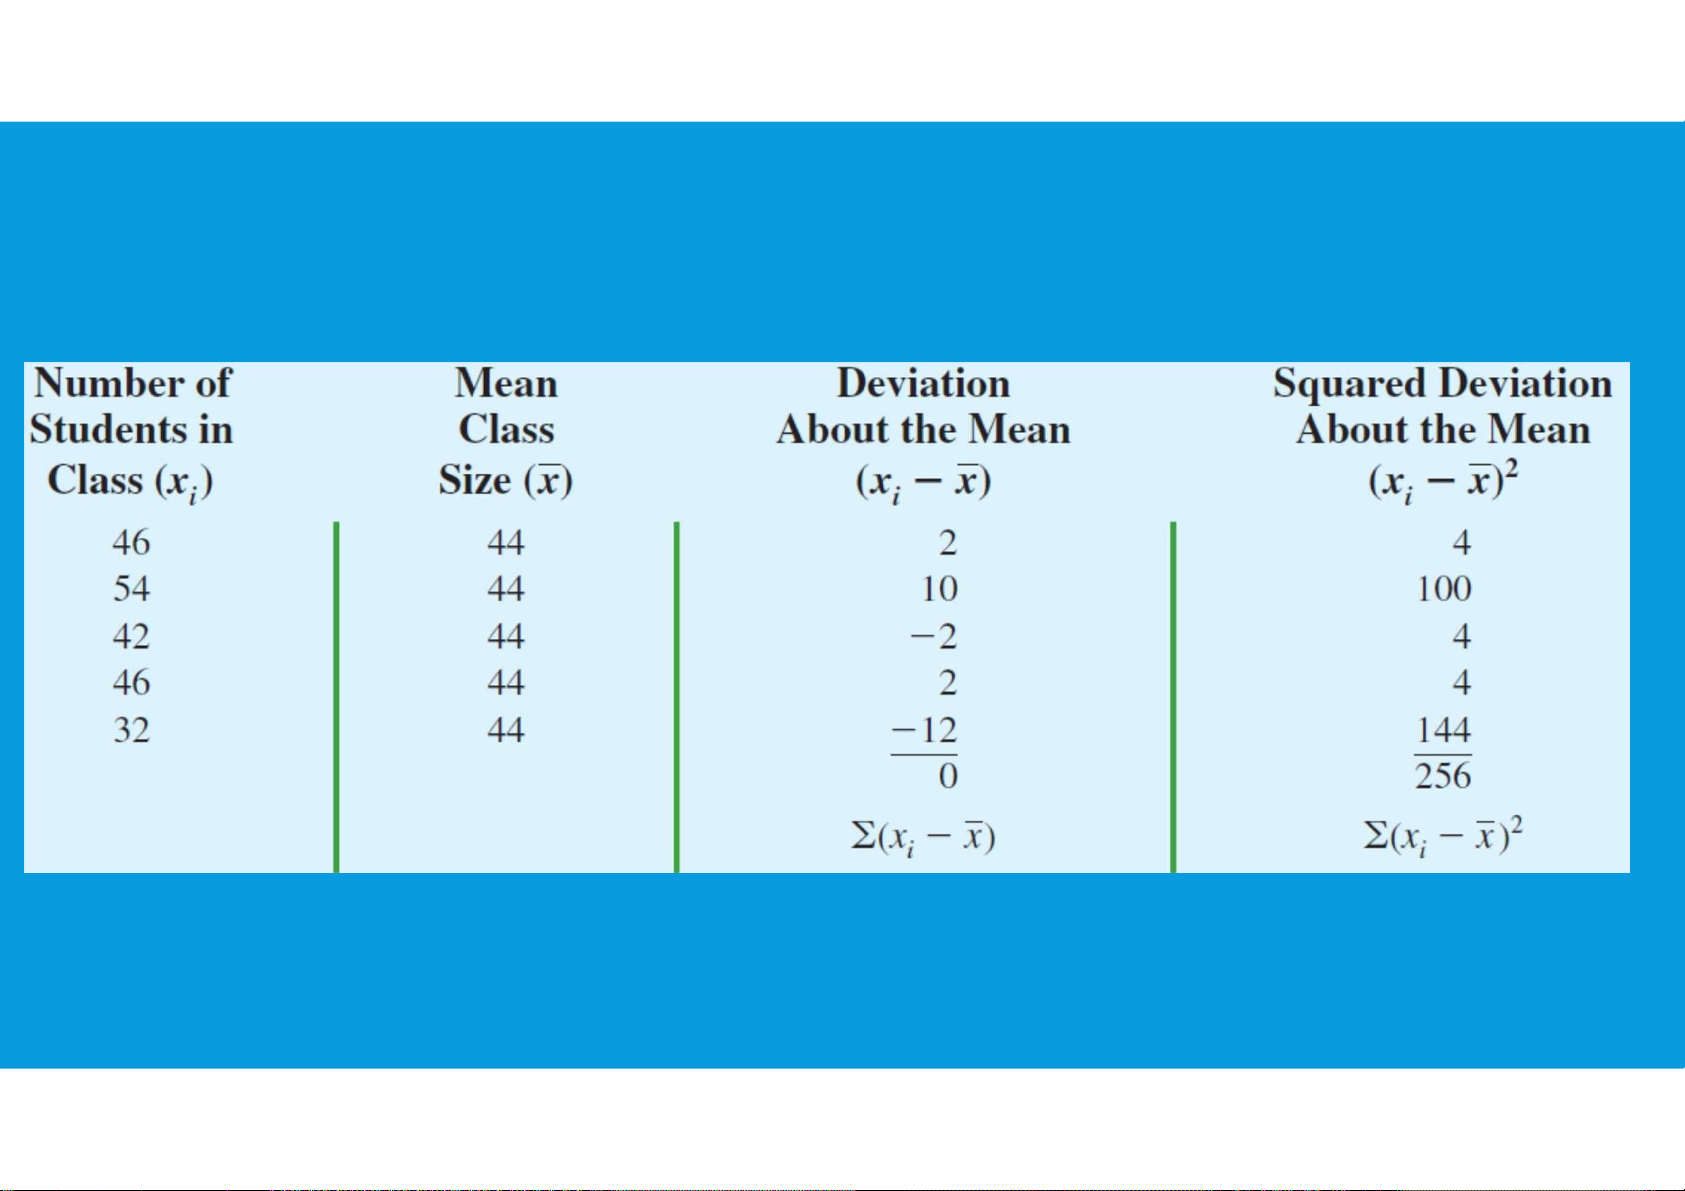
•Variance: A measure of variability that utilizes all the data tttu@hcmiu.edu.vn 19 lOMoARcPSD|359 747 69
based on the difference between the value of each observation (xi) and the
mean (=deviation about the mean):
- For a sample, a deviation about the mean is written ( − ); - For a population, it is written ( •Population variance: •Sample variance:
(if the sum of the squared deviations about the sample mean is divided by n − 1, and
not n, the resulting sample variance provides an unbiased estimate of the population Variance) tttu@hcmiu.edu.vn 20 lOMoARcPSD|359 747 69 3.2. MEASURES OF VARIABILITY •Variance = 256/4= 64
(in a comparison of the variables, the one with the largest variance shows the most variability) tttu@hcmiu.edu.vn 21 lOMoARcPSD|359 747 69 3.2. MEASURES OF VARIABILITY
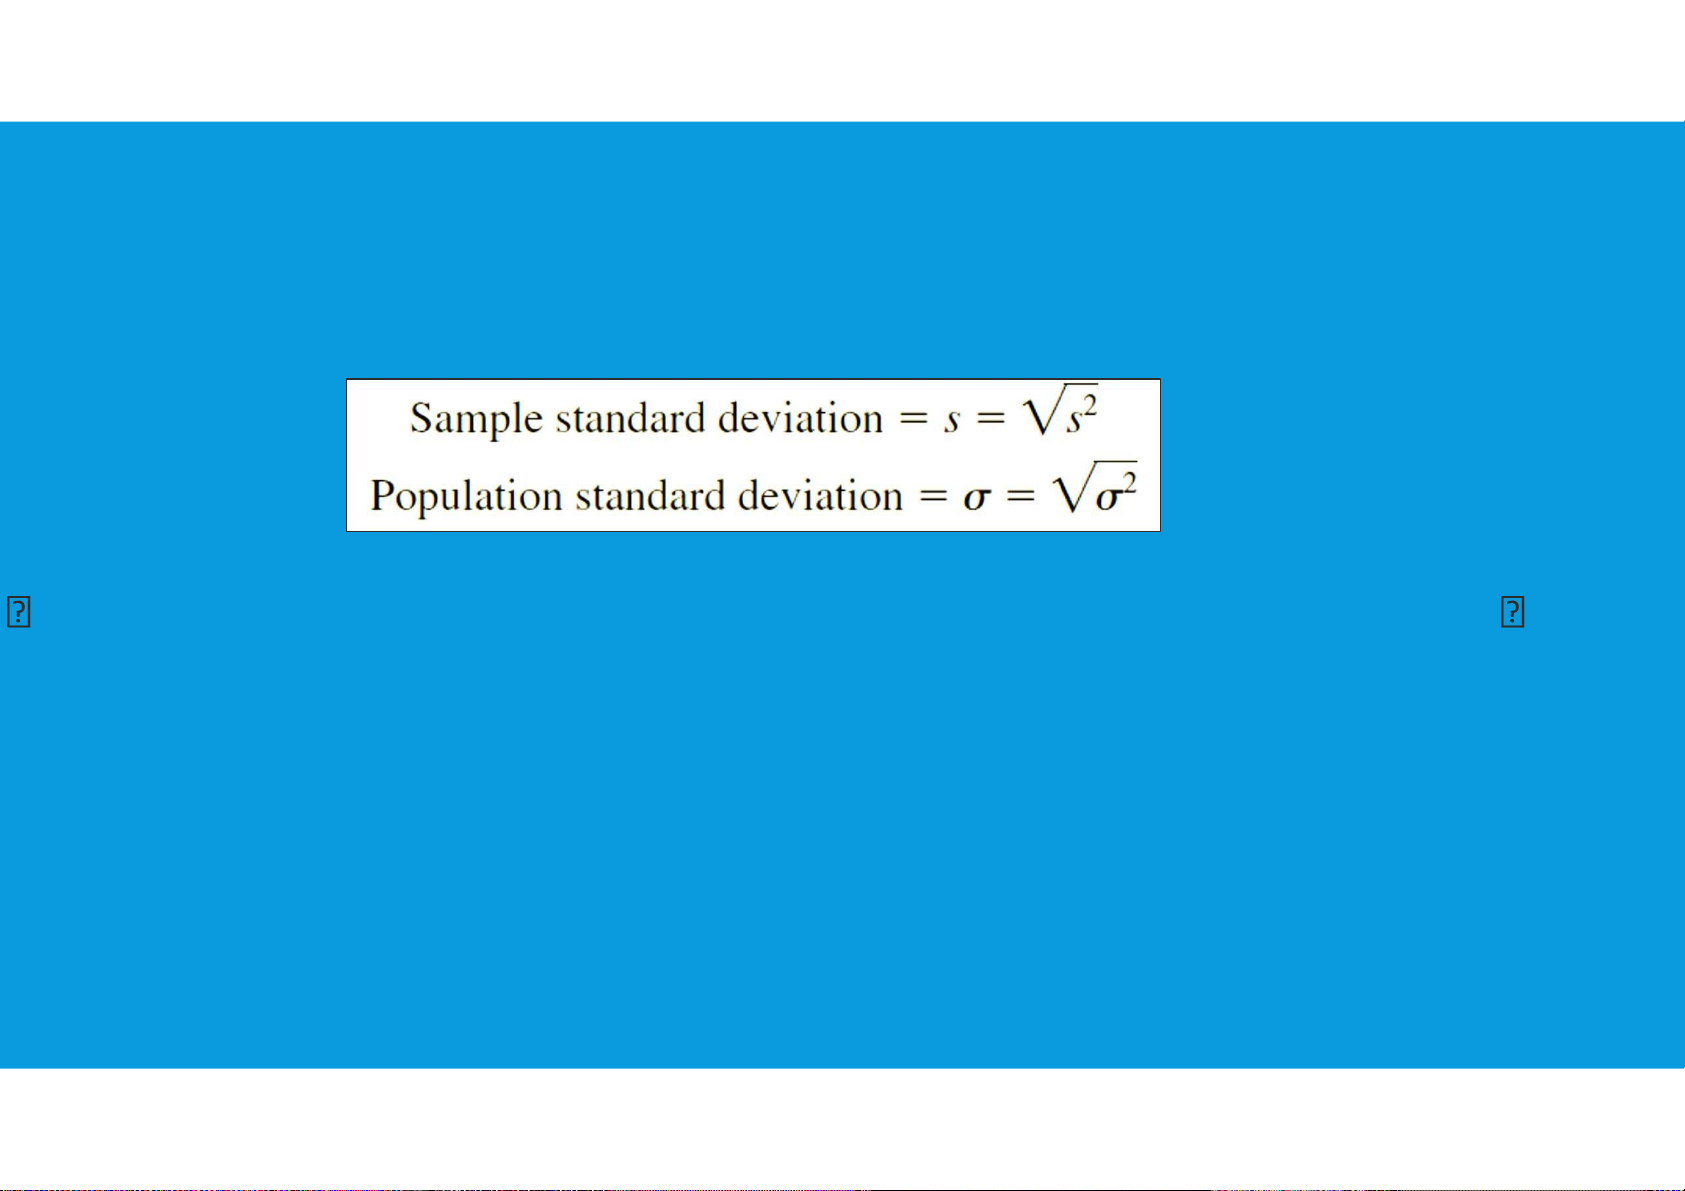
•Standard Deviation: the positive square root of the variance
the standard deviation is measured in the same units as the original data the
standard deviation is more easily compared to the mean and other statistics that
are measured in the same units as the original data. tttu@hcmiu.edu.vn 22 lOMoARcPSD|359 747 69 3.2. MEASURES OF VARIABILITY
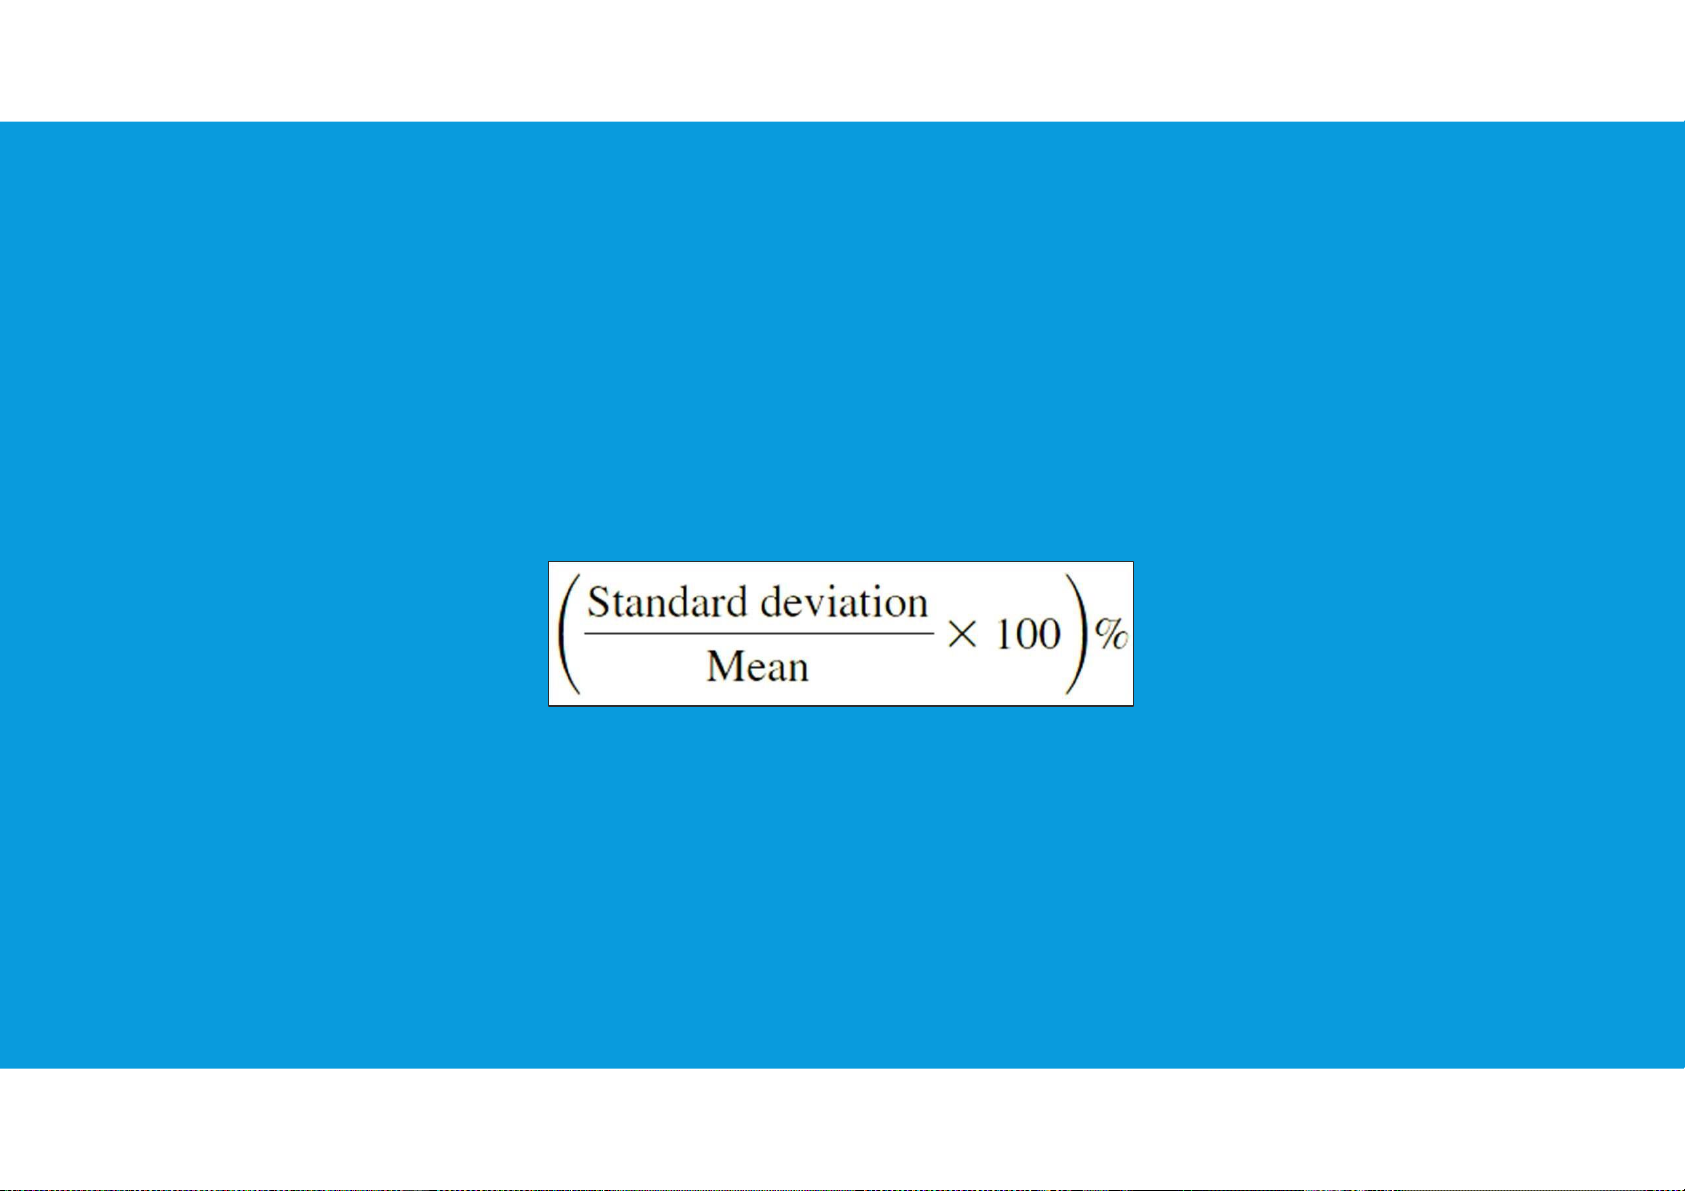
•Coefficient of Variation: in some situations we may be interested in a
descriptive statistic that indicates how large the standard deviation is relative to
the mean. This measure is called the coefficient of variation and is usually expressed as a percentage.
•In general, the coefficient of variation is a useful statistic for comparing the
variability of variables that have different standard deviations and different means. tttu@hcmiu.edu.vn 23 lOMoARcPSD|359 747 69 End of file 2. Any questions? tttu@hcmiu.edu.vn 22
Document Outline
- APPLIED STATISTICS
- Chapter 3: Descriptive statistics
- REVIEW PREVIOUS LECTURES
- 3.1. MEASURES OF LOCATION
- 3.1. MEASURES OF LOCATION (1)
- 3.1. MEASURES OF LOCATION (2)
- 3.1. MEASURES OF LOCATION (3)
- 3.1. MEASURES OF LOCATION (4)
- 3.1. MEASURES OF LOCATION (5)
- 3.2. MEASURES OF VARIABILITY
- 3.2. MEASURES OF VARIABILITY (1)
- 3.2. MEASURES OF VARIABILITY (2)
- 3.2. MEASURES OF VARIABILITY (3)
- 3.2. MEASURES OF VARIABILITY (4)
- REVIEW PREVIOUS LECTURES
- Chapter 3: Descriptive statistics
Tài liệu liên quan:
-
Data and Statistics | Bài giảng số 1 chương 1 học phần Applied statistics | Trường Đại học Quốc tế, Đại học Quốc gia Thành phố Hồ Chí Minh
266 133 -

Data and Statistics | Bài giảng số 2 chương 1 học phần Applied statistics | Trường Đại học Quốc tế, Đại học Quốc gia Thành phố Hồ Chí Minh
360 180 -

Plotting and Smoothing data | Bài giảng số 3 chương 2 học phần Applied statistics | Trường Đại học Quốc tế, Đại học Quốc gia Thành phố Hồ Chí Minh
203 102 -

Descriptive statistics | Bài giảng số 4 chương 3 học phần Applied statistics | Trường Đại học Quốc tế, Đại học Quốc gia Thành phố Hồ Chí Minh
207 104 -

Descriptive statistics | Bài giảng số 5 chương 3 học phần Applied statistics | Trường Đại học Quốc tế, Đại học Quốc gia Thành phố Hồ Chí Minh
241 121