Lecture 7 - ENEE1006IU
Tài liệu học tập môn Applied statistics (ENEE1006IU) tại Trường Đại học Quốc tế, Đại học Quốc gia Thành phố Hồ Chí Minh. Tài liệu gồm 32 trang giúp bạn ôn tập hiệu quả và đạt điểm cao! Mời bạn đọc đón xem!
Môn: Applied statistics (ENEE1006IU) 47 tài liệu
Trường: Trường Đại học Quốc tế, Đại học Quốc gia Thành phố Hồ Chí Minh 1.9 K tài liệu
Tác giả:


Preview text:
lOMoARcPSD|364 906 32 APPLIED STATISTICS COURSE CODE: ENEE1006IU Lecture 7:
Chapter 4: Probability and Distribution
(3 credits: 2 is for lecture, 1 is for lab-work)
Instructor: TRAN THANH TU Email: tttu@hcmiu.edu.vn tttu@hcmiu.edu.vn 1 lOMoARcPSD|364 906 32
4.3. CONTINUOUS PROBABILITY DISTRIBUTIONS
•A fundamental difference separates discrete and continuous random variables in
terms of how probabilities are computed.
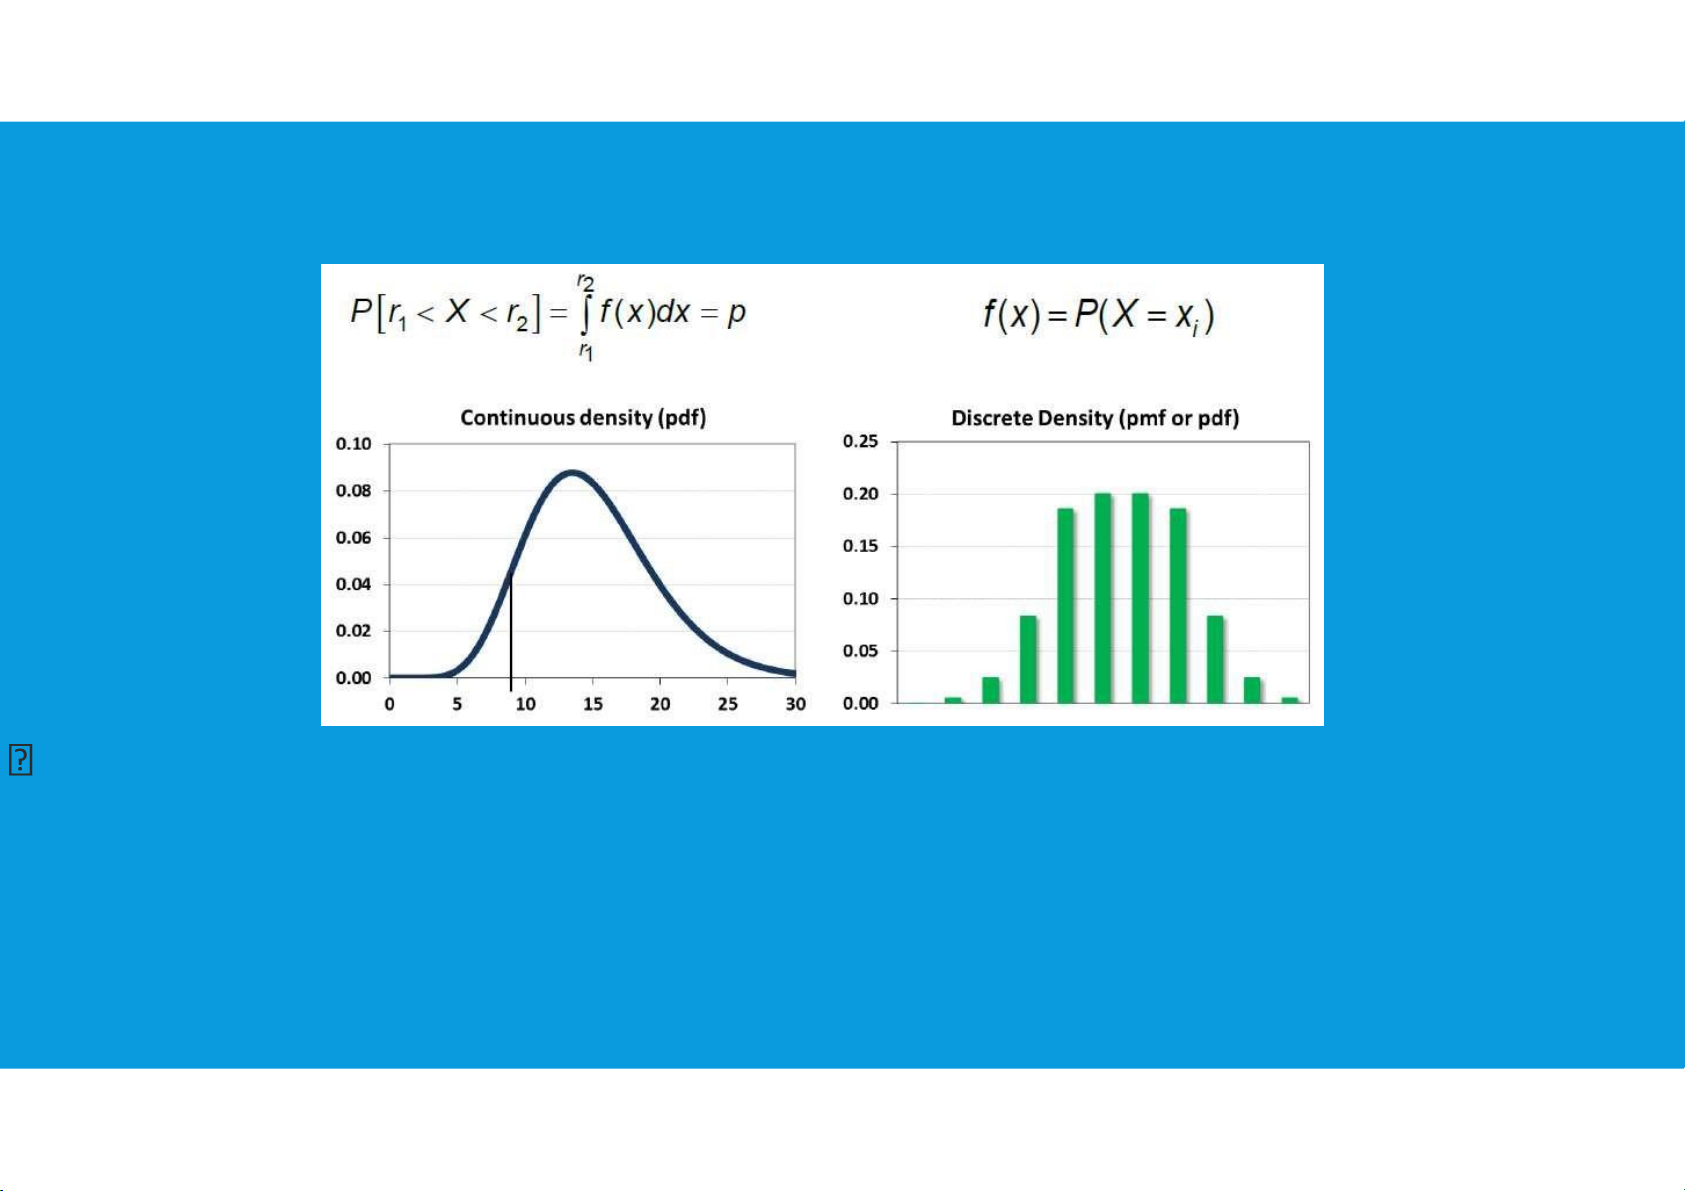
-For a discrete random variable, the probability function f (x) provides the
probability that the random variable assumes a particular value.
-With continuous random variables, the counterpart of the probability function is
the probability density function, also denoted by f (x).
The difference is that the probability density function does not directly provide probabilities. tttu@hcmiu.edu.vn 2 lOMoARcPSD|364 906 32
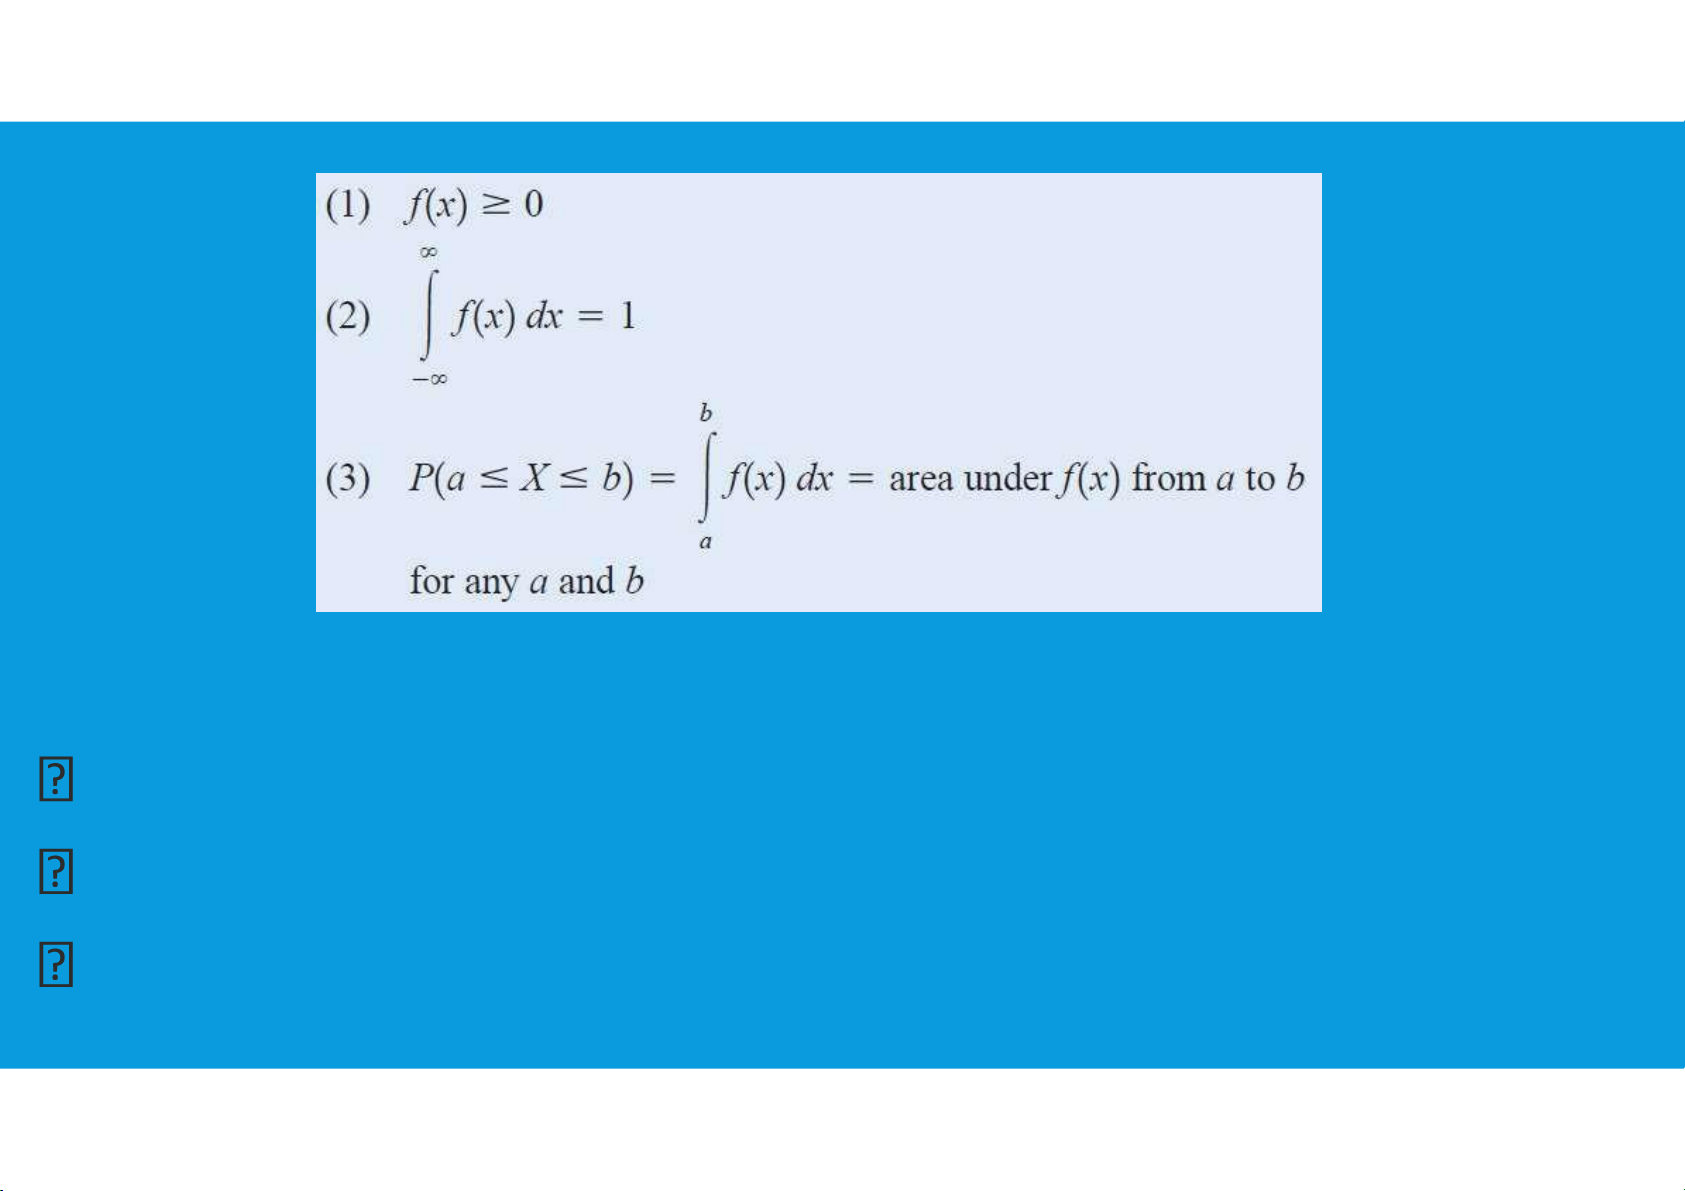
The area under the graph of f (x) corresponding to a given interval does provide
the probability that the continuous random variable x assumes a value in that interval.
4.3. CONTINUOUS PROBABILITY DISTRIBUTIONS
•Continuous probability distribution: A probability distribution in which
the random variable x can take on any value (is continuous).
•Because there are infinite values that x could assume, the
probability of x taking on any one specific value is zero. tttu@hcmiu.edu.vn 3 lOMoARcPSD|364 906 32
4.3. CONTINUOUS PROBABILITY DISTRIBUTIONS
Uniform probability distribution
Normal probability distribution
Normal approximation of binomial probabilities tttu@hcmiu.edu.vn 4 lOMoARcPSD|364 906 32
Exponential probability distribution
4.3. CONTINUOUS PROBABILITY DISTRIBUTIONS tttu@hcmiu.edu.vn 5 lOMoARcPSD|364 906 32 tttu@hcmiu.edu.vn 6 lOMoARcPSD|364 906 32
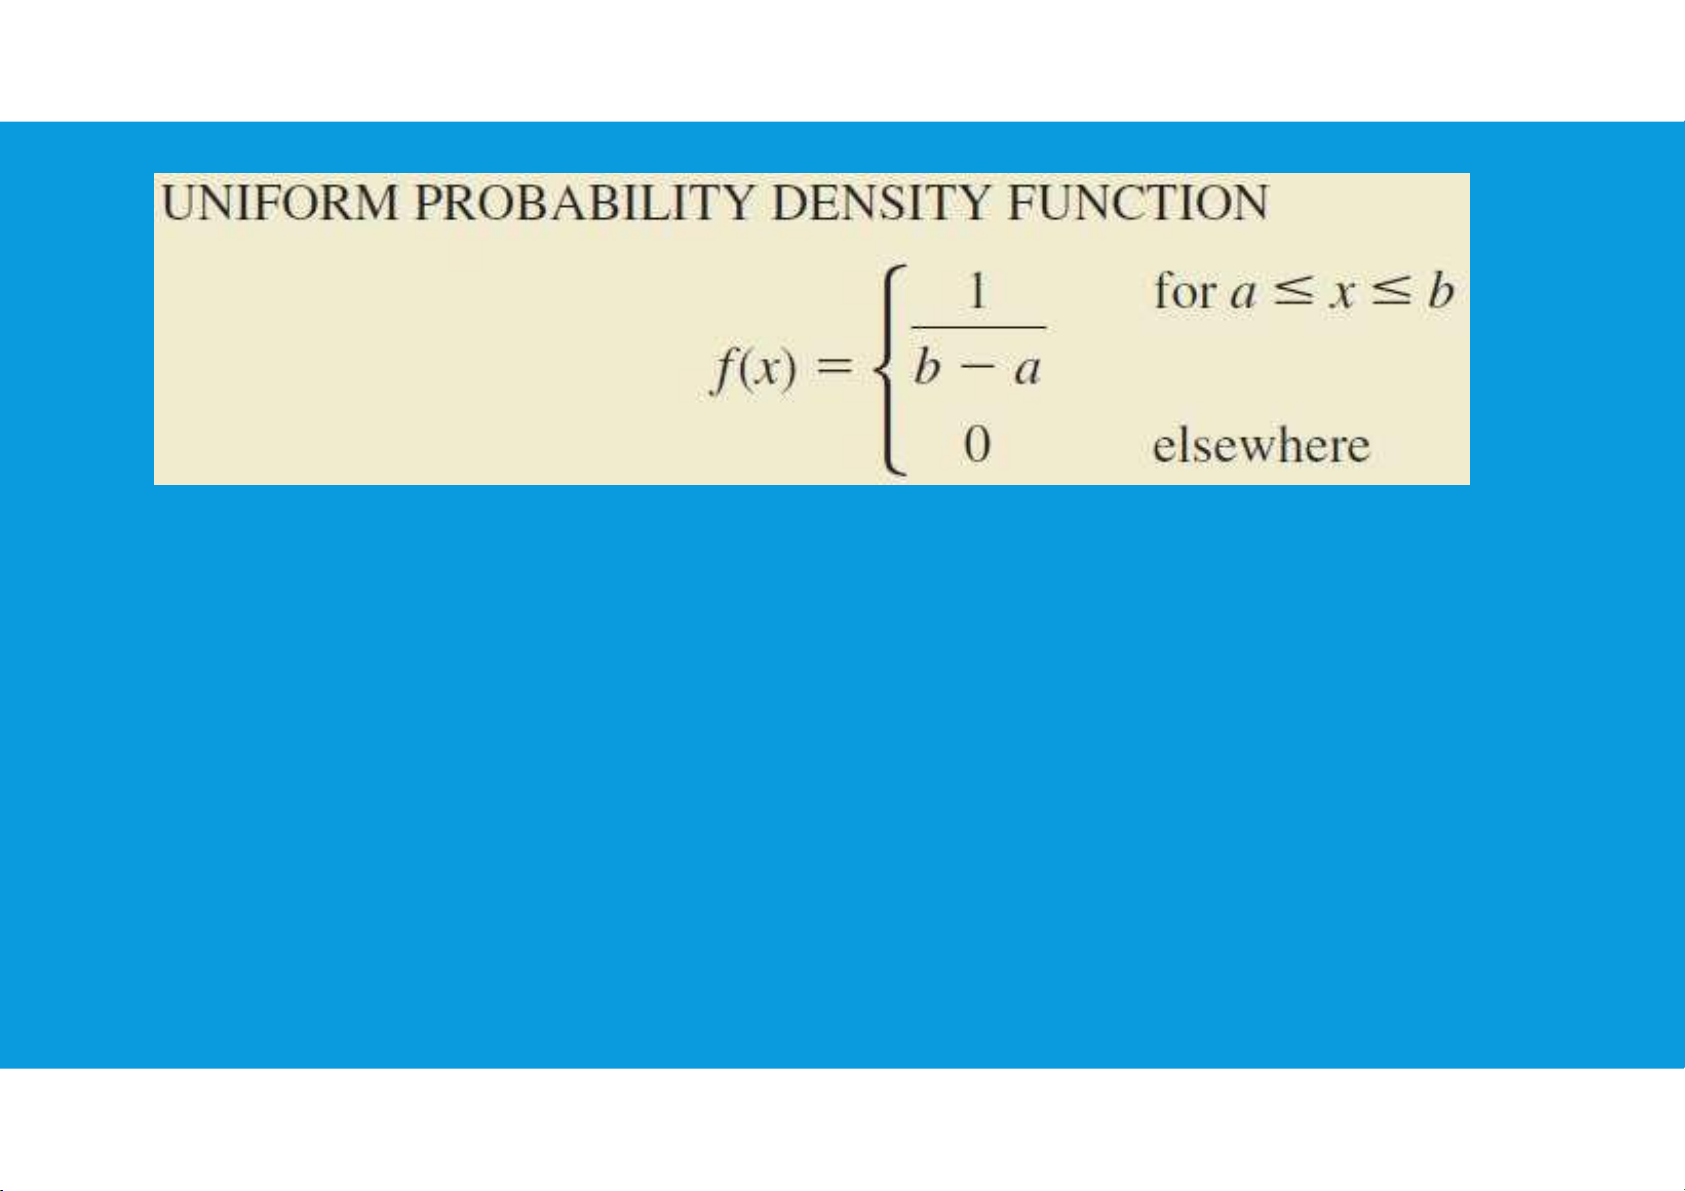
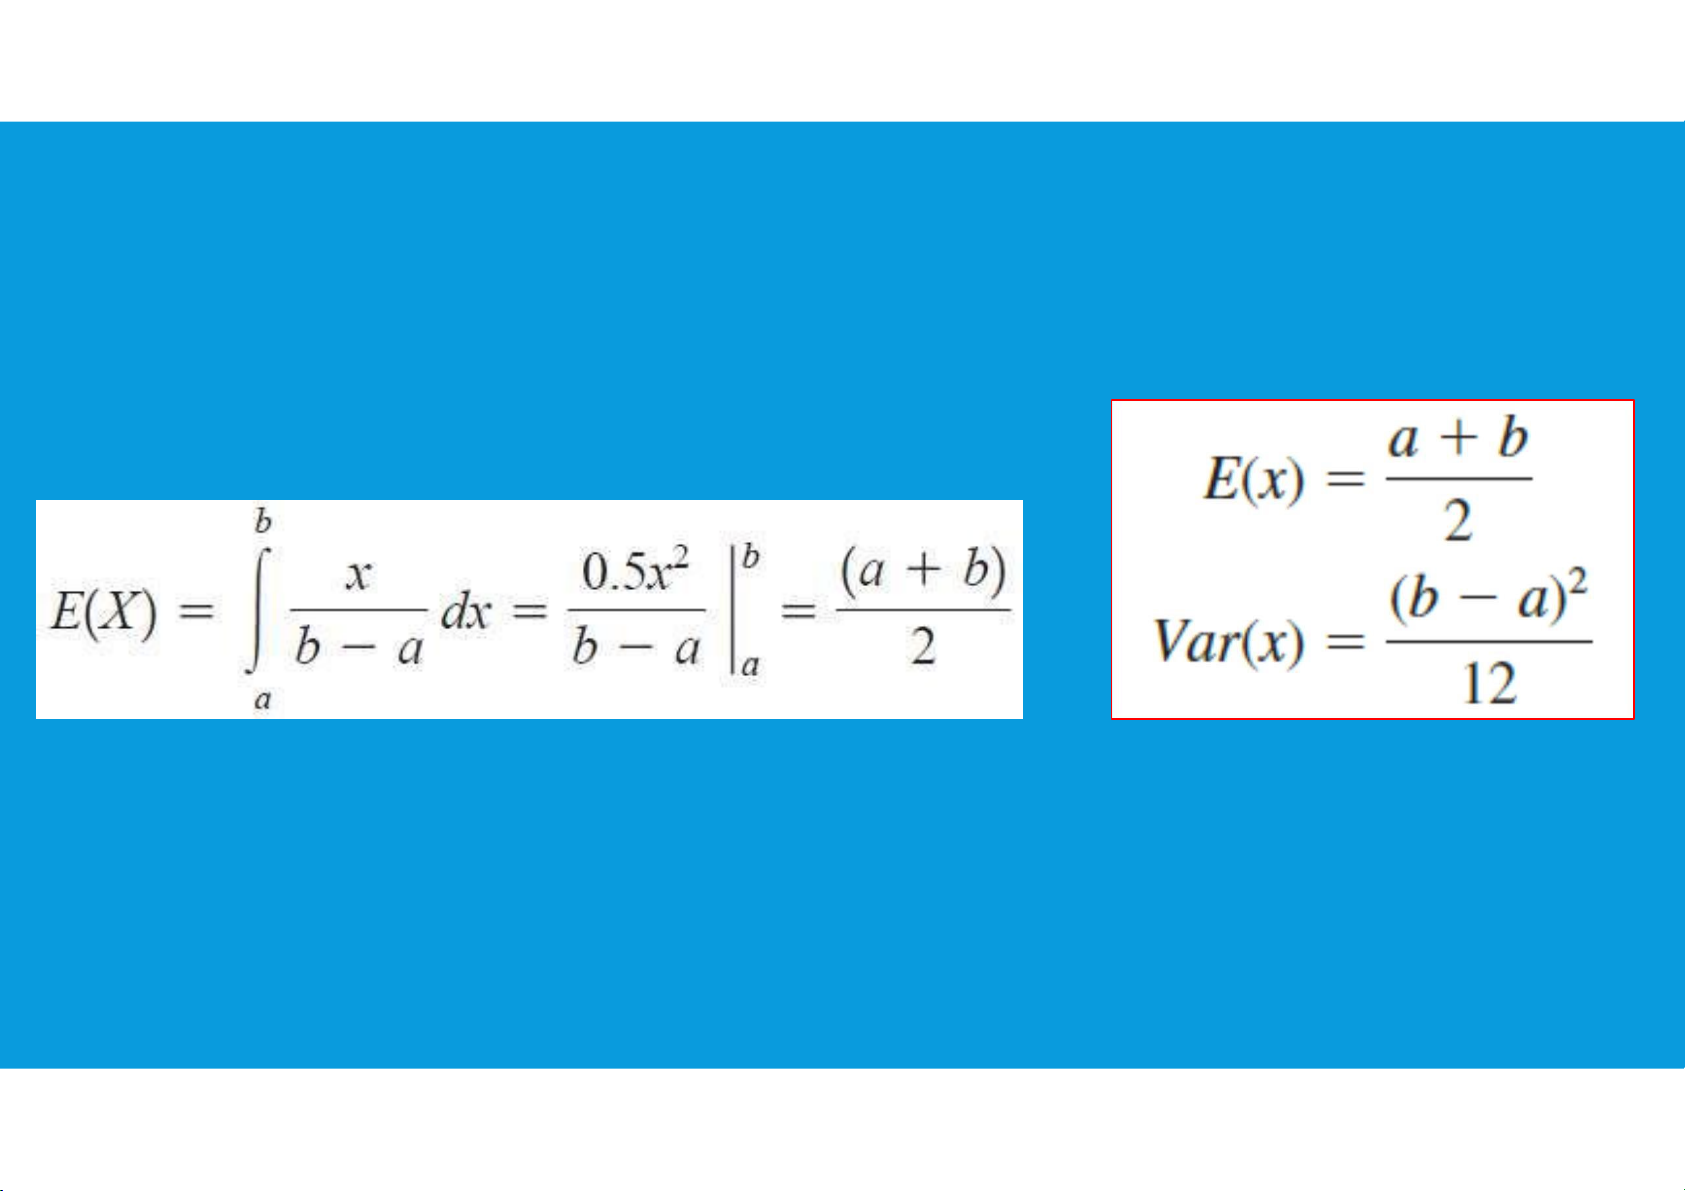
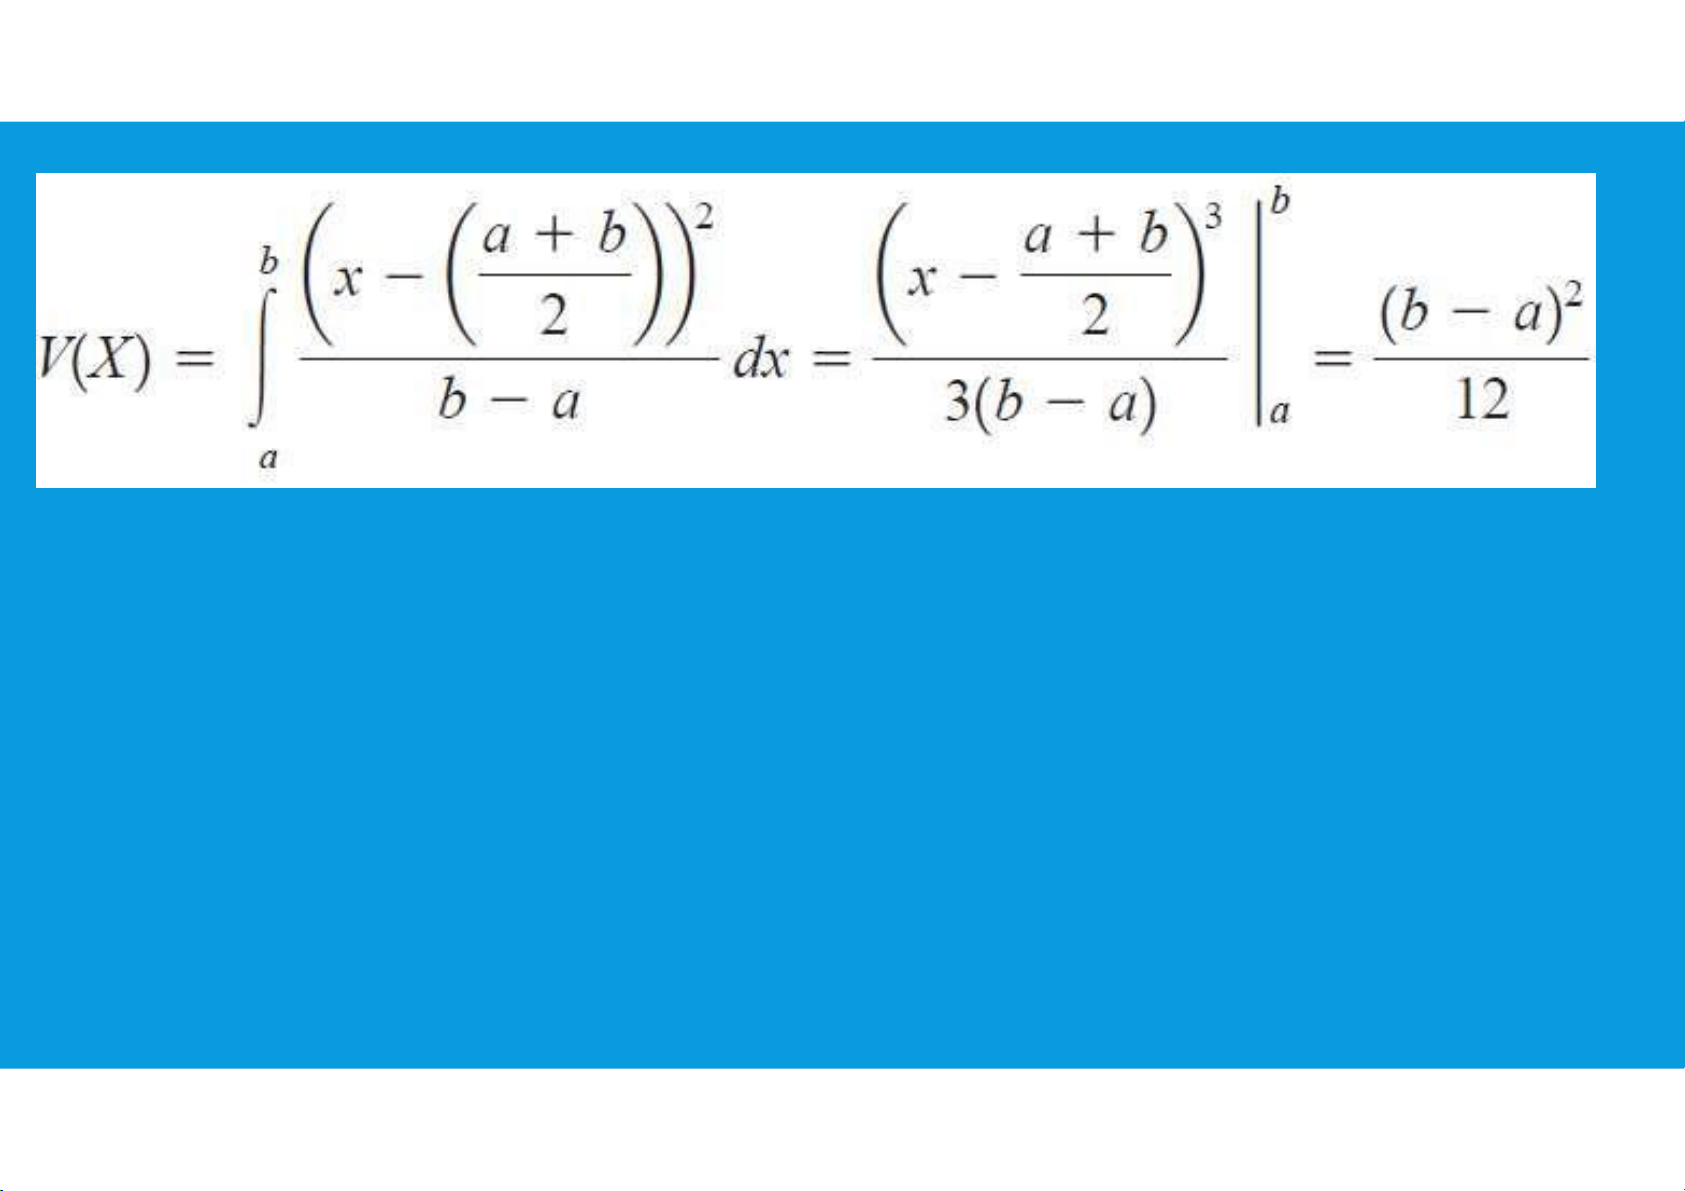
4.3. CONTINUOUS PROBABILITY DISTRIBUTIONS •Uniform probability distribution:
Uniform distributions are probability distributions with equally likely outcomes.
There are two types of uniform distributions: discrete and continuous.
In a discrete distribution, each outcome is discrete.
In a continuous distribution, outcomes are continuous and infinite. tttu@hcmiu.edu.vn 7 lOMoARcPSD|364 906 32
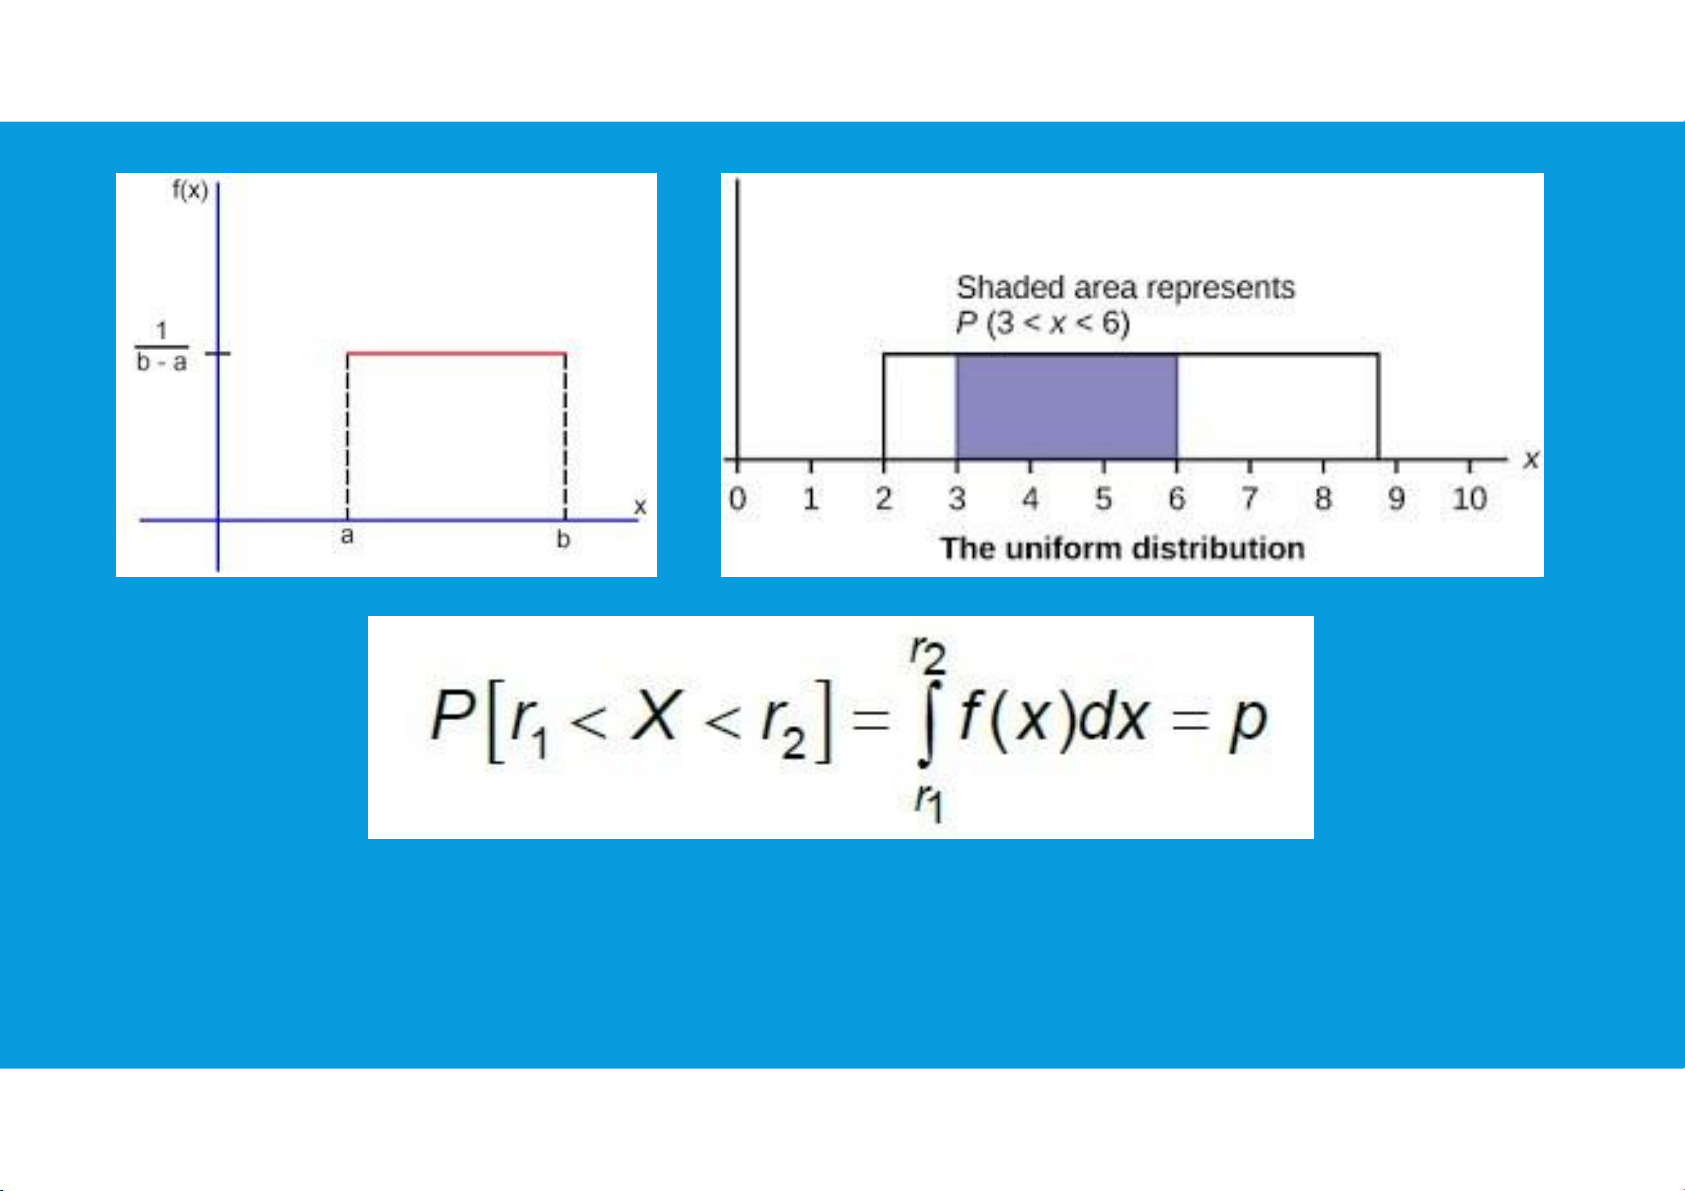
4.3. CONTINUOUS PROBABILITY DISTRIBUTIONS •Uniform probability distribution: tttu@hcmiu.edu.vn 8 lOMoARcPSD|364 906 32 tttu@hcmiu.edu.vn 9 lOMoARcPSD|364 906 32
4.3. CONTINUOUS PROBABILITY DISTRIBUTIONS •Uniform probability distribution: tttu@hcmiu.edu.vn 10 lOMoARcPSD|364 906 32
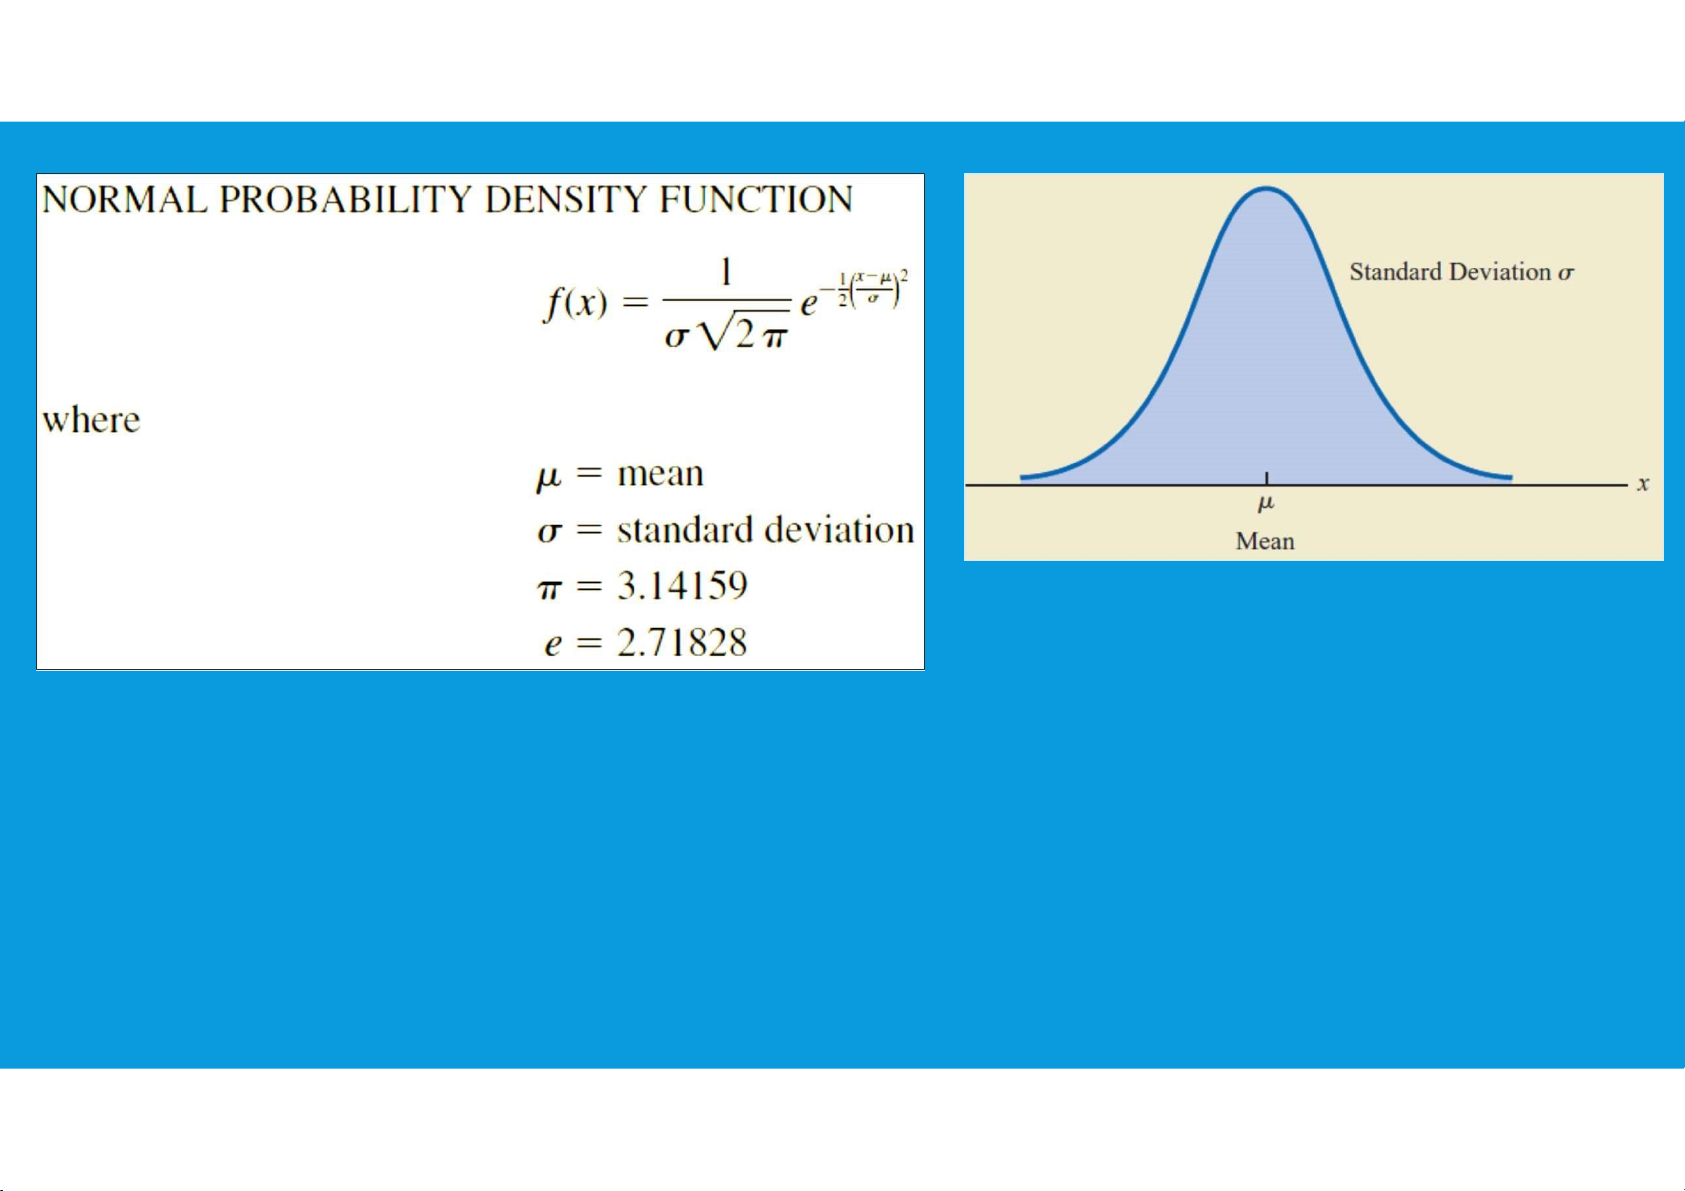
4.3. CONTINUOUS PROBABILITY DISTRIBUTIONS
•Normal probability distribution: The most important probability
distribution for describing a continuous random variable.
•Normal Curve: The form, or shape, of the normal distribution is illustrated by the bell-shaped normal curve tttu@hcmiu.edu.vn 11 lOMoARcPSD|364 906 32
4.3. CONTINUOUS PROBABILITY DISTRIBUTIONS
•Normal probability distribution: characteristics
•The entire family of normal distributions is differentiated by two parameters: the
mean µ and the standard deviation σ. tttu@hcmiu.edu.vn 12 lOMoARcPSD|364 906 32
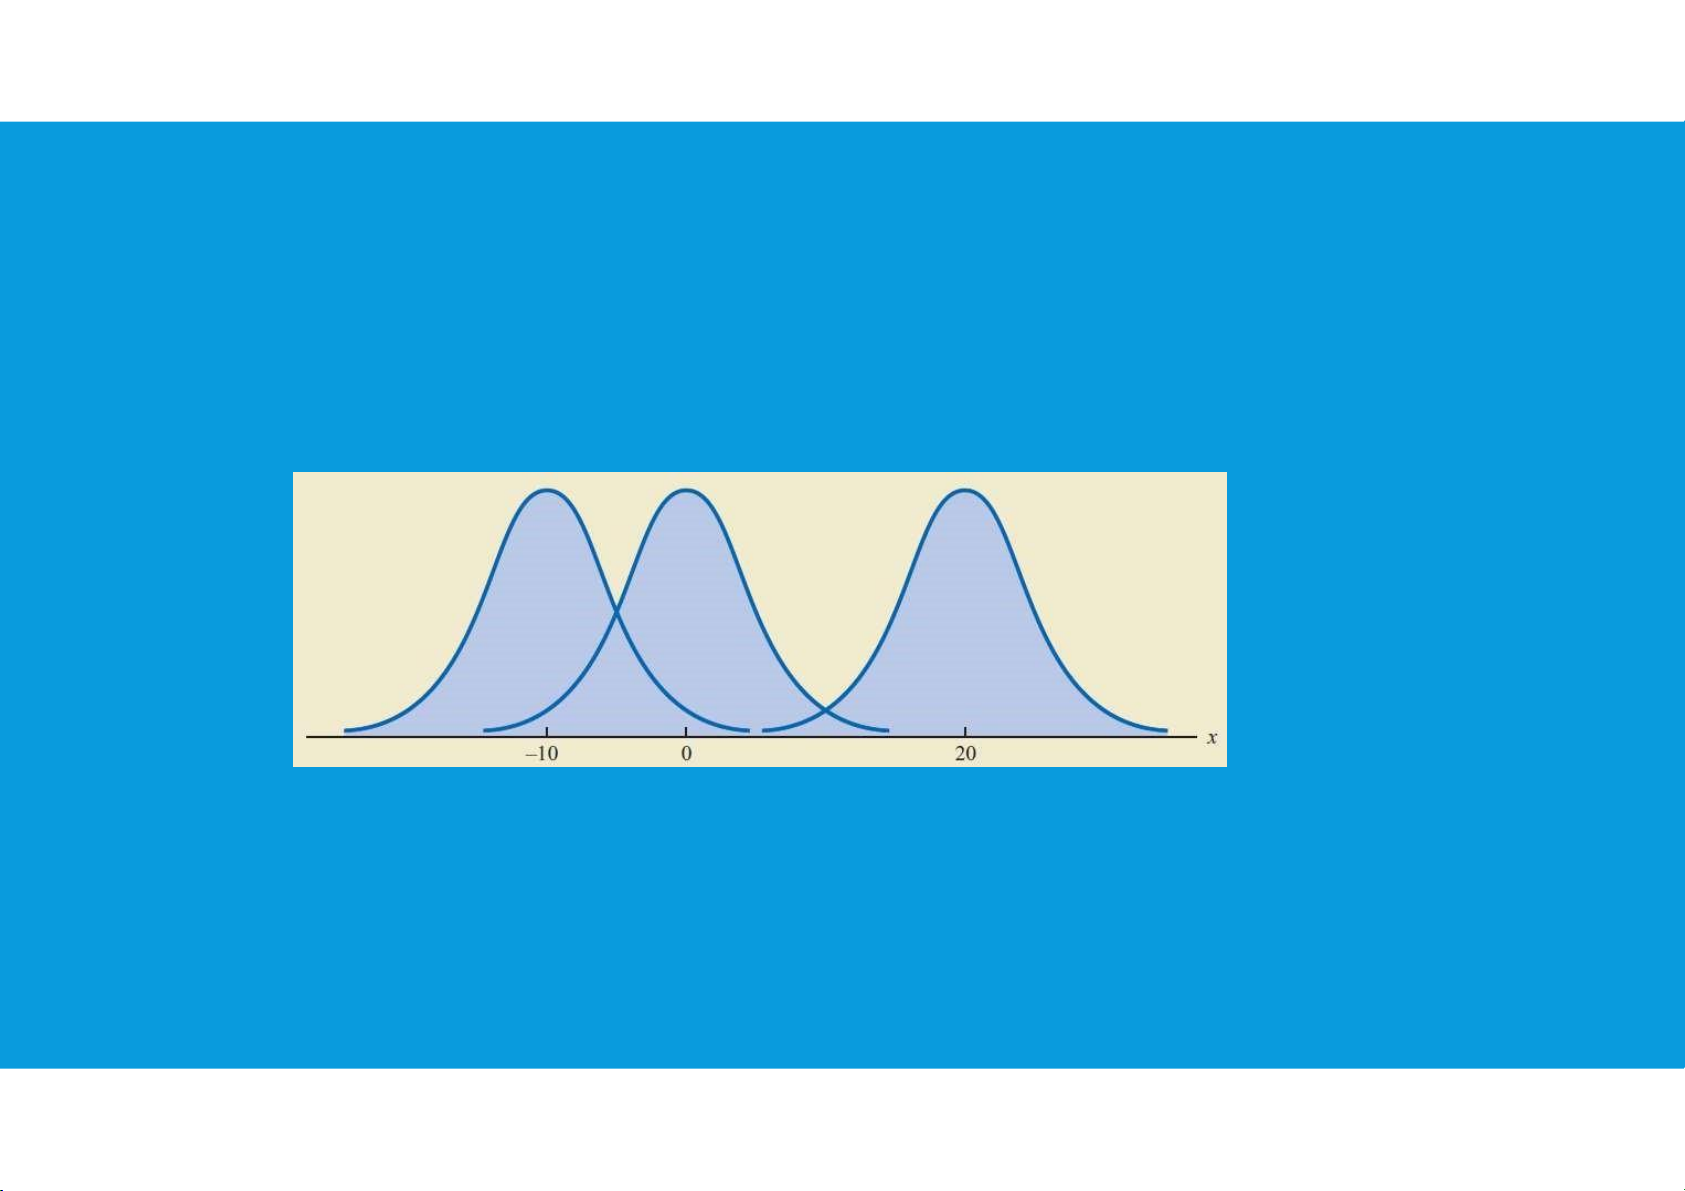
•The highest point on the normal curve is at the mean, which is also the median and mode of the distribution.
•The mean of the distribution can be any numerical value: negative, zero, or
positive. Three normal distributions with the same standard deviation but three
different means (−10, 0, and 20) are shown here.
4.3. CONTINUOUS PROBABILITY DISTRIBUTIONS tttu@hcmiu.edu.vn 13 lOMoARcPSD|364 906 32
•Normal probability distribution: characteristics
• The normal distribution is symmetric, with the shape of the normal curve to the left of
the mean a mirror image of the shape of the normal curve to the right of the mean. The
tails of the normal curve extend to infinity in both directions and theoretically never
touch the horizontal axis. Because it is symmetric, the normal distribution is not
skewed; its skewness measure is zero.
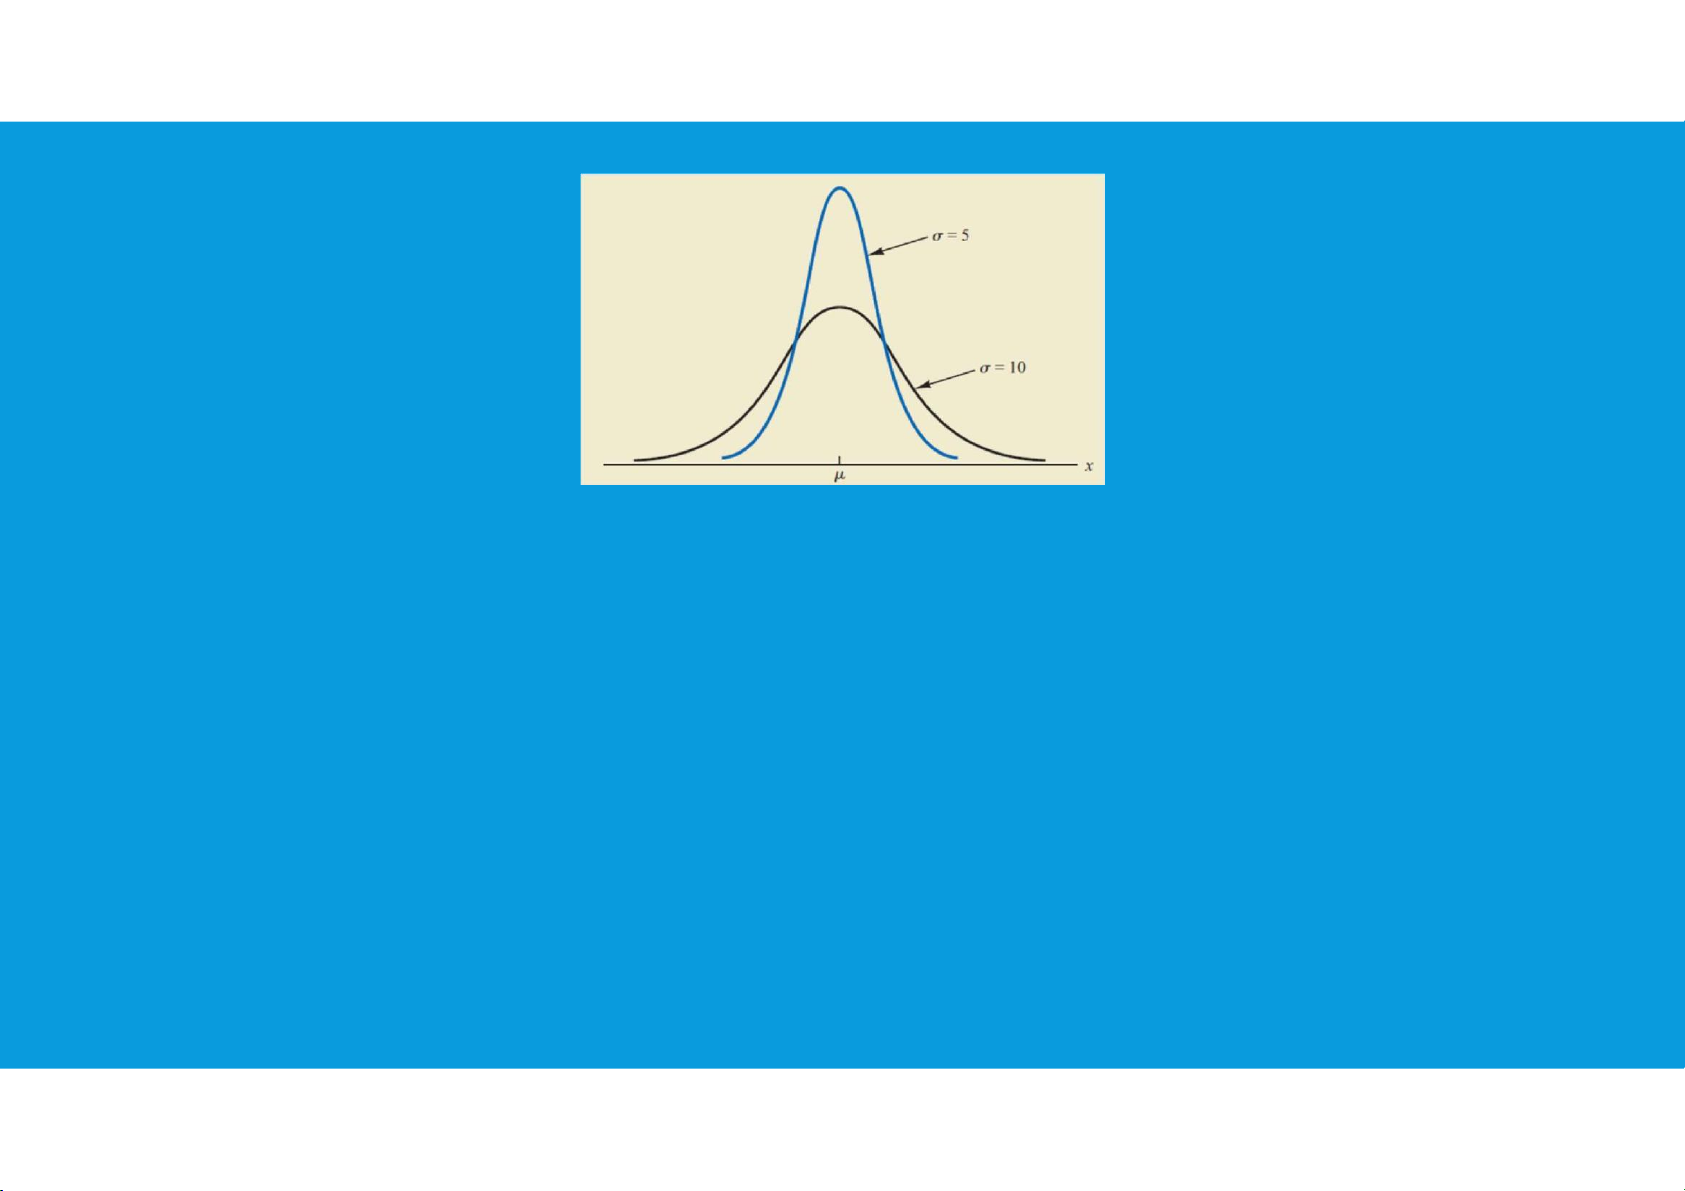
• The standard deviation determines how flat and wide the normal curve is. Larger values
of the standard deviation result in wider, flatter curves, showing more variability in the
data. Two normal distributions with the same mean but with different standard deviations are shown here. tttu@hcmiu.edu.vn 14 lOMoARcPSD|364 906 32
4.3. CONTINUOUS PROBABILITY DISTRIBUTIONS
•Normal probability distribution: characteristics
•Probabilities for the normal random variable are given by areas under the normal
curve. The total area under the curve for the normal distribution is 1. Because the
distribution is symmetric, the area under the curve to the left of the mean is 0.5
and the area under the curve to the right of the mean is 0.5. tttu@hcmiu.edu.vn 15 lOMoARcPSD|364 906 32
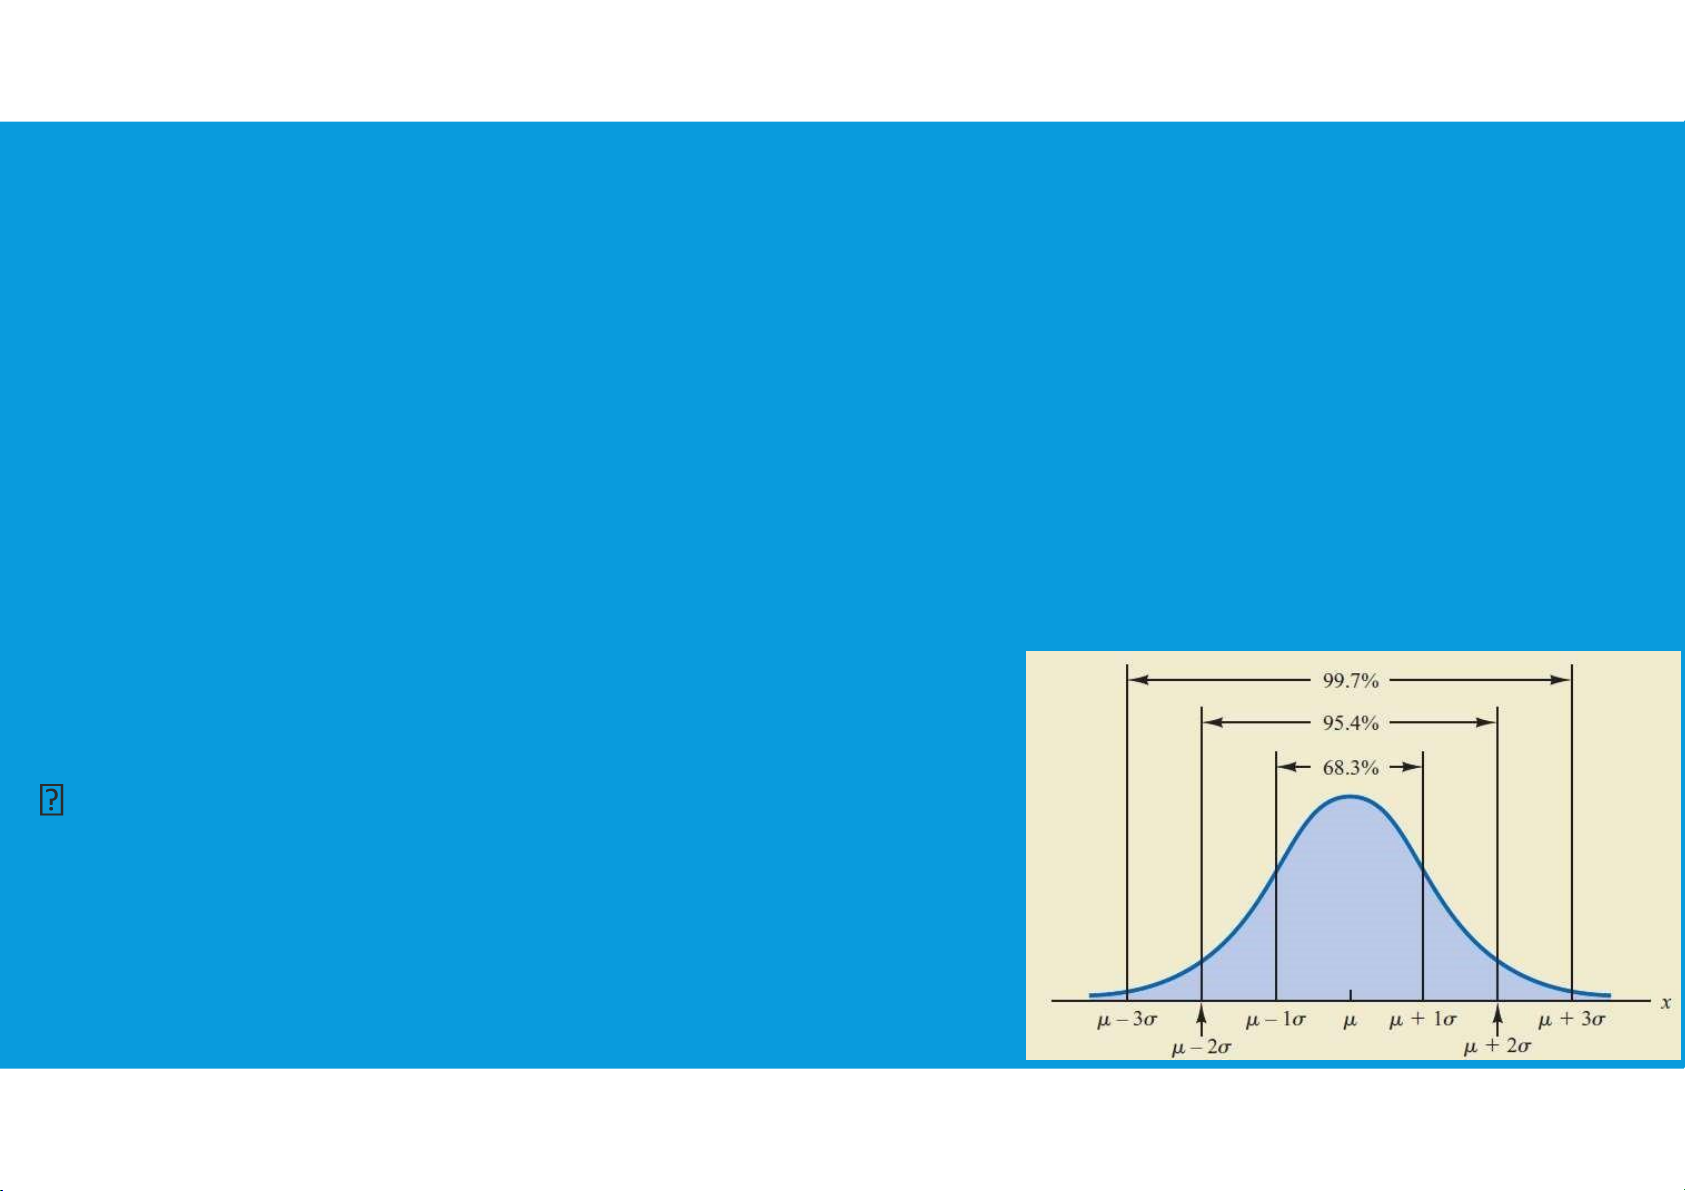
•The percentage of values in some commonly used intervals are:
a. 68.3% of the values of a normal random variable are within
plus or minus one standard deviation of its mean. b. 95.4% of
the values of a normal random variable are within plus or minus
two standard deviations of its mean. c. 99.7% of the values of a
normal random variable are within plus or minus three standard deviations of its mean.
4.3. CONTINUOUS PROBABILITY DISTRIBUTIONS
•Normal probability distribution:
Standard Normal Probability Distribution: A
random variable that has a normal distribution
with a mean of zero and a standard deviation tttu@hcmiu.edu.vn 16 lOMoARcPSD|364 906 32
of one is said to have a standard normal probability distribution.
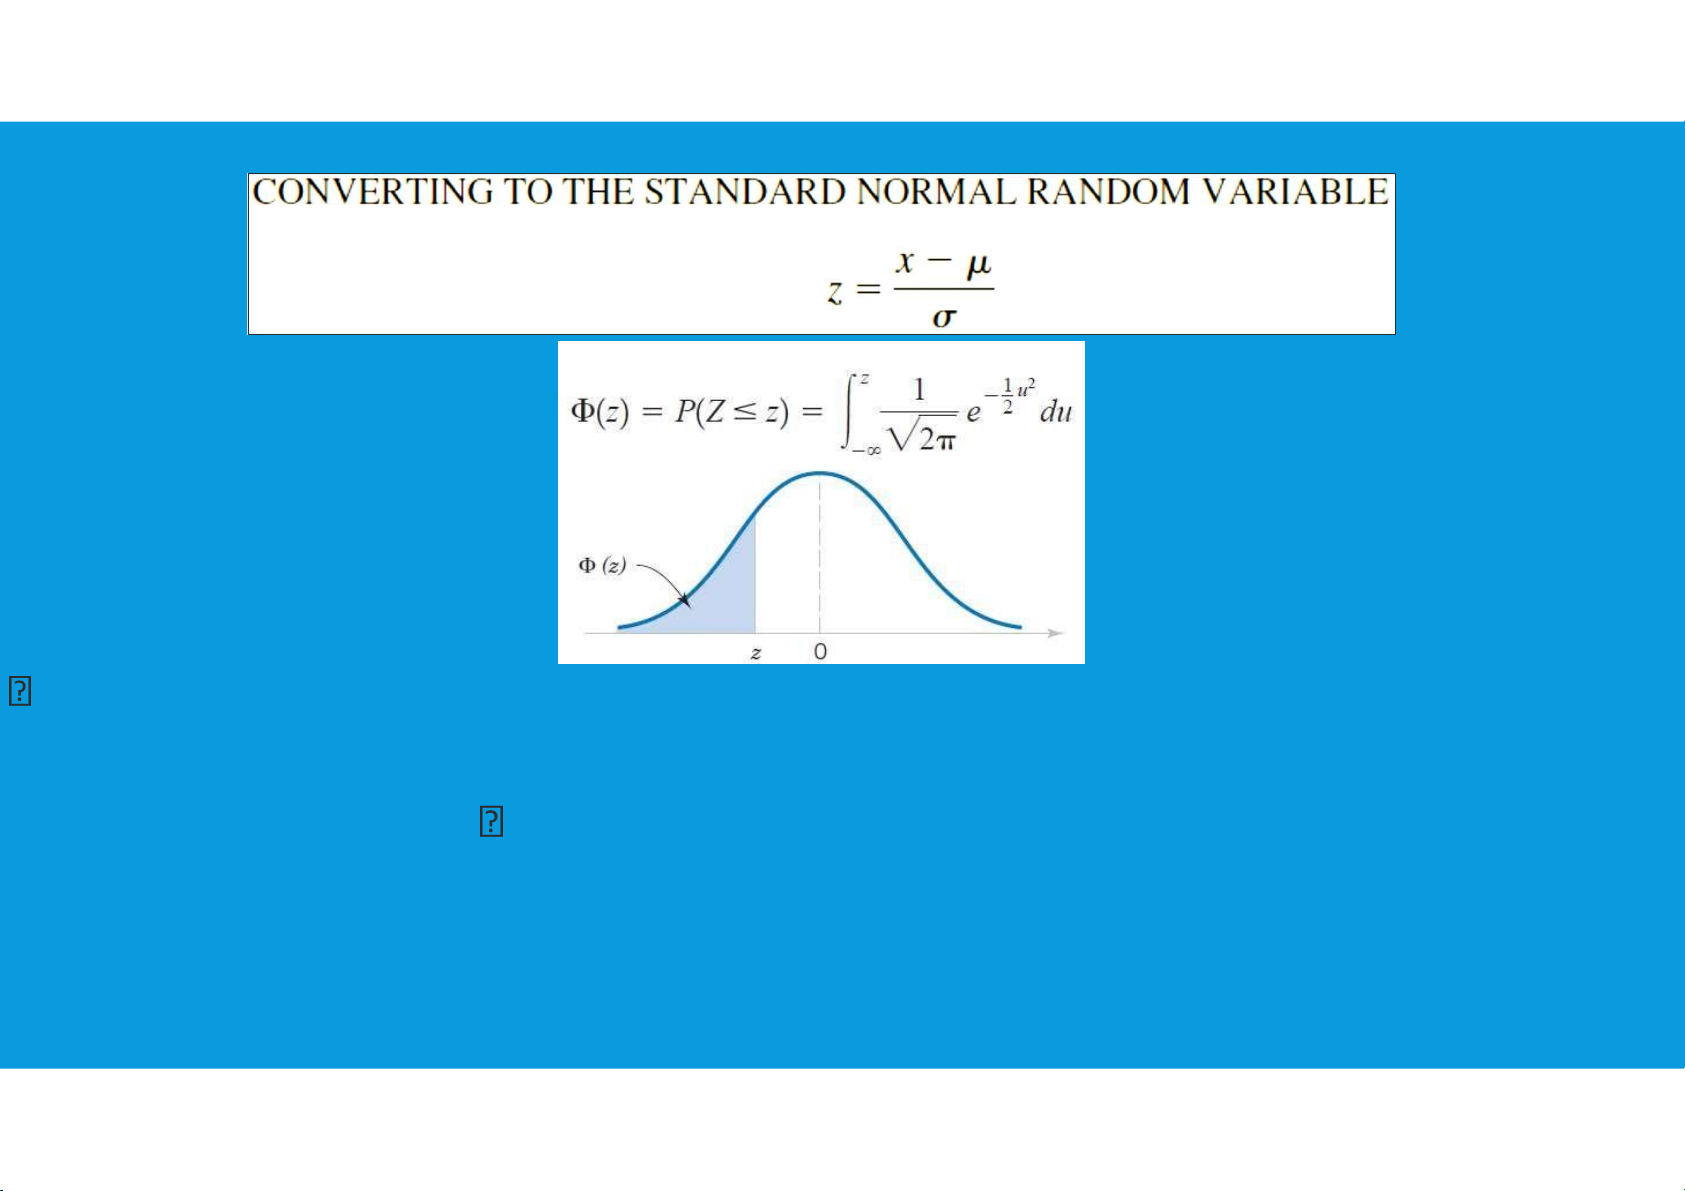
4.3. CONTINUOUS PROBABILITY DISTRIBUTIONS
•Normal probability distribution:
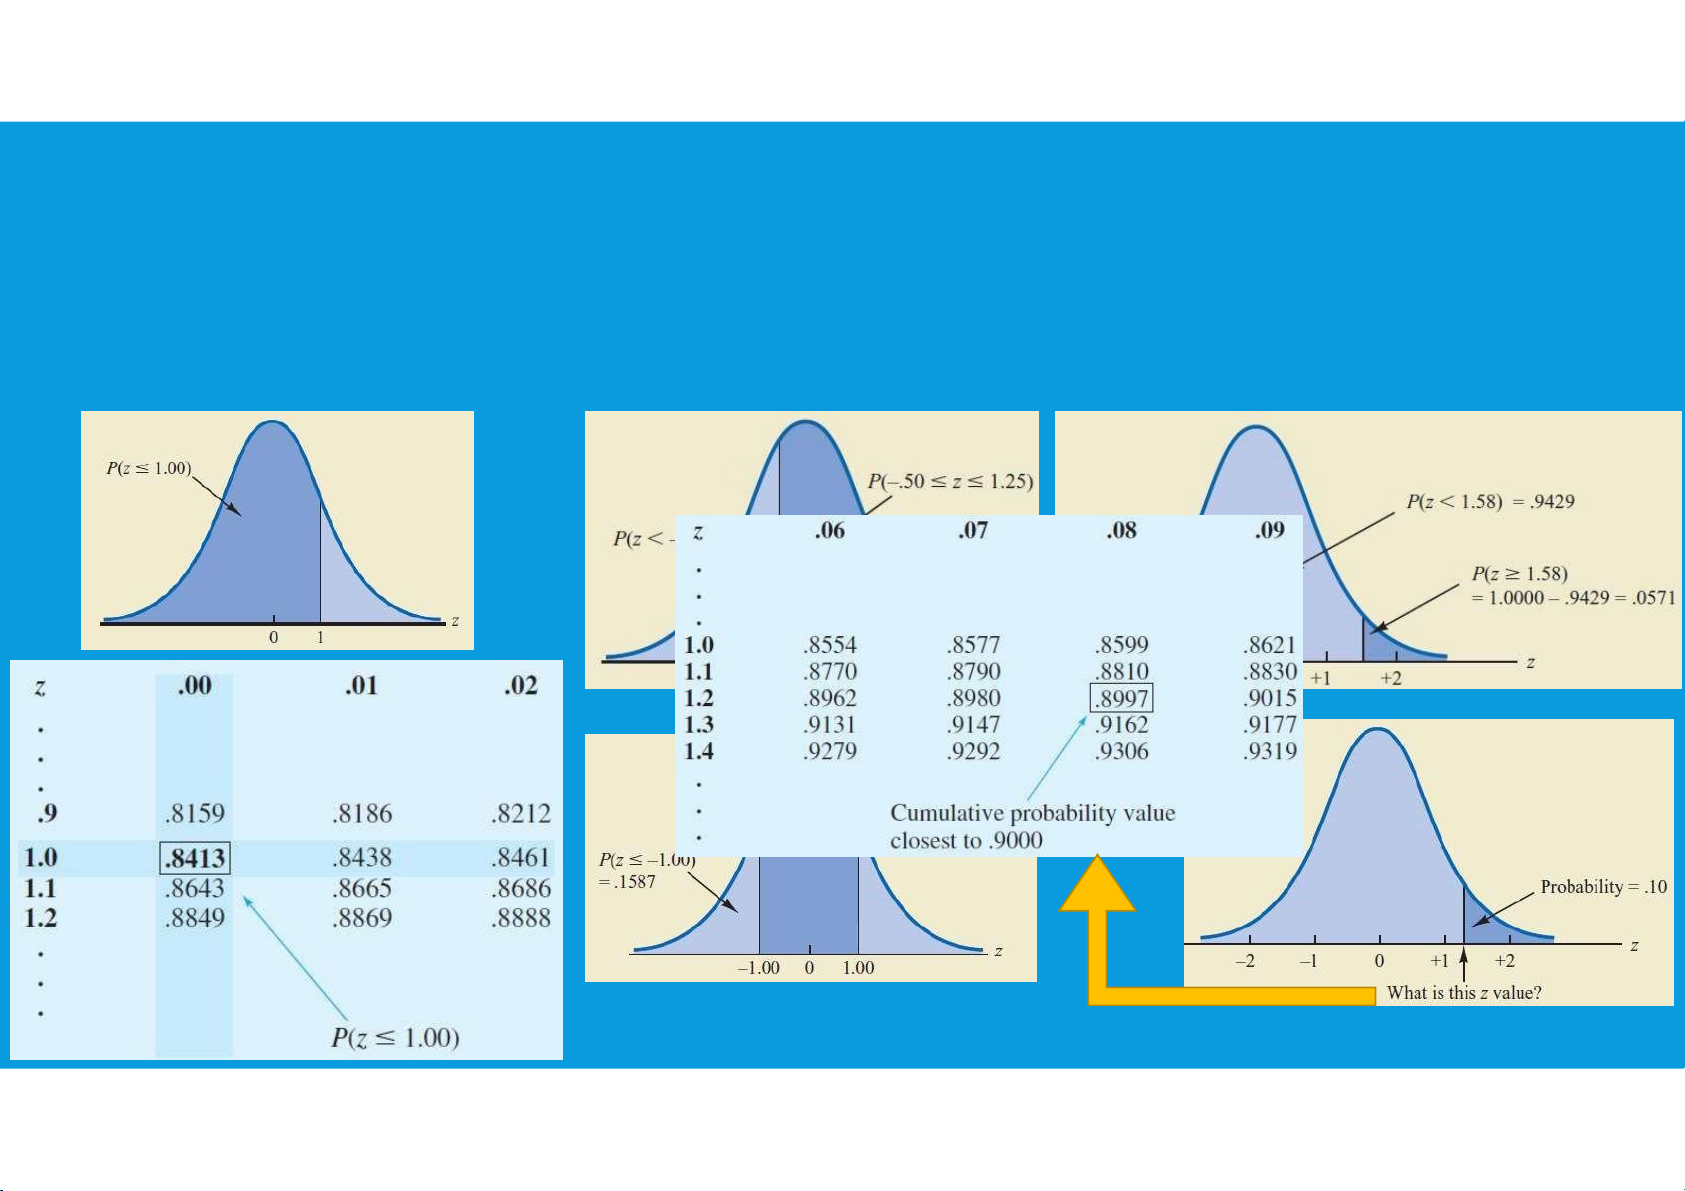
Computing Probabilities for Any Normal Probability Distribution: tttu@hcmiu.edu.vn 17 lOMoARcPSD|364 906 32
we can interpret z as the number of standard deviations that the normal random
variable x is from its mean µ.
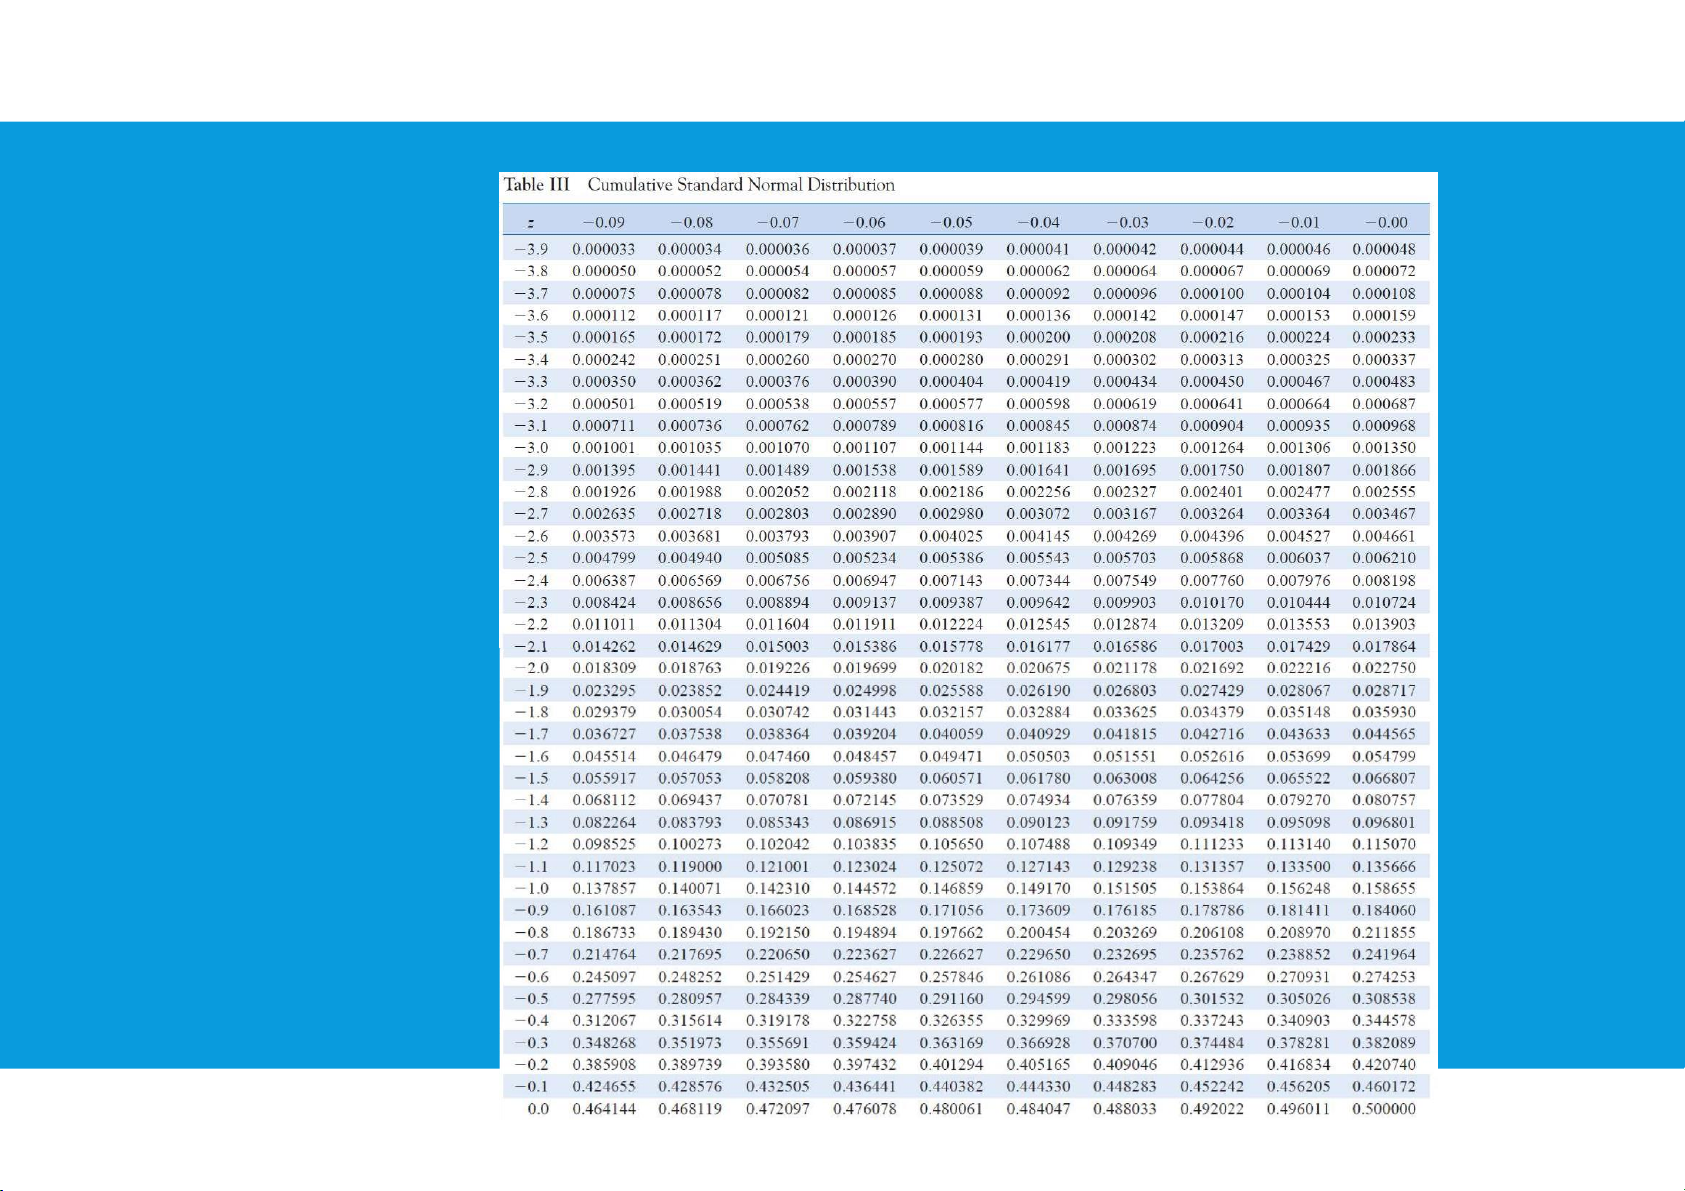
Use the table to check the probability tttu@hcmiu.edu.vn 18 lOMoARcPSD|364 906 32 •Normal tttu@hcmiu.edu.vn 19 lOMoARcPSD|364 906 32 probability distribution (z < 0): tttu@hcmiu.edu.vn 20 lOMoARcPSD|364 906 32 •Normal tttu@hcmiu.edu.vn 21 lOMoARcPSD|364 906 32 probability distribution (z > 0): tttu@hcmiu.edu.vn 22 lOMoARcPSD|364 906 32
4.3. CONTINUOUS PROBABILITY DISTRIBUTIONS
•Normal probability distribution: tttu@hcmiu.edu.vn 23 lOMoARcPSD|364 906 32
Computing Probabilities for Any Normal Probability Distribution: tttu@hcmiu.edu.vn 24 lOMoARcPSD|364 906 32 End of file 1. Any questions? tttu@hcmiu.edu.vn 18
4.3. CONTINUOUS PROBABILITY DISTRIBUTIONS
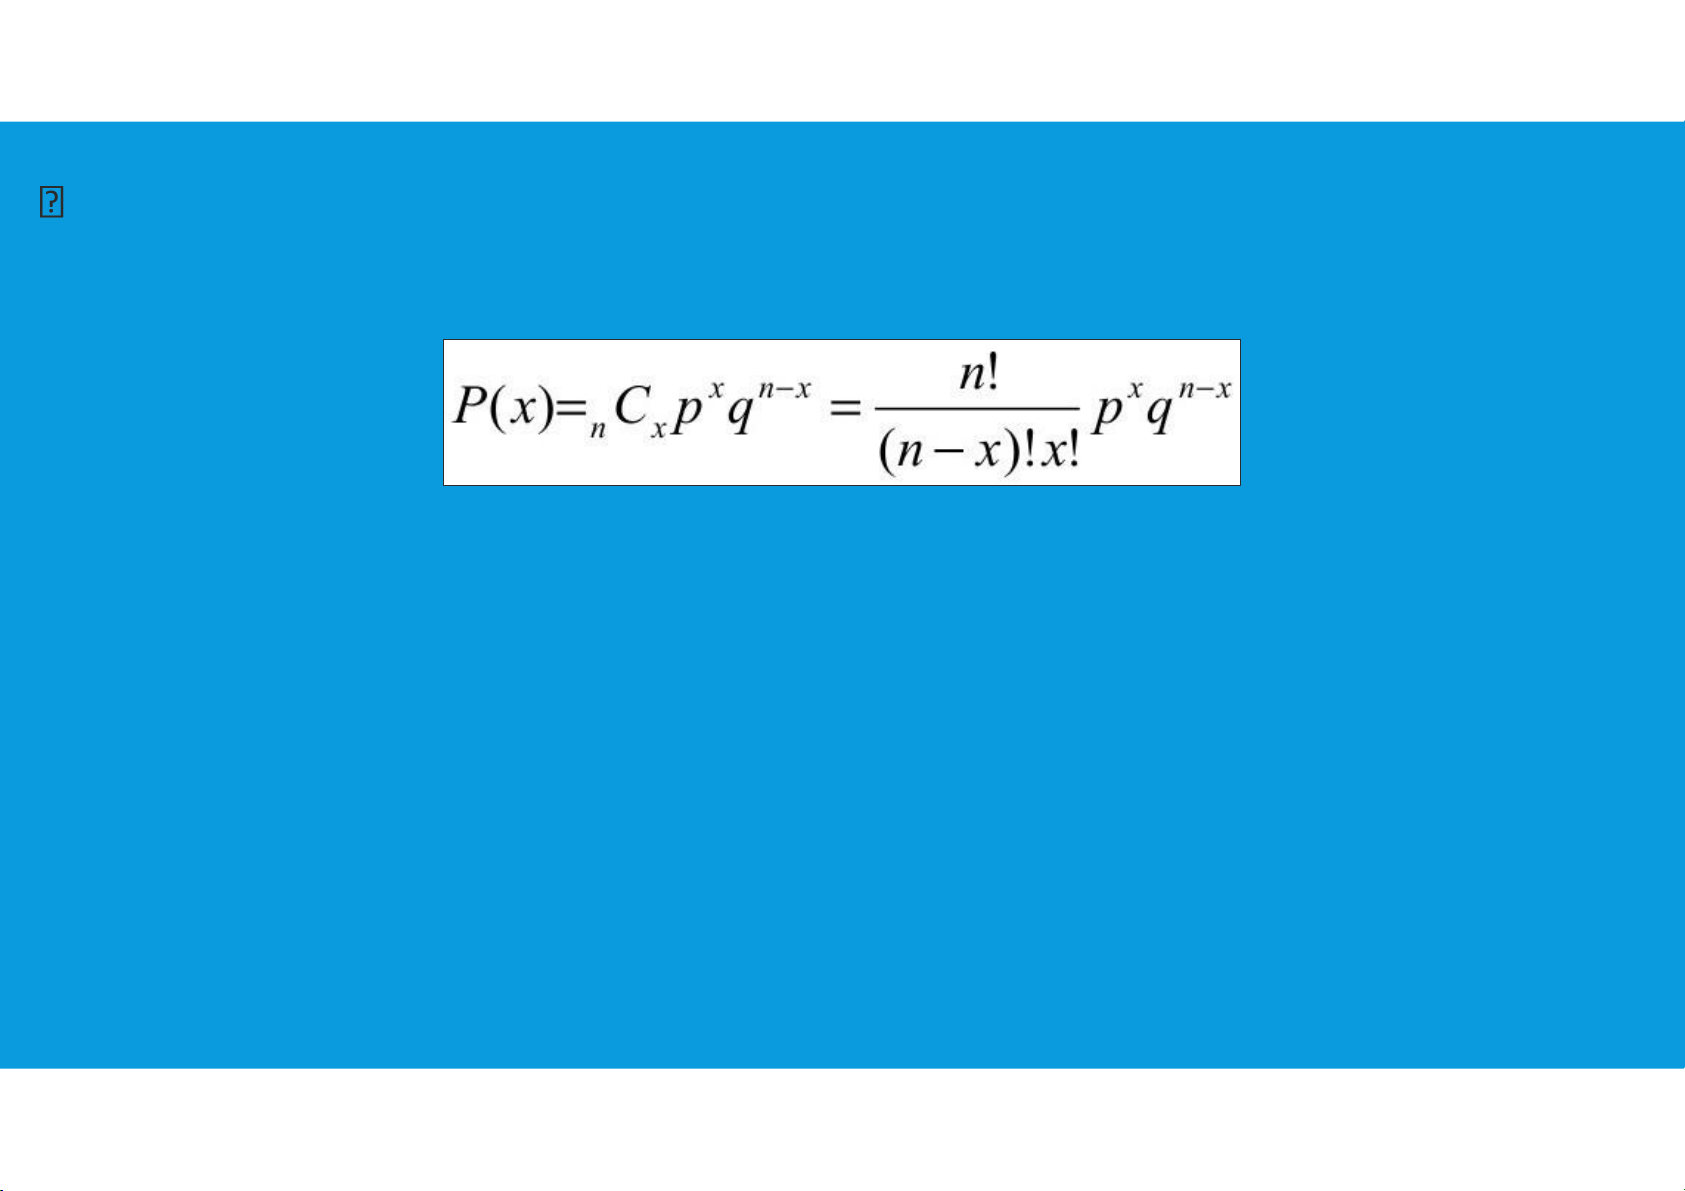
•Normal approximation of binomial probabilities:
The binomial random variable is the number of successes in the n trials, and
probability questions pertain to the probability of x successes in the n trials. lOMoARcPSD|364 906 32
Binomial probability refers to the probability of exactly x successes on n
repeated trials in an experiment which has two possible outcomes (commonly
called a binomial experiment).
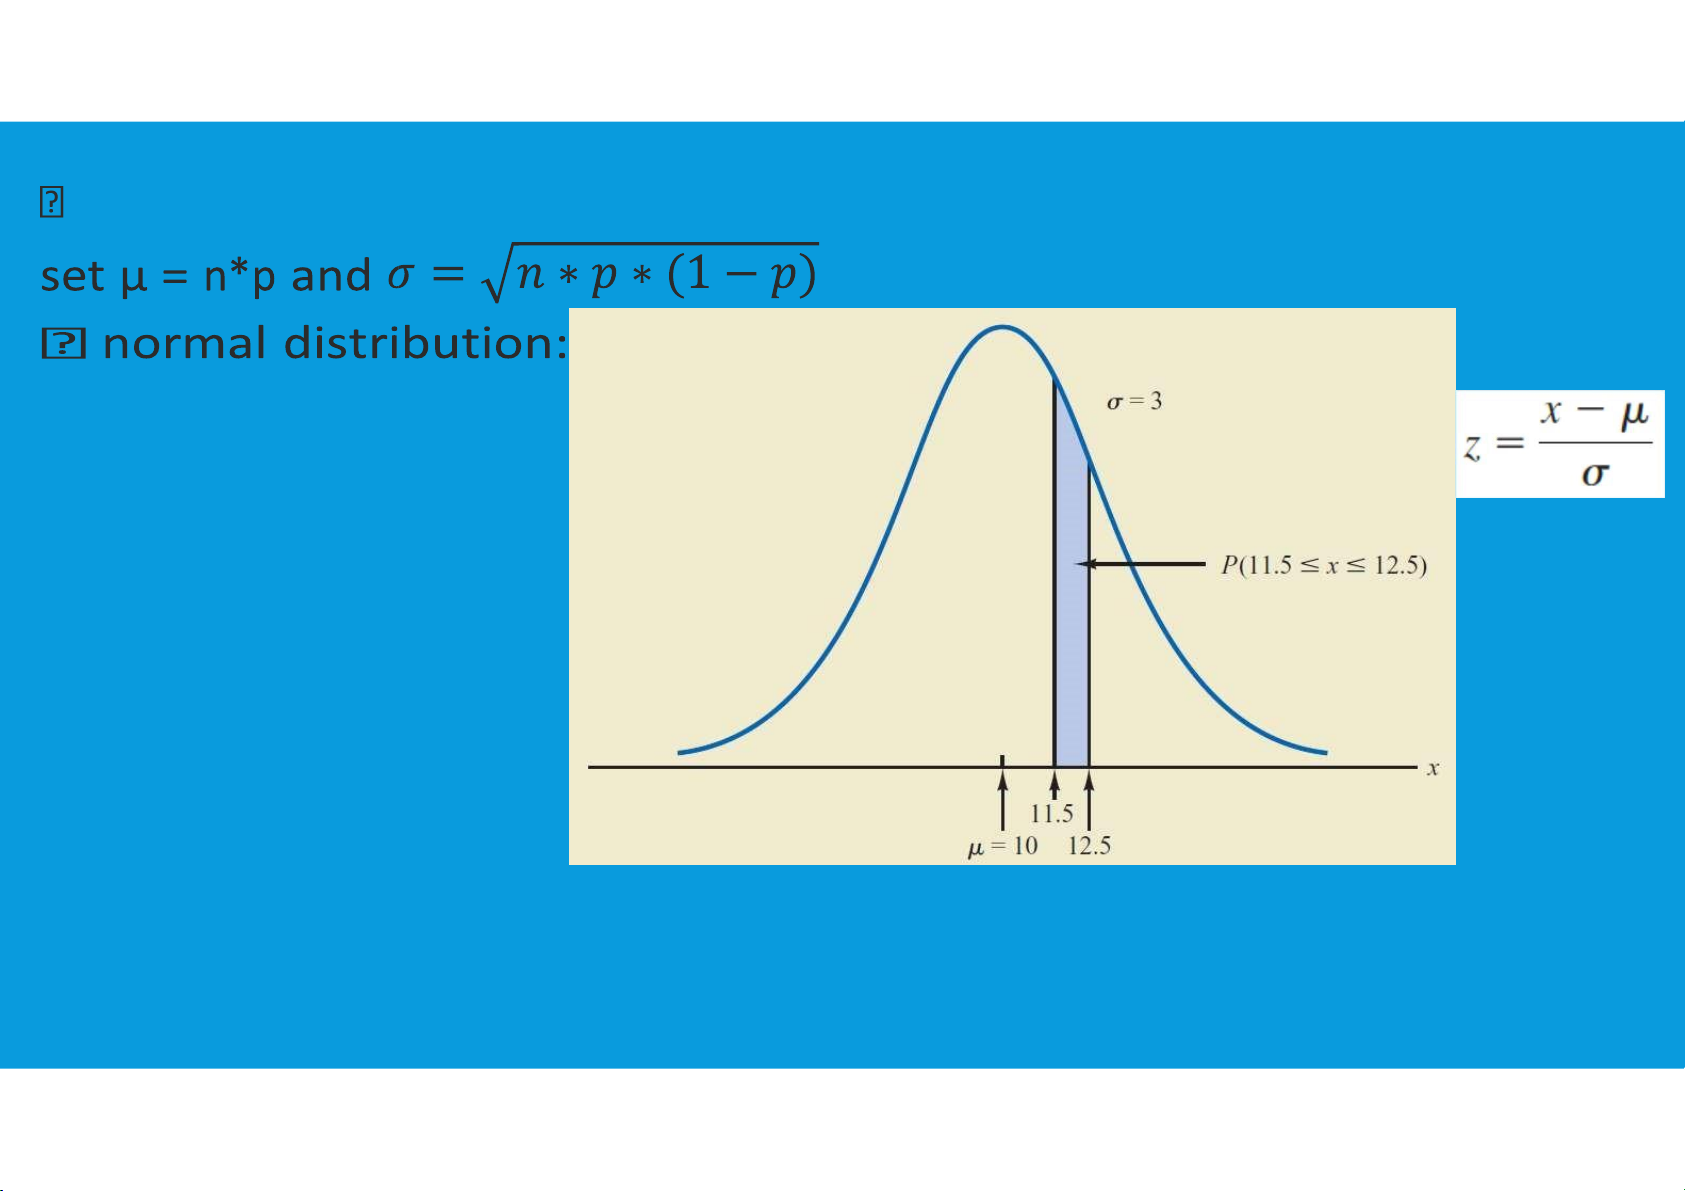
4.3. CONTINUOUS PROBABILITY DISTRIBUTIONS
•Normal approximation of binomial probabilities: tttu@hcmiu.edu.vn 26 lOMoARcPSD|364 906 32
In cases where n*p ≥ 5, and n*(1 − p) ≥ 5: tttu@hcmiu.edu.vn 27 lOMoARcPSD|364 906 32
4.3. CONTINUOUS PROBABILITY DISTRIBUTIONS
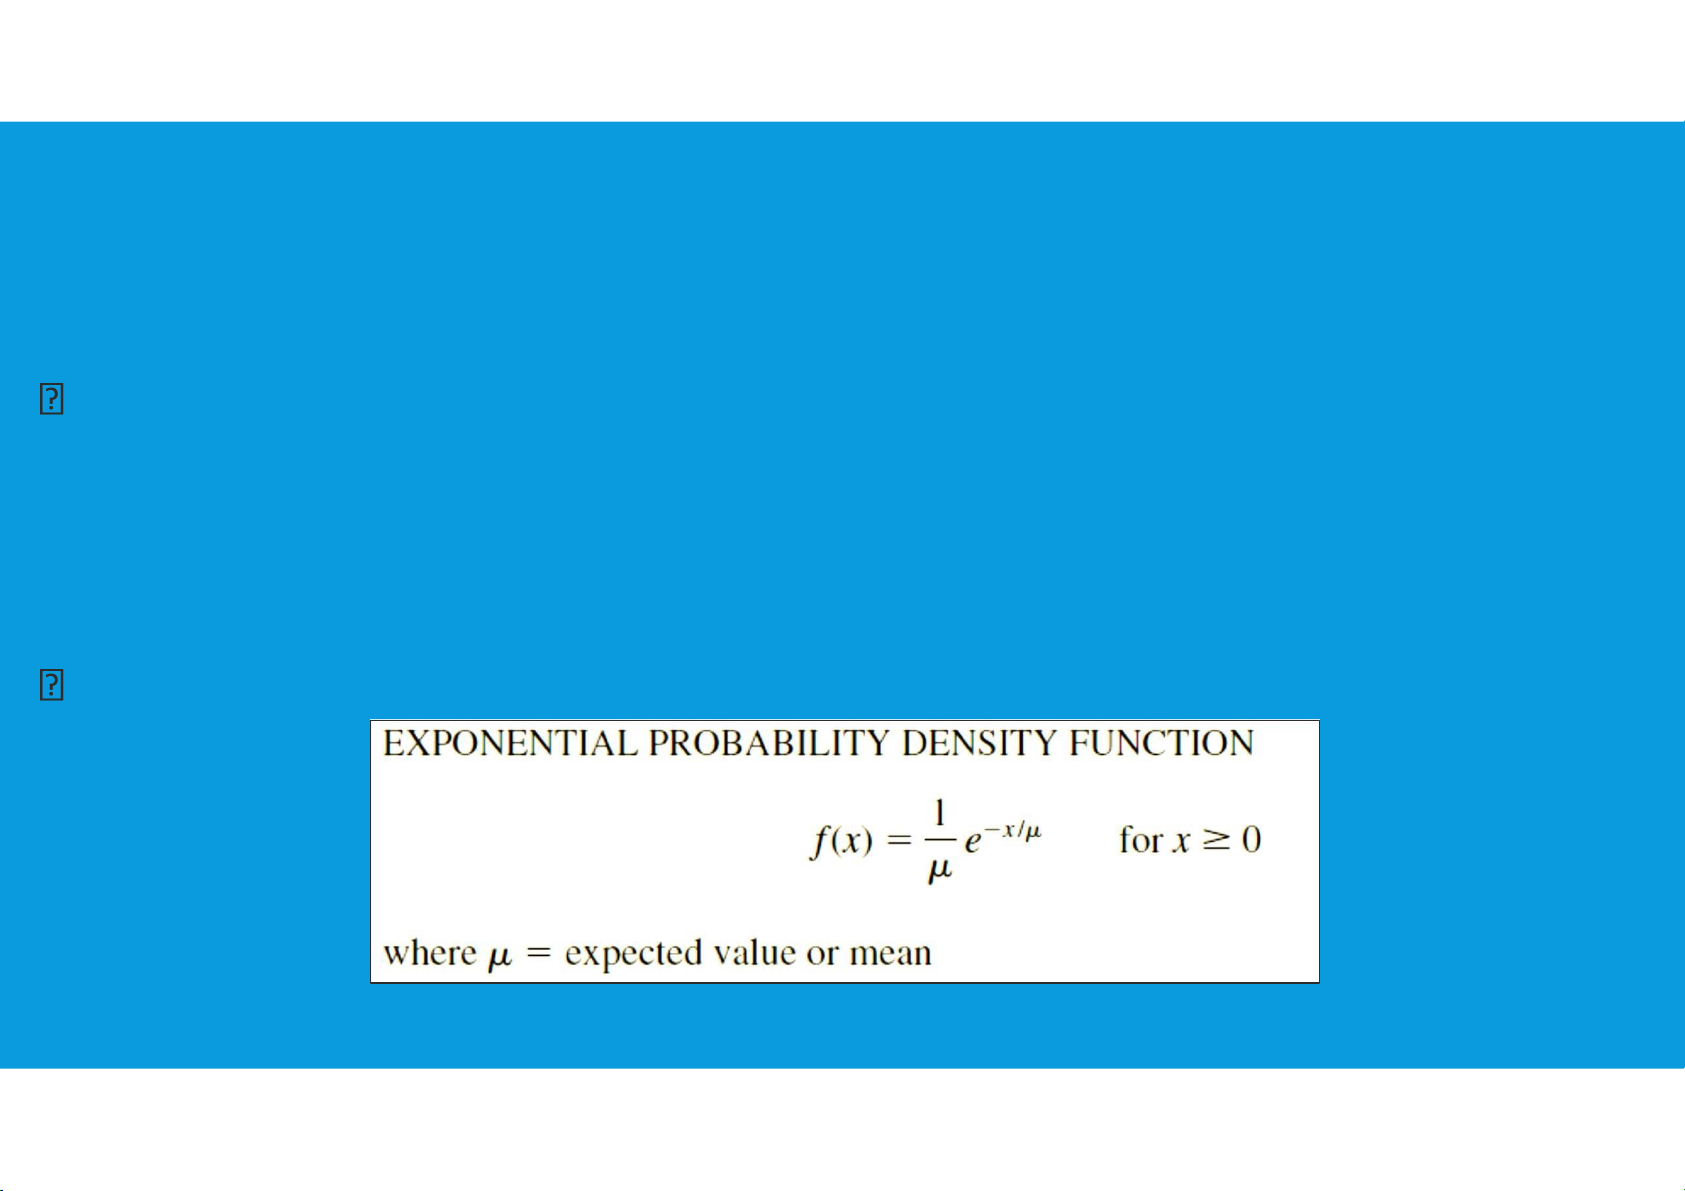
•Exponential probability distribution:
In probability theory and statistics, the exponential distribution is the
probability distribution of the time between events in a Poisson point process,
i.e., a process in which events occur continuously and independently at a
constant average rate (time between arrivals at a car wash, the time required
to load a truck, the distance between major defects in a highway, and so on).
It is a particular case of the gamma distribution. tttu@hcmiu.edu.vn 28 lOMoARcPSD|364 906 32
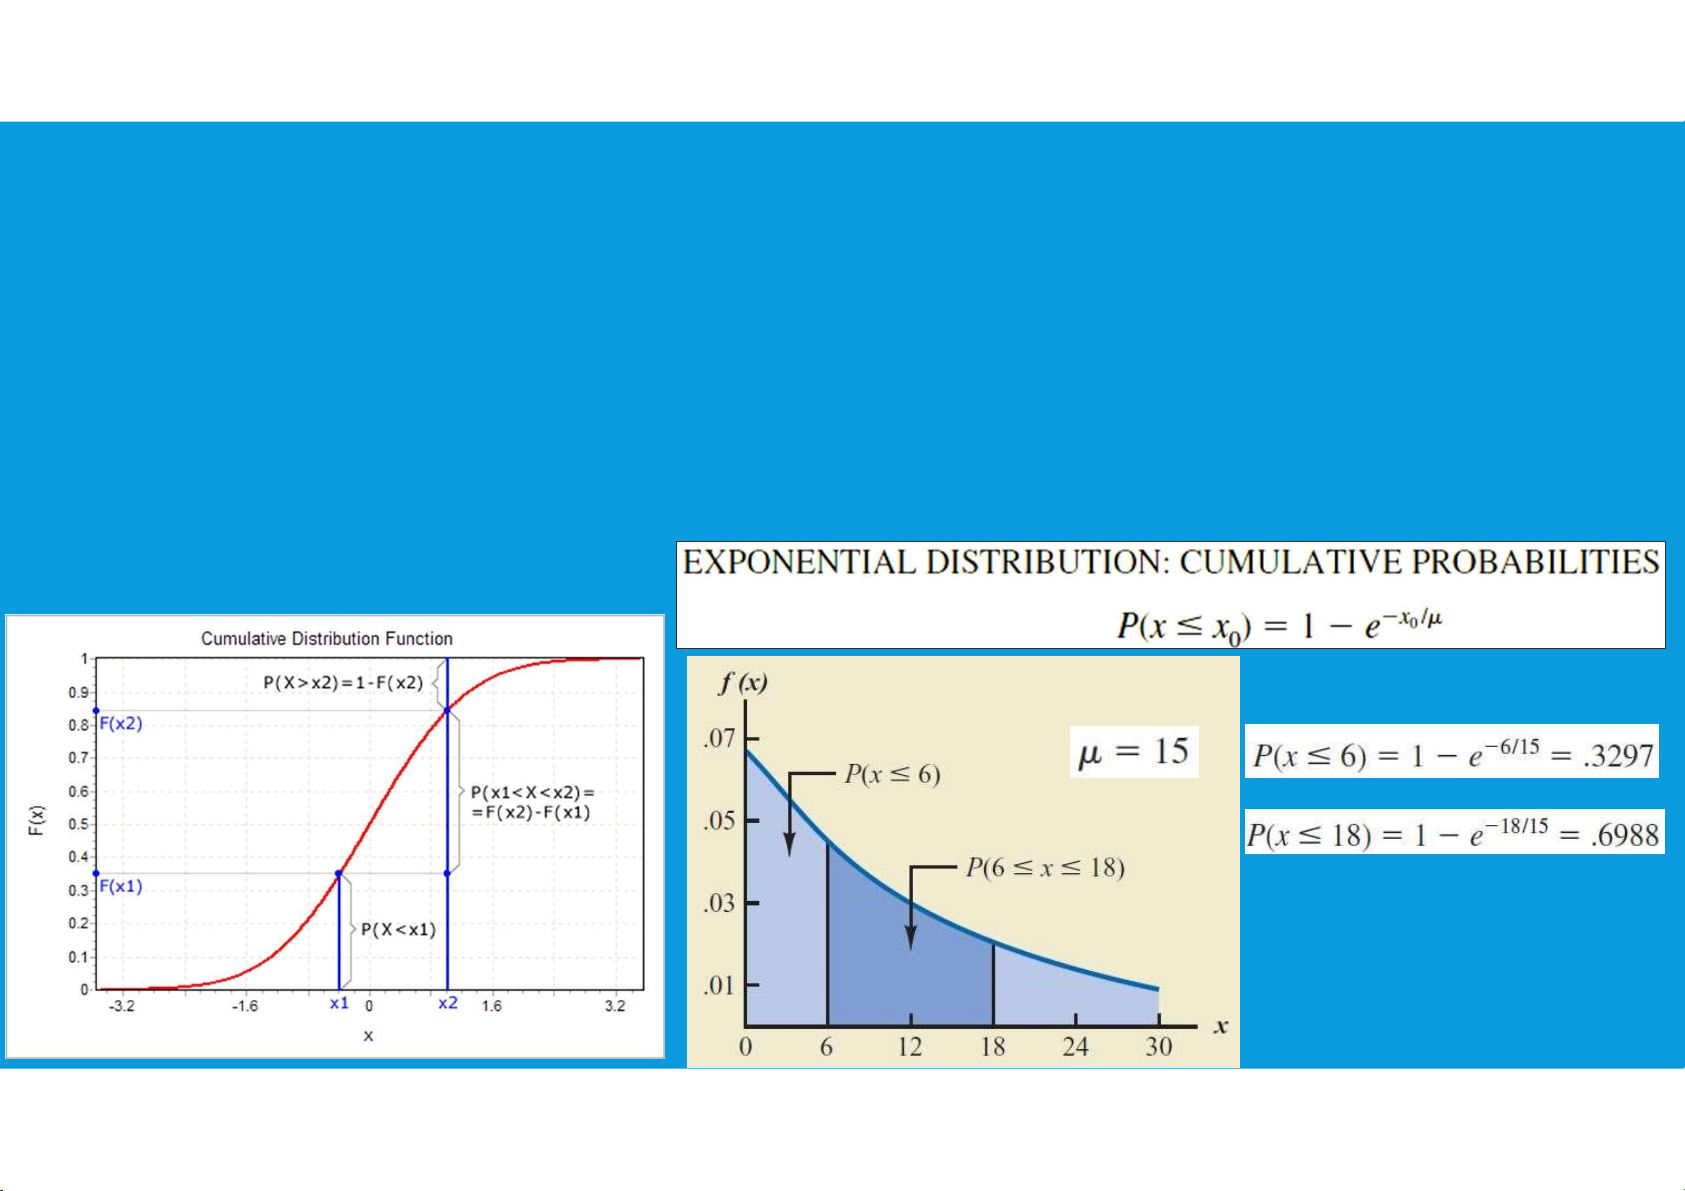
4.3. CONTINUOUS PROBABILITY DISTRIBUTIONS
•Exponential probability distribution:
•Computing Probabilities for the Exponential Distribution: As with any continuous
probability distribution, the area under the curve corresponding to an interval tttu@hcmiu.edu.vn 29 lOMoARcPSD|364 906 32
provides the probability that the random variable assumes a value in that interval. tttu@hcmiu.edu.vn 30 lOMoARcPSD|364 906 32
4.3. CONTINUOUS PROBABILITY DISTRIBUTIONS
•Exponential probability distribution:
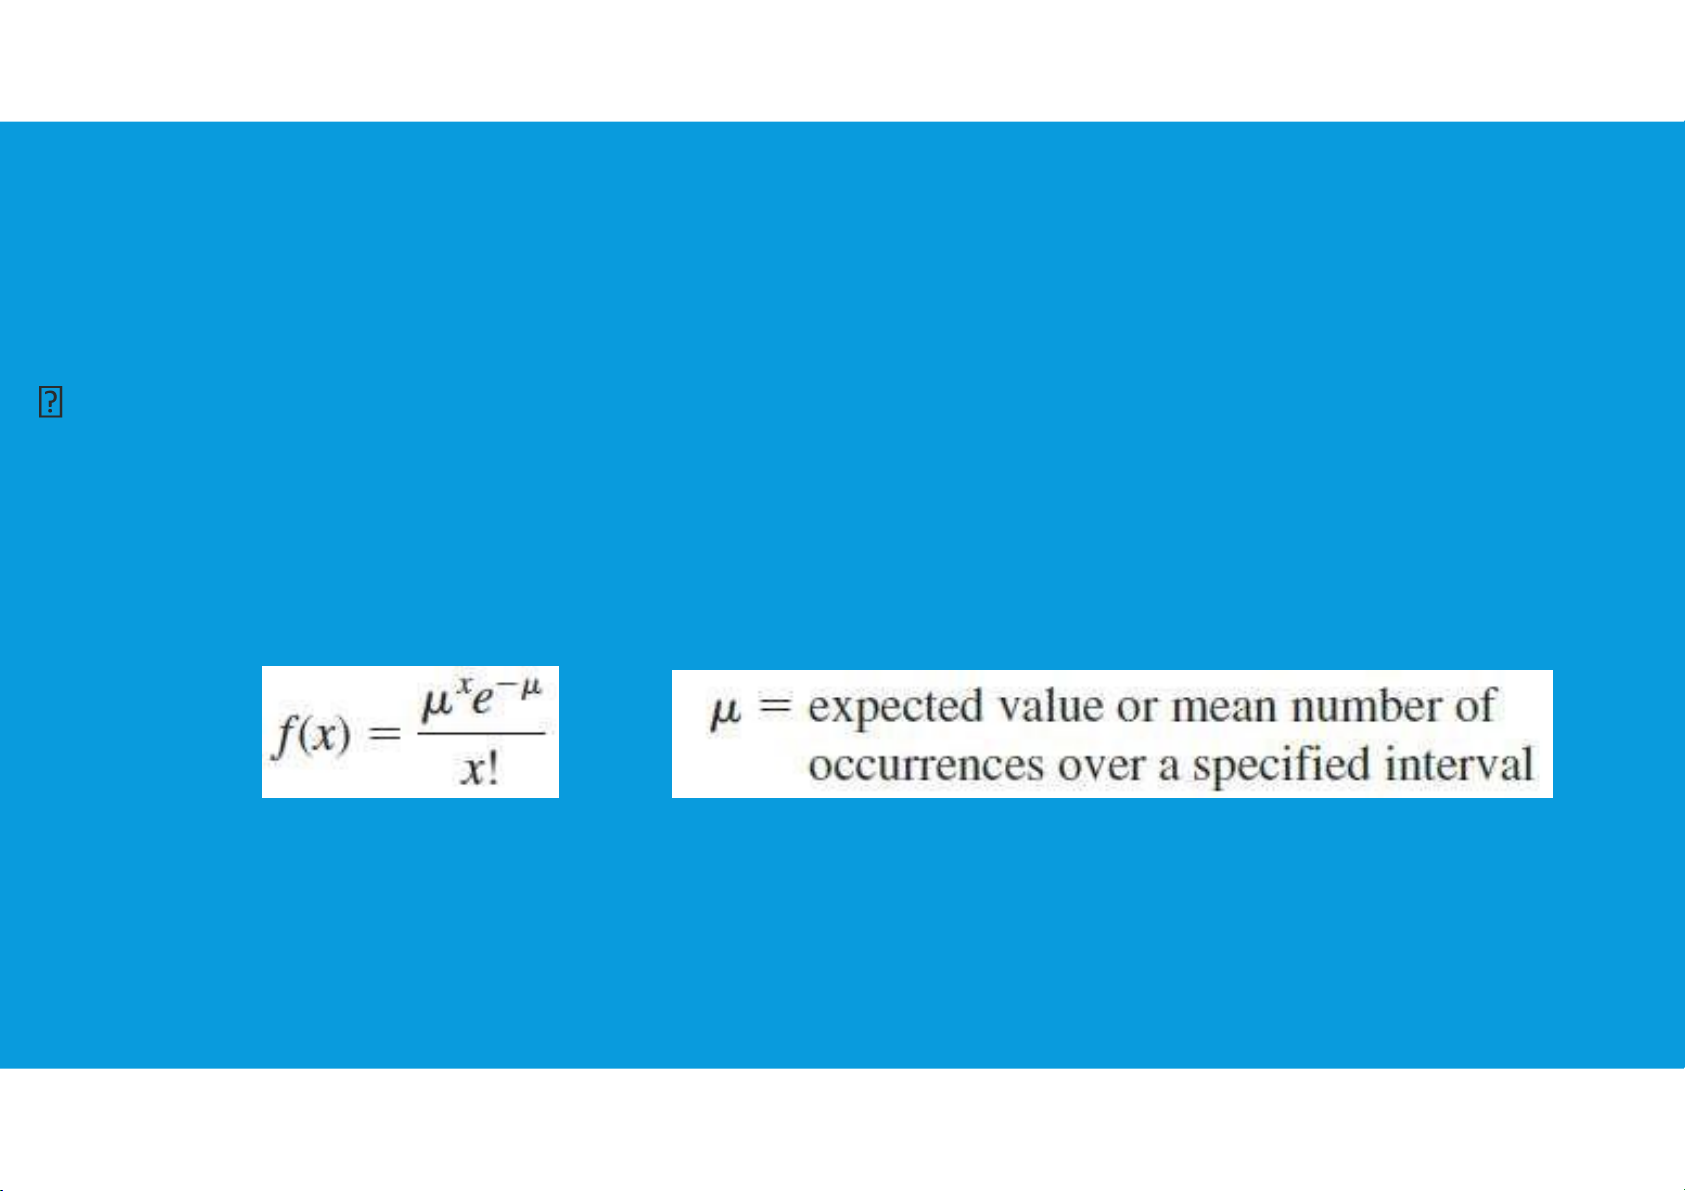
Relationship Between the Poisson and Exponential Distributions:
-Poisson distribution provides an appropriate description of the number of occurrences per interval
-Exponential distribution provides a description of the length of the interval between occurrences. tttu@hcmiu.edu.vn 31 lOMoARcPSD|364 906 32 End of file 2. Any questions? tttu@hcmiu.edu.vn 24
Document Outline
- APPLIED STATISTICS
- Chapter 4: Probability and Distribution
- •Normal probability distribution: characteristics
- Chapter 4: Probability and Distribution
Tài liệu liên quan:
-

Data and Statistics | Bài giảng số 1 chương 1 học phần Applied statistics | Trường Đại học Quốc tế, Đại học Quốc gia Thành phố Hồ Chí Minh
266 133 -

Data and Statistics | Bài giảng số 2 chương 1 học phần Applied statistics | Trường Đại học Quốc tế, Đại học Quốc gia Thành phố Hồ Chí Minh
360 180 -

Plotting and Smoothing data | Bài giảng số 3 chương 2 học phần Applied statistics | Trường Đại học Quốc tế, Đại học Quốc gia Thành phố Hồ Chí Minh
203 102 -

Descriptive statistics | Bài giảng số 4 chương 3 học phần Applied statistics | Trường Đại học Quốc tế, Đại học Quốc gia Thành phố Hồ Chí Minh
207 104 -

Descriptive statistics | Bài giảng số 5 chương 3 học phần Applied statistics | Trường Đại học Quốc tế, Đại học Quốc gia Thành phố Hồ Chí Minh
241 121