Lecture 8: Chapter 4: Probability and Distribution | Trường Đại học Quốc tế, Đại học Quốc gia Thành phố Hồ Chí Minh
4.4. SAMPLING AND SAMPLING DISTRIBUTIONS. The sampled population is the population from which the sample is drawn.The target population is the population we want to make inferences about. A frame is a list of the elements that the sample will be selected from. Tài liệu giúp bạn tham khảo, ôn tập và đạt kết quả cao. Mời bạn đọc đón xem!
Môn: Applied statistics (ENEE1006IU) 47 tài liệu
Trường: Trường Đại học Quốc tế, Đại học Quốc gia Thành phố Hồ Chí Minh 1.9 K tài liệu
Tác giả:


Preview text:
lOMoAR cPSD| 45903860 APPLIED STATISTICS COURSE CODE: ENEE1006IU Lecture 8:
Chapter 4: Probability and Distribution
(3 credits: 2 is for lecture, 1 is for lab-work) 1 lOMoAR cPSD| 45903860
4.4. SAMPLING AND SAMPLING DISTRIBUTIONS
•The sampled population is the population from which the sample is drawn.
•The target population is the population we want to make inferences about
•A frame is a list of the elements that the sample will be selected from. The sampling problems Selecting a sample Point estimation
Introduction to sampling distributions Sampling distribution of Sampling distribution of
Properties of point estimators Other sampling methods ) lOMoAR cPSD| 45903860
4.4. SAMPLING AND SAMPLING DISTRIBUTIONS
Numerical characteristics of a population are called parameters. Sampling problems: -Sampling errors
-Lack of sample representativeness
-Difficulty in estimation of sample size
-Lack of knowledge about the sampling process -Lack of resources -Lack of cooperation
-Lack of existing appropriate sampling frames for larger population lOMoAR cPSD| 45903860
4.4. SAMPLING AND SAMPLING DISTRIBUTIONS •Selecting a sample:
Sampling from a Finite Population: A simple random sample of size n from a
finite population of size N is a sample selected such that each possible sample of
size n has the same probability of being selected.
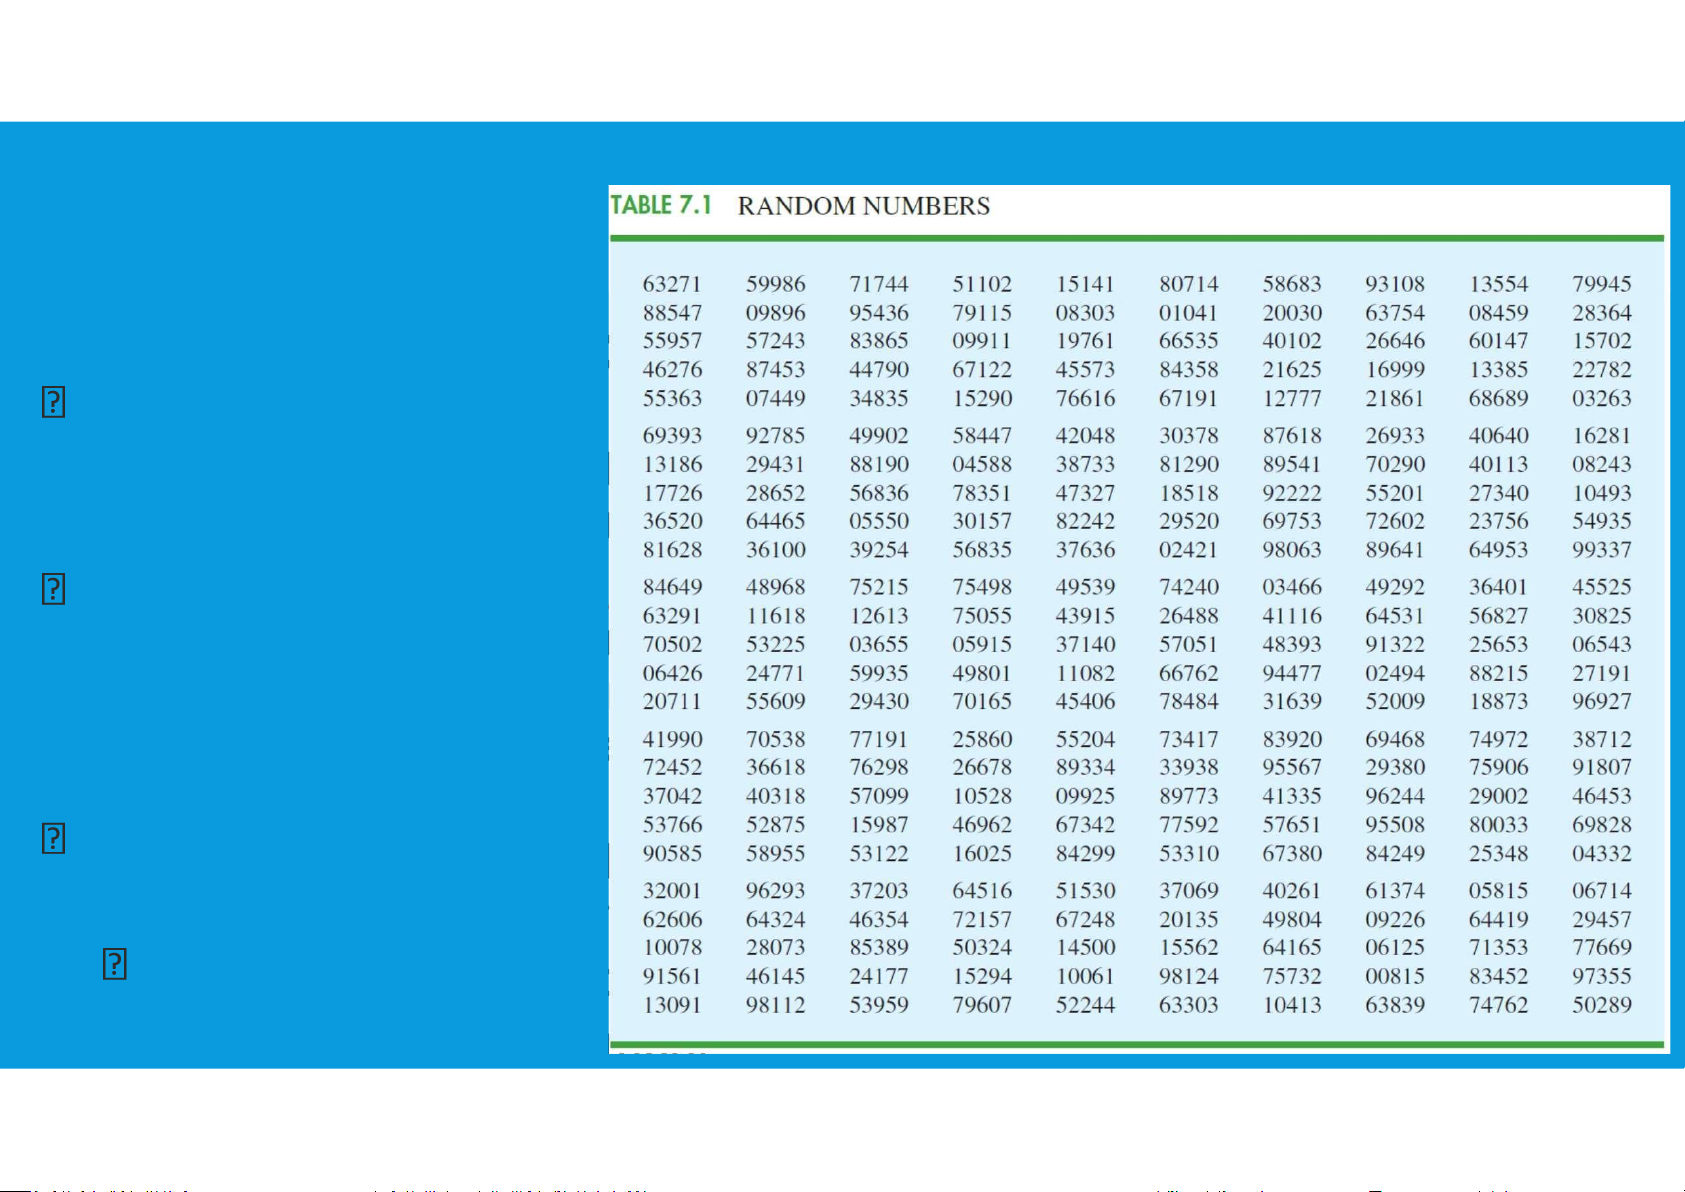
One procedure for selecting a simple random sample from a finite population is
to use a table of random numbers to choose the elements for the sample one at
a time in such a way that, at each step, each of the elements remaining in the
population has the same probability of being selected.
Sampling n elements in this way will satisfy the definition of a simple random
sample from a finite population. sampling without replacement sampling with replacement ) lOMoAR cPSD| 45903860
4.4. SAMPLING AND SAMPLING DISTRIBUTIONS
we cannot develop a list of all the elements that could •Selecting a sample:
be produced, the population is considered infinite
Sampling from an infinite Population: A random sample of size n from an
infinite population is a sample selected such that the following conditions are satisfied:
1. Each element selected comes from the same population.
2. Each element is selected independently.
Care and judgment must be exercised in implementing the selection process for
obtaining a random sample from an infinite population. prevent selection bias lOMoAR cPSD| 45903860
4.4. SAMPLING AND SAMPLING DISTRIBUTIONS •Point estimation:
To estimate the value of a population parameter, we compute a corresponding
characteristic of the sample, referred to as a sample statistic.
•By making the preceding computations, we perform the statistical procedure called point estimation. •We refer to:
- the sample mean as the point estimator of the population mean µ
- the sample standard deviation s as the point estimator of the population standard deviation , and
- the sample proportion as the point estimator of the population proportion p. The
numerical value obtained for , s, or is called the point estimate. tttu@hcmiu.edu.vn lOMoAR cPSD| 45903860
4.4. SAMPLING AND SAMPLING DISTRIBUTIONS
•Introduction to sampling distributions:
•If we consider the process of selecting a simple random sample as an experiment,
the sample mean is the numerical description of the outcome of the experiment.
the sample mean is a random variable
has a mean or expected value, a standard deviation, and a probability distribution.
•Because the various possible values of are the result of different simple random
samples, the probability distribution of is called the sampling distribution of .
•Knowledge of this sampling distribution and its properties will enable us to make
probability statements about how close the sample mean is to the population mean µ. lOMoAR cPSD| 45903860
4.4. SAMPLING AND SAMPLING DISTRIBUTIONS
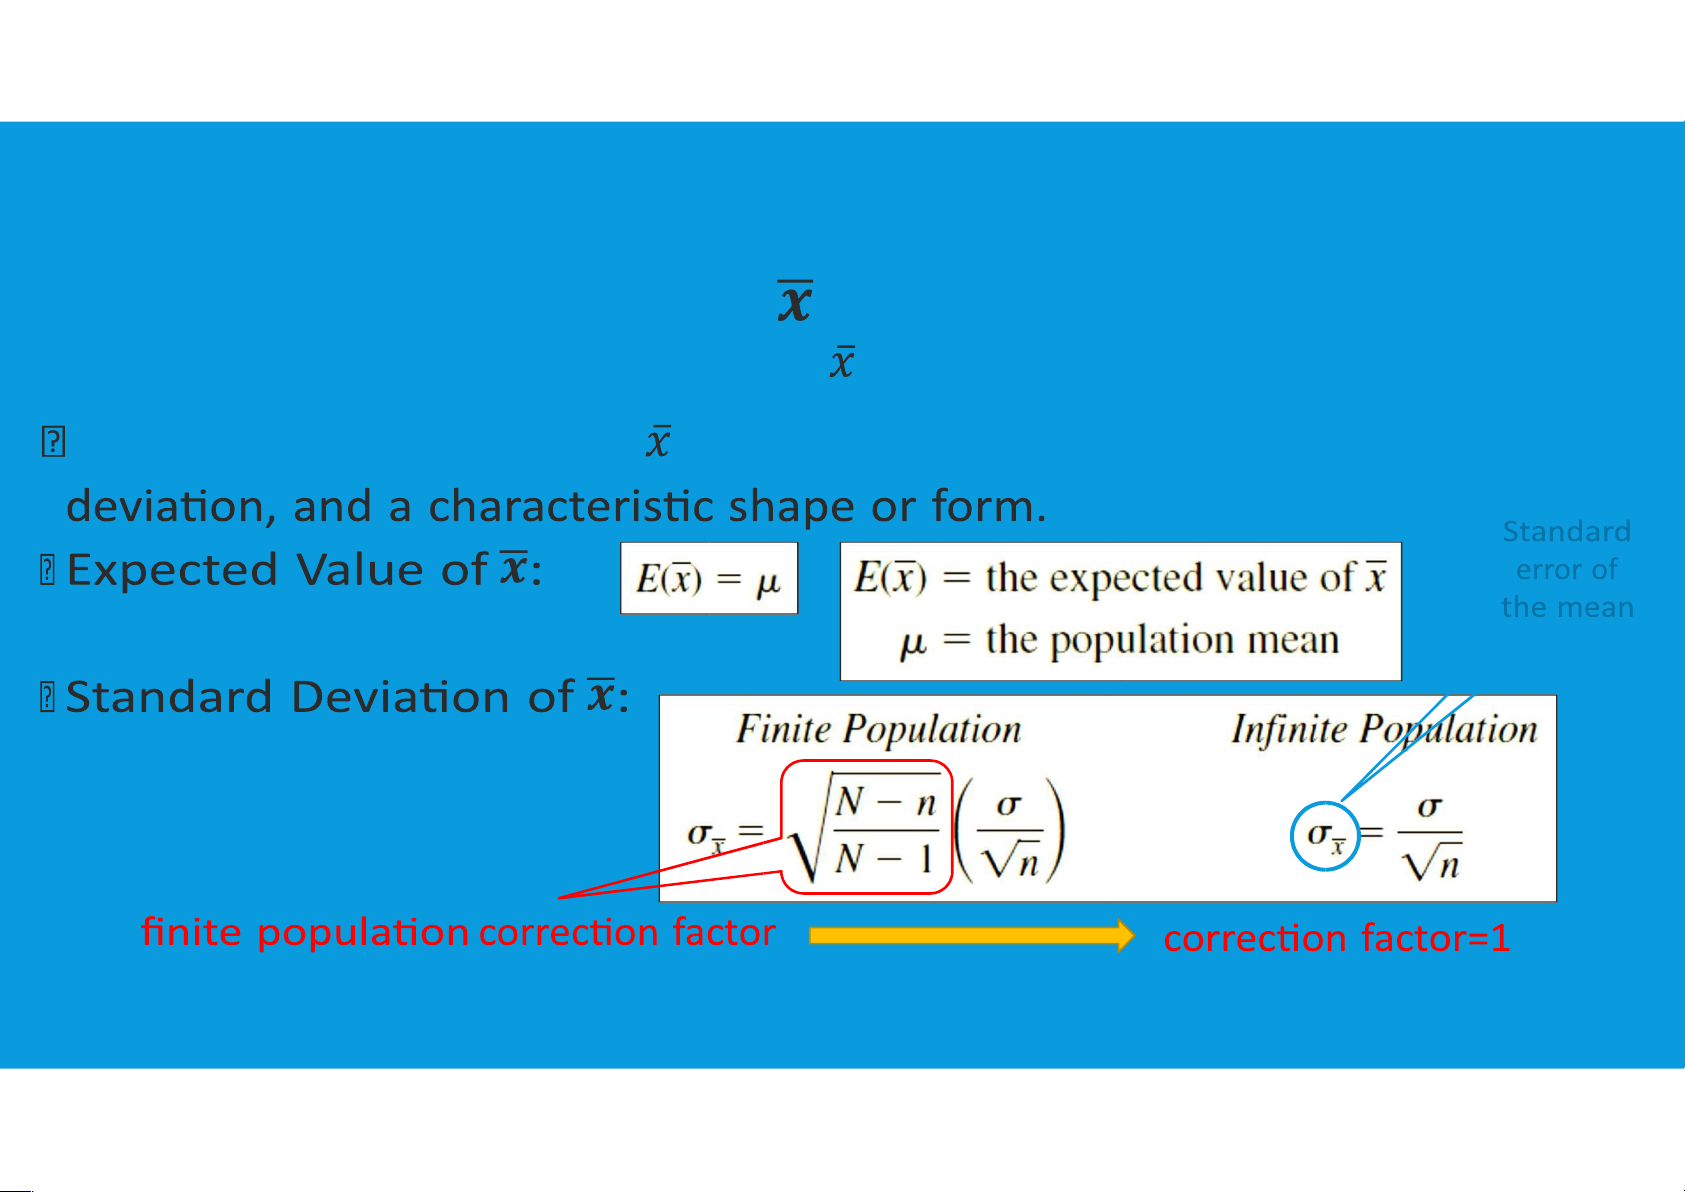
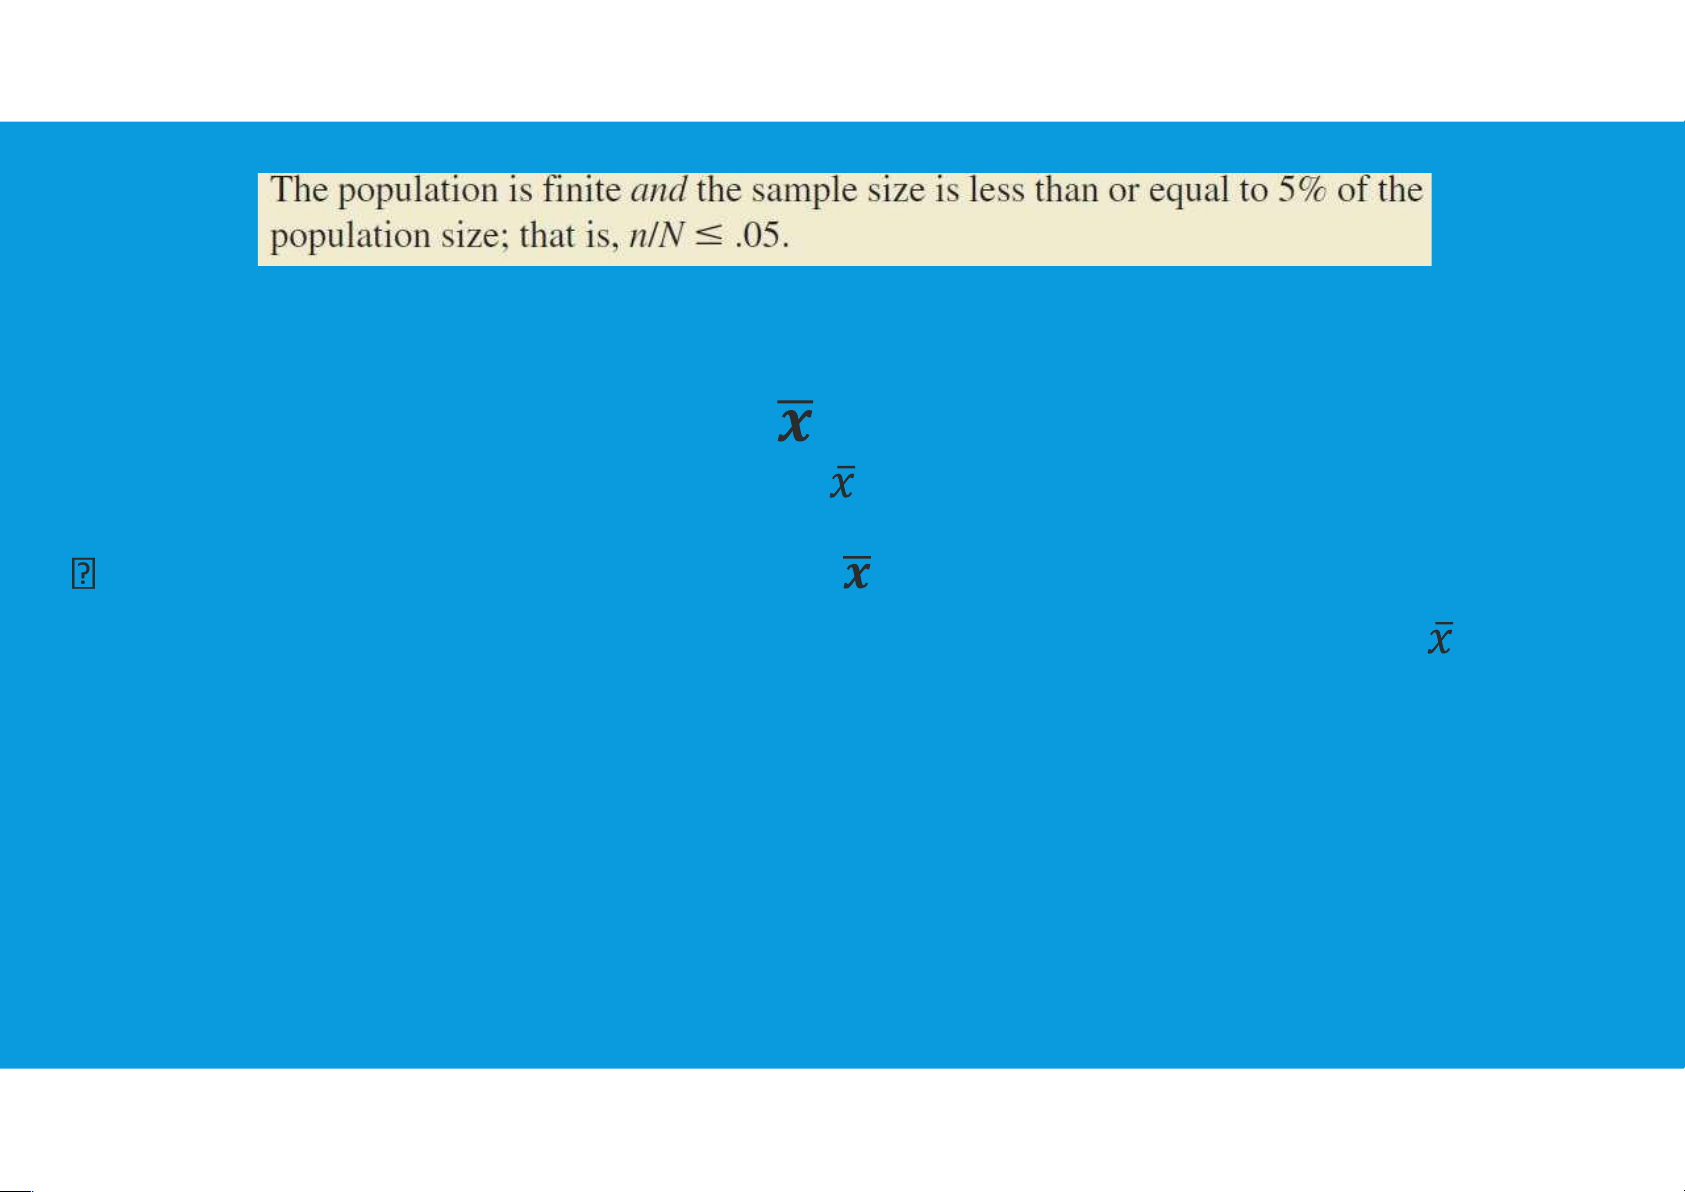
•Sampling distribution of : the probability distribution of all possible values of the sample mean .
The sampling distribution of has an expected value or mean, a standard
Infinite (population is large, some how can’t be identified) lOMoAR cPSD| 45903860
4.4. SAMPLING AND SAMPLING DISTRIBUTIONS
•Sampling distribution of : the probability distribution of all possible values of the sample mean .
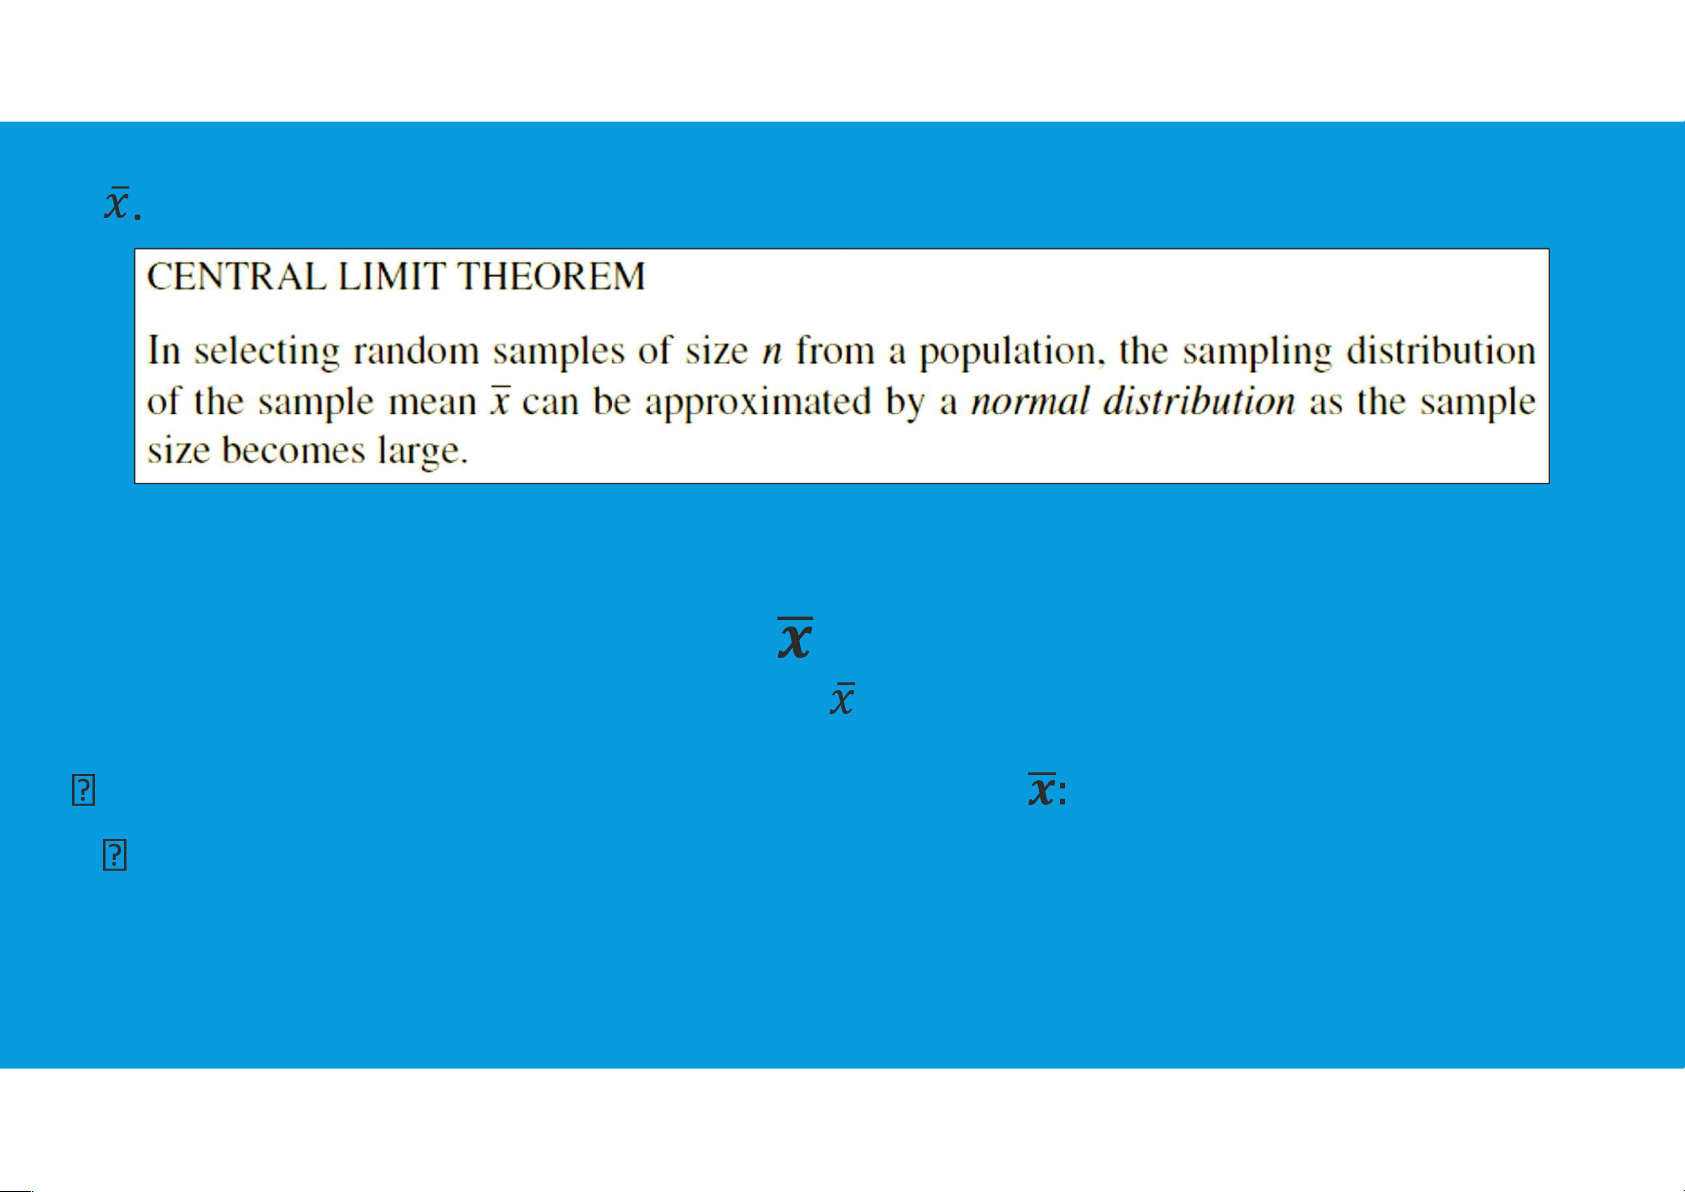
Form of the Sampling Distribution of :
-Population has a normal distribution: the sampling distribution of is normally
distributed for any sample size.
- Population does not have a normal distribution: central limit theorem is
helpful in identifying the shape of the sampling distribution of lOMoAR cPSD| 45903860
4.4. SAMPLING AND SAMPLING DISTRIBUTIONS
•Sampling distribution of : the probability distribution of all possible values of the sample mean .
Practical Value of the Sampling Distribution of
Whenever a simple random sample is selected and the value of the sample
mean is used to estimate the value of the population mean µ, we cannot
expect the sample mean to exactly equal the population mean. lOMoAR cPSD| 45903860
The practical reason we are interested in the sampling distribution of is that
it can be used to provide probability information about the difference
between the sample mean and the population mean.
4.4. SAMPLING AND SAMPLING DISTRIBUTIONS
•Sampling distribution of : the probability distribution of all possible values of the sample mean .
Relationship Between the Sample Size and the Sampling Distribution of
As the sample size is increased, the standard error of the mean decreases.
As a result, the larger sample size provides a higher probability that the sample
mean is within a specified distance of the population mean.
4.4. SAMPLING AND SAMPLING DISTRIBUTIONS lOMoAR cPSD| 45903860
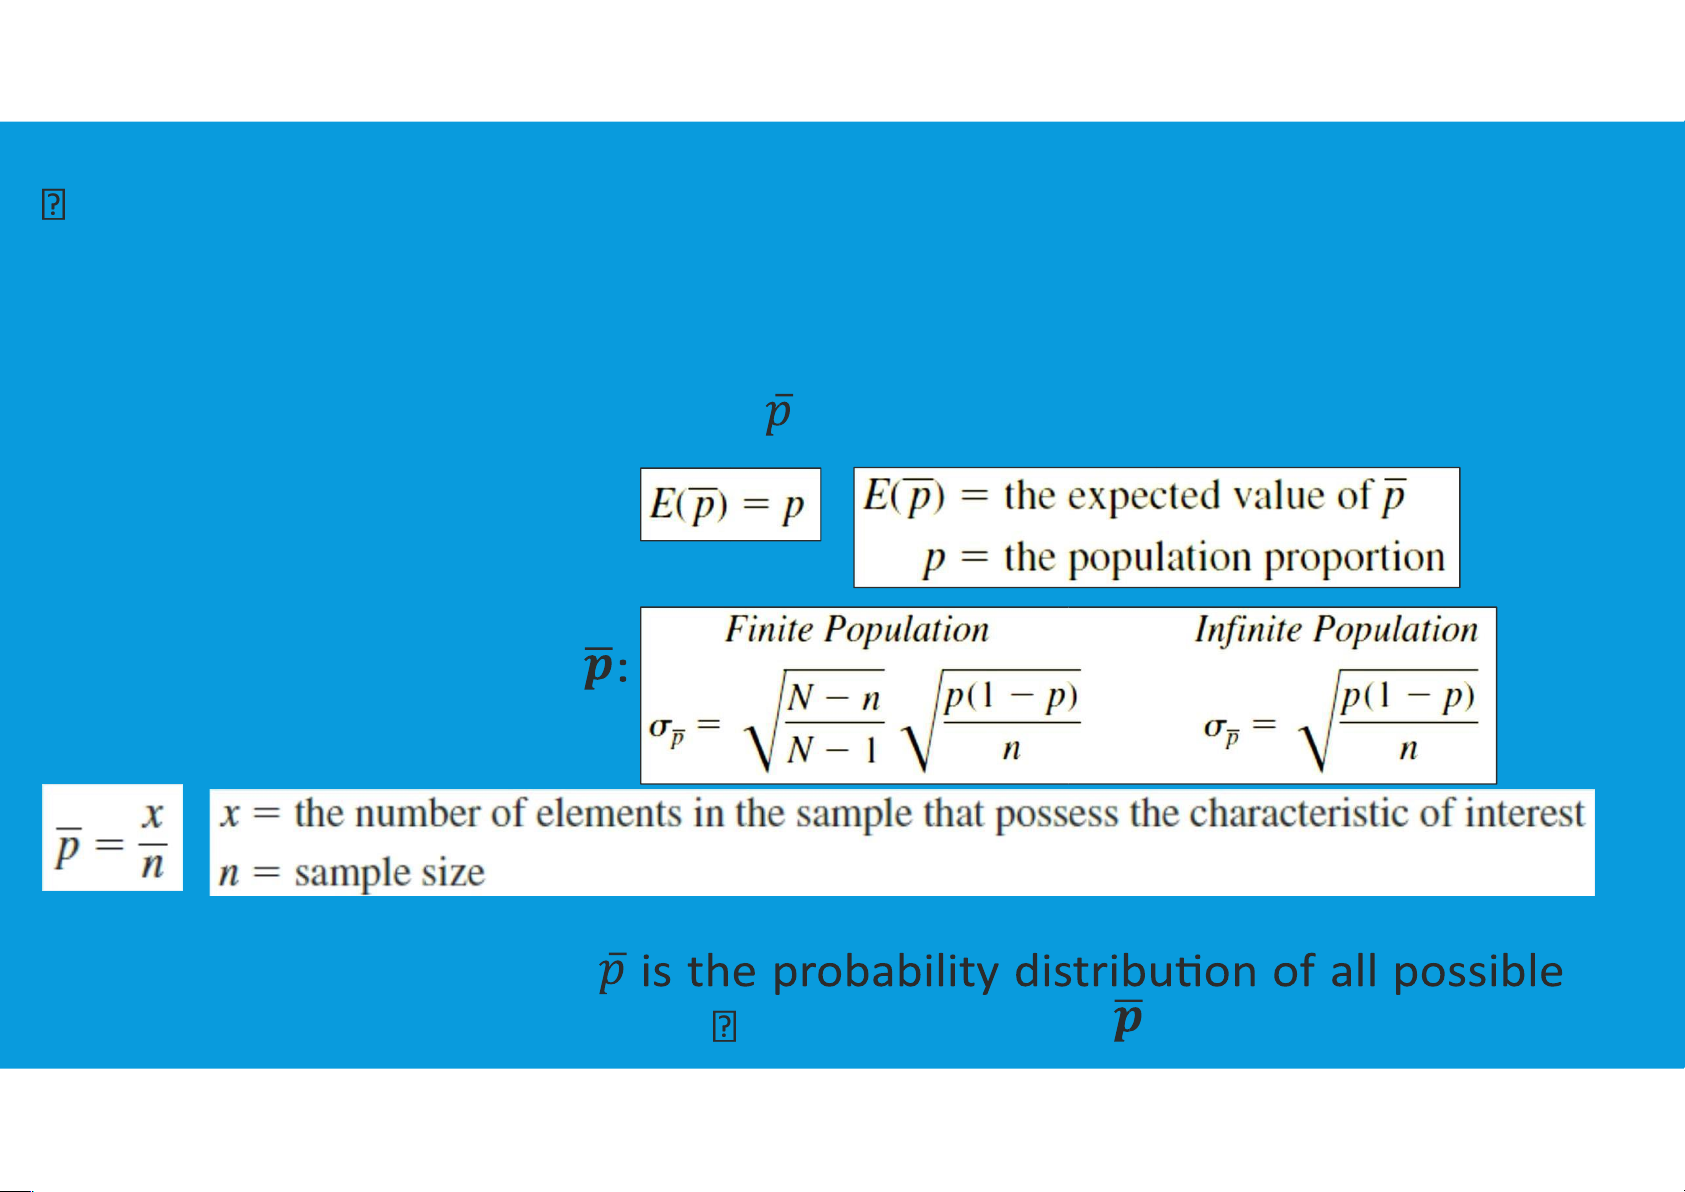
•Sampling distribution of point estimator of the population proportion p. lOMoAR cPSD| 45903860 The sampling distribution of
values of the sample proportion . Expected Value of : lOMoAR cPSD| 45903860 Standard Deviation of
4.4. SAMPLING AND SAMPLING DISTRIBUTIONS
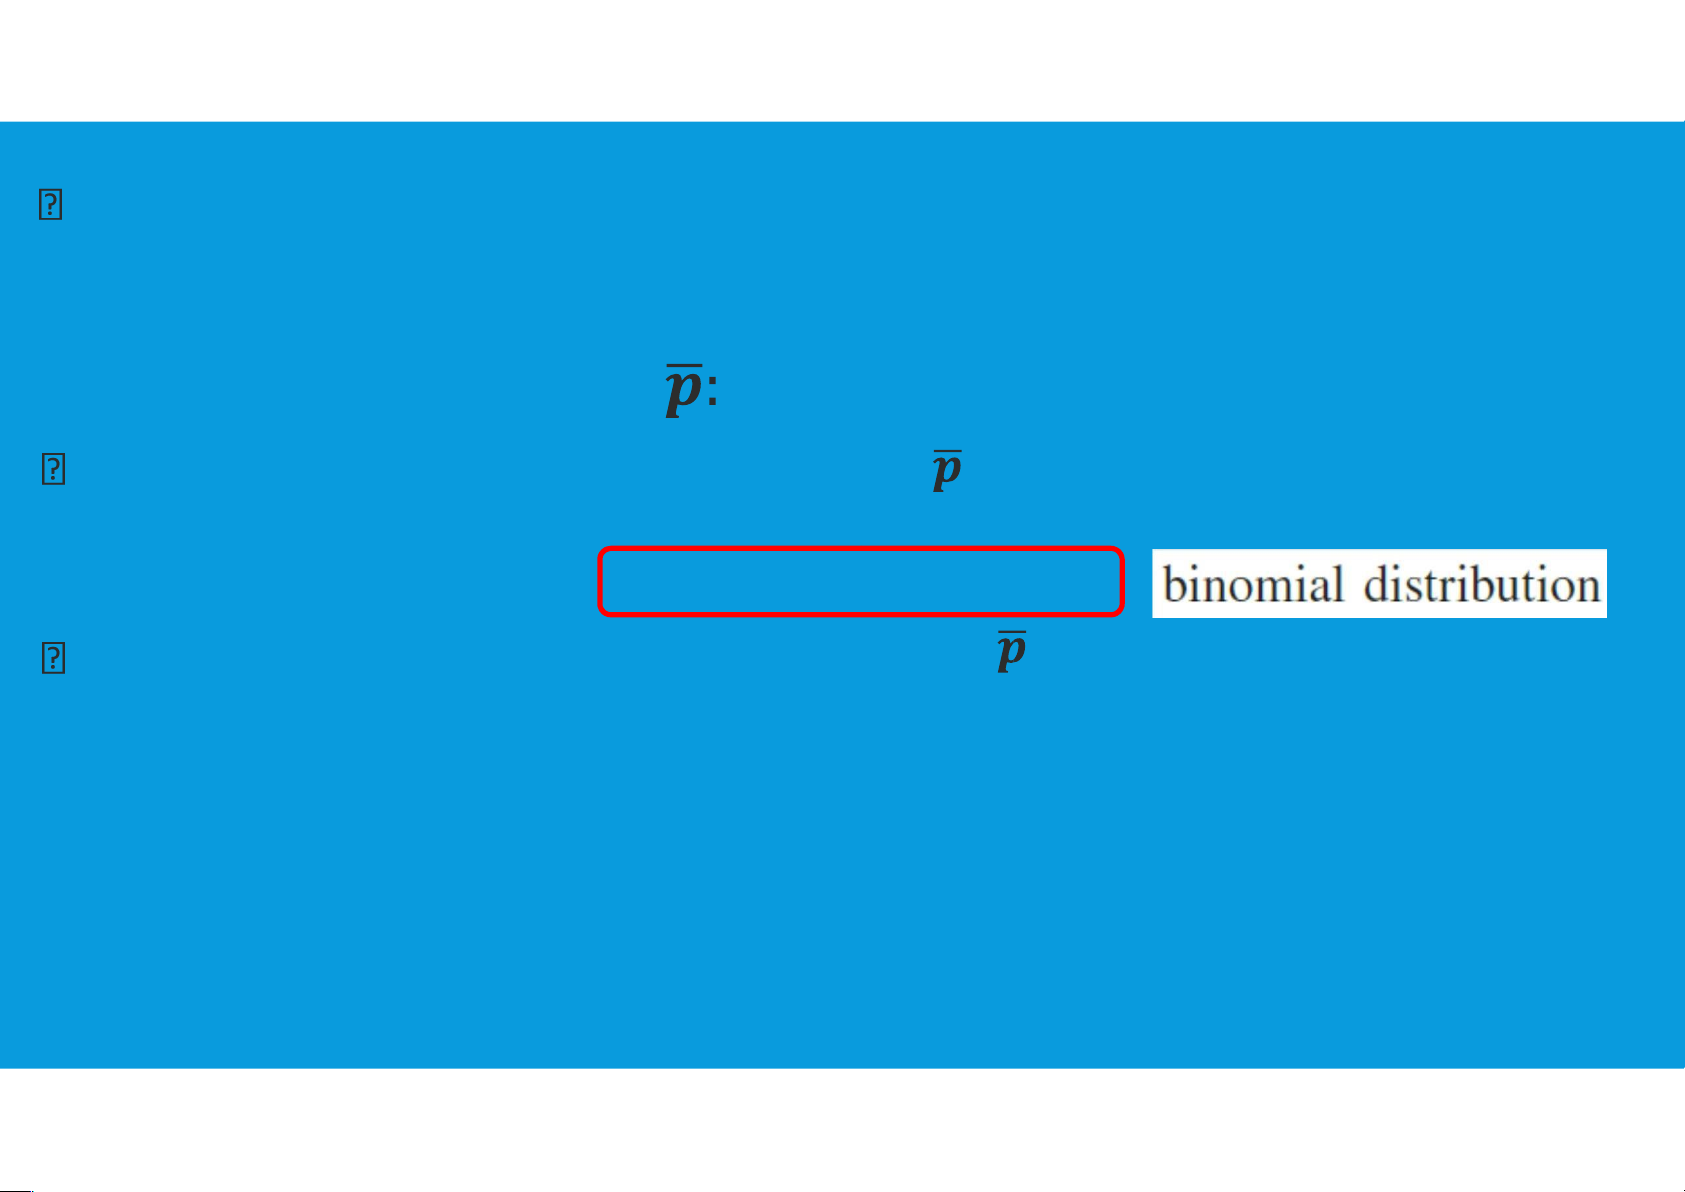
•Sampling distribution of point estimator of the population proportion p.
Form of the Sampling Distribution of : The sampling distribution of p can be
approximated by a normal distribution whenever: np ≥ 5 and n(1 − p) ≥ 5
Practical Value of the Sampling Distribution of : can be used to provide
probability information about the difference between the sample proportion and the population proportion. lOMoAR cPSD| 45903860
4.4. SAMPLING AND SAMPLING DISTRIBUTIONS
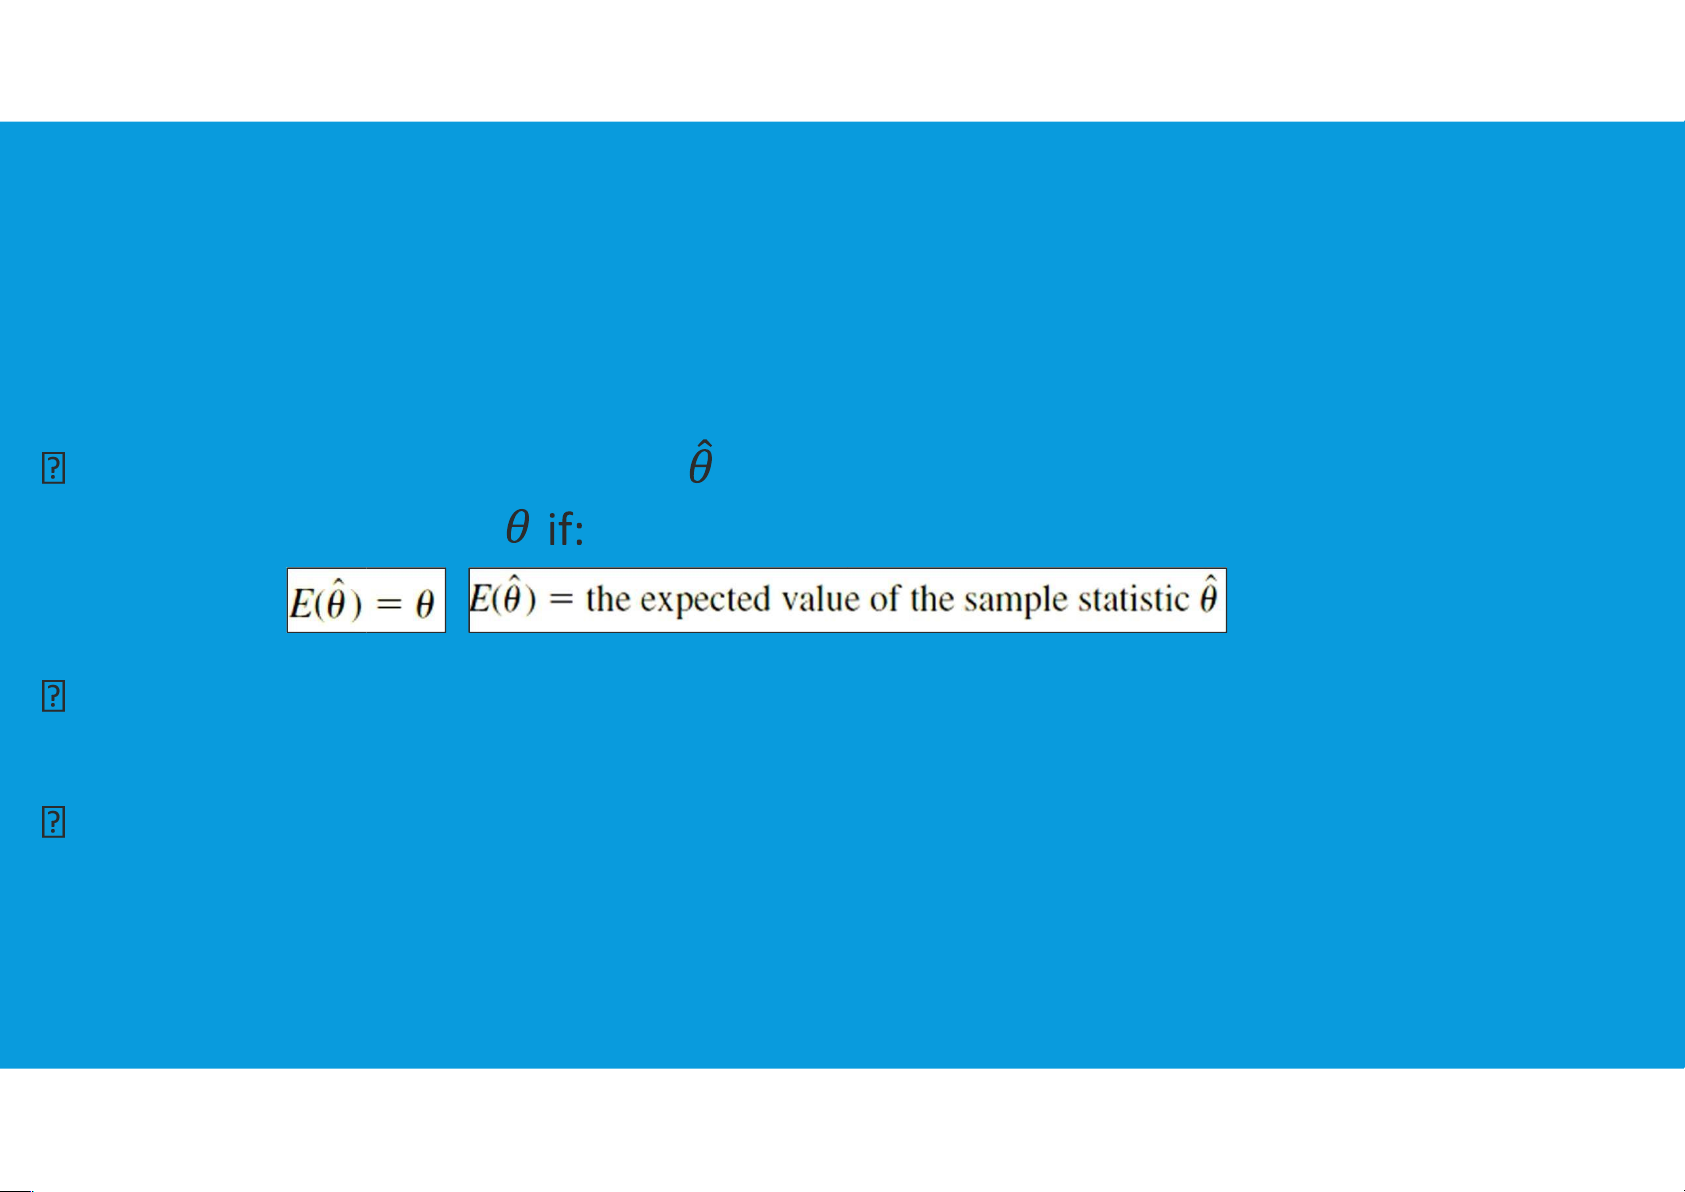
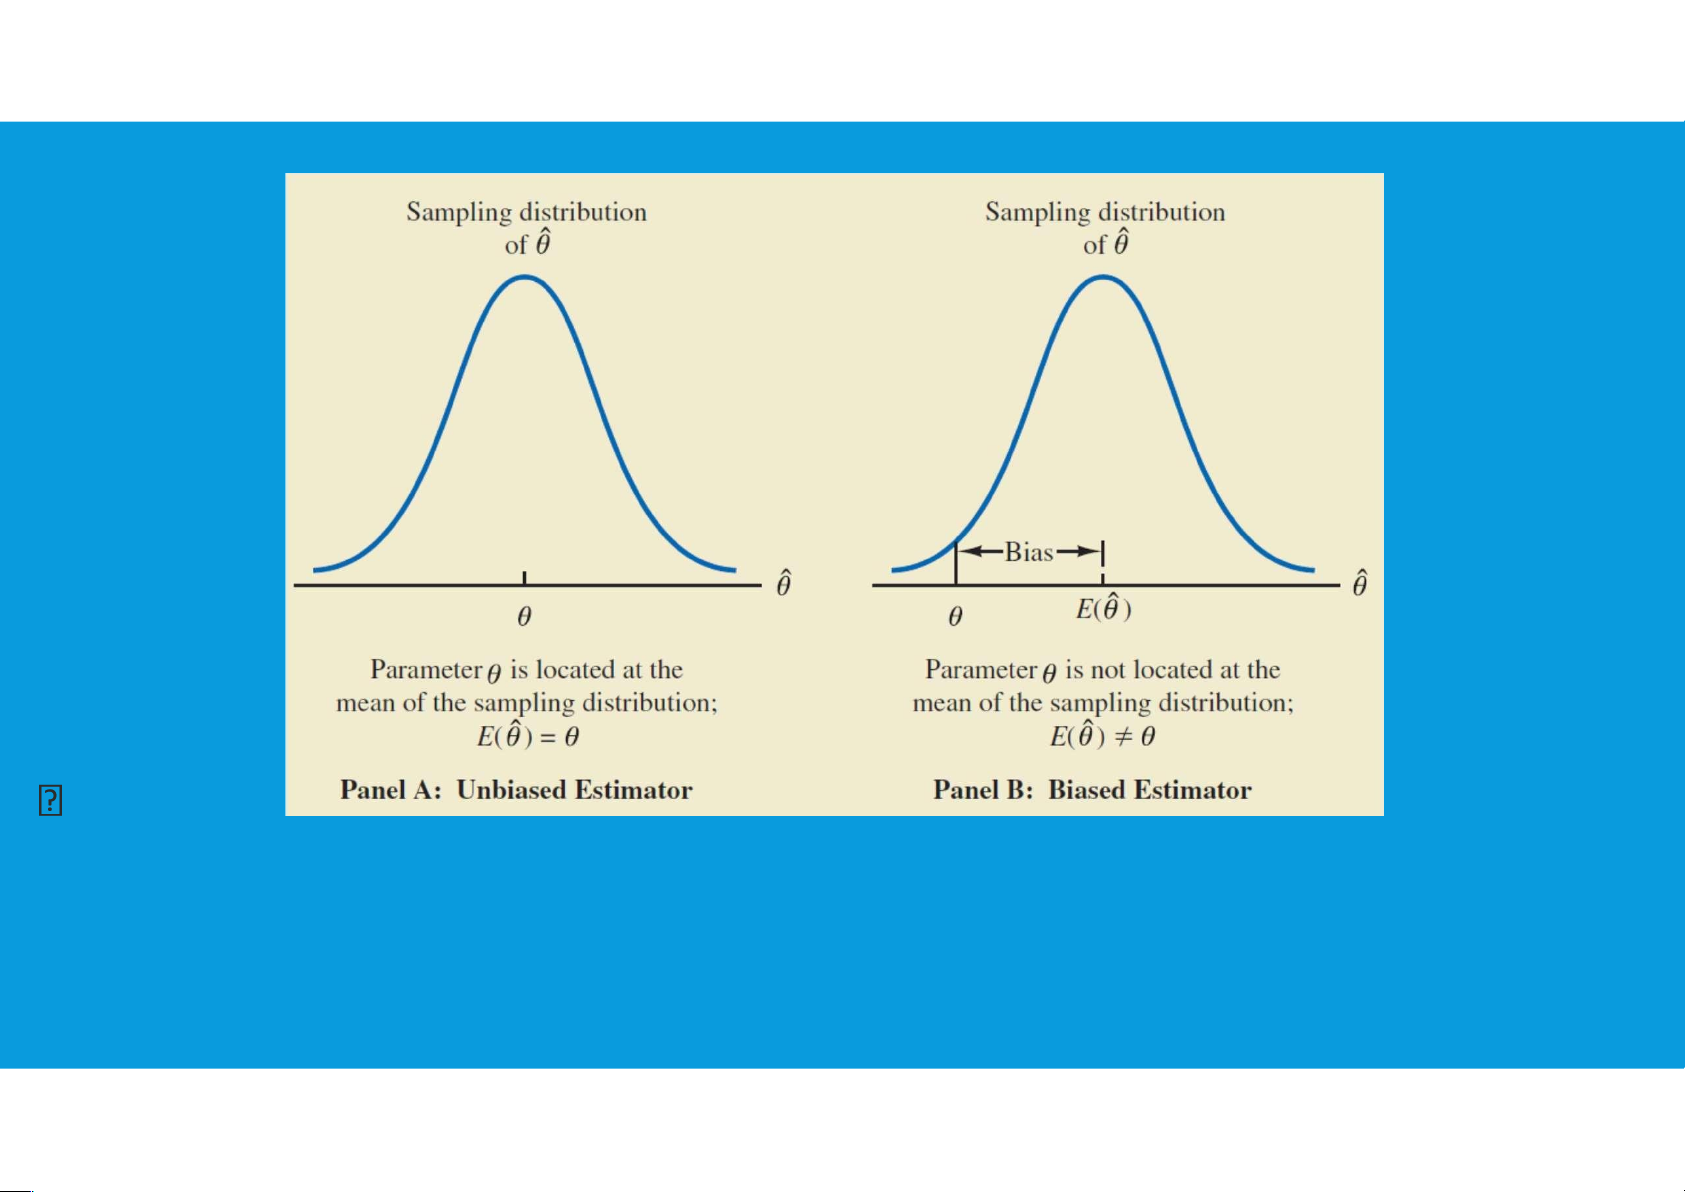
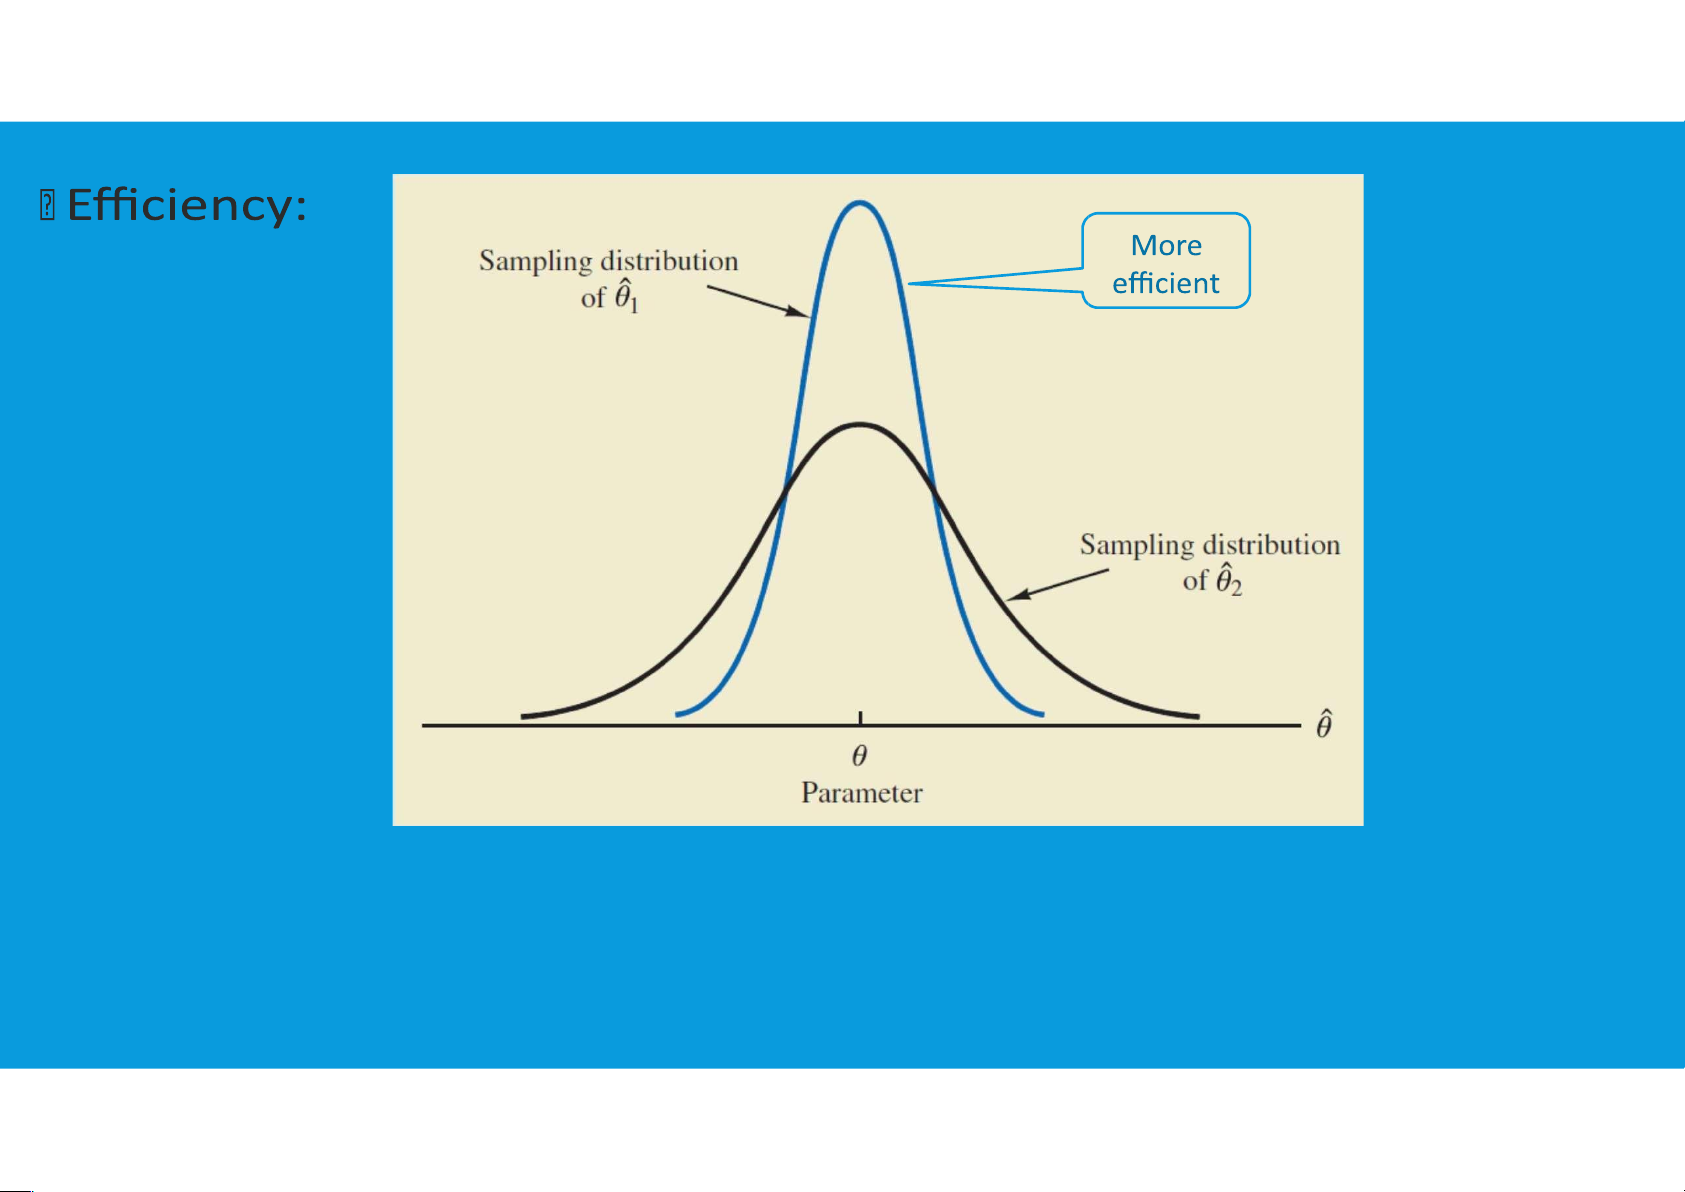
•Properties of point estimators: three properties of good point estimators:
unbiased, efficiency, and consistency.
Unbiased: The sample statistic is an unbiased estimator of the population parameter
Efficiency: The point estimator with the smaller standard error is said to have
greater relative efficiency than the other.
Consistency: point estimator is consistent if the values of the point estimator
tend to become closer to the population parameter as the sample size becomes
larger. In other words, a large sample size tends to provide a better point
estimate than a small sample size. lOMoAR cPSD| 45903860
4.4. SAMPLING AND SAMPLING DISTRIBUTIONS
•Properties of point estimators: three properties of good point estimators:
unbiased, efficiency, and consistency. lOMoAR cPSD| 45903860 Unbiased: lOMoAR cPSD| 45903860
4.4. SAMPLING AND SAMPLING DISTRIBUTIONS
•Properties of point estimators: three properties of good point estimators:
unbiased, efficiency, and consistency. lOMoAR cPSD| 45903860 lOMoAR cPSD| 45903860 End of file 1. Any questions? 17
Tài liệu liên quan:
-
Data and Statistics | Bài giảng số 1 chương 1 học phần Applied statistics | Trường Đại học Quốc tế, Đại học Quốc gia Thành phố Hồ Chí Minh
266 133 -
Data and Statistics | Bài giảng số 2 chương 1 học phần Applied statistics | Trường Đại học Quốc tế, Đại học Quốc gia Thành phố Hồ Chí Minh
361 181 -
Plotting and Smoothing data | Bài giảng số 3 chương 2 học phần Applied statistics | Trường Đại học Quốc tế, Đại học Quốc gia Thành phố Hồ Chí Minh
203 102 -

Descriptive statistics | Bài giảng số 4 chương 3 học phần Applied statistics | Trường Đại học Quốc tế, Đại học Quốc gia Thành phố Hồ Chí Minh
207 104 -

Descriptive statistics | Bài giảng số 5 chương 3 học phần Applied statistics | Trường Đại học Quốc tế, Đại học Quốc gia Thành phố Hồ Chí Minh
242 121