Nghiên cứu khoa học về hàng không vũ trụ môn Nghiên cứu khoa học | Trường Đại học Bách Khoa Hà Nội
In [1], authors developed probabilistic reliability models taking into account common-cause failure, human errors, and partially energized standby subsystems. Tài liệu được sưu tầm gồm 8 trang, giúp các bạn ôn luyện và phục vụ cho việc học tập, đạt kết quả tốt. Mời các bạn đón xem!
Môn: Ngiên cứu khoa học 12 tài liệu
Trường: Đại học Bách Khoa Hà Nội 5.6 K tài liệu
Tác giả:


Preview text:
Operational reliability assessment of an aircraft environmental control system K. Jenab , K. Rashidi
Department of Mechanical and Industrial Engineering, Ryerson University, Toronto, Ontario, Canada M5B 2K3 a r t i c l e i n f o a b s t r a c t Article history:
The aircraft environmental control system (ECS) is composed of several non-identical and nondedicated subsystems working Received 29 August 2007
as warm–cold standby subsystems. Also, their state transition times are arbitrary distributed. This paper presents a flow-graph- Received in revised form
based method to calculate time-to-failure data and failure probability of the ECS. The obtained data from the model may be 14 February 2008
used for maintenance optimization that employs the failure limit strategy for ECS. The model incorporates detectable failures Accepted 9 May 2008 Available
such as hardware failures, critical human errors, common-cause failures, maintenance categories, and switch activation online 17 May 2008
methods. A numerical example is also presented to demonstrate the application of the model.
& 2008 Elsevier Ltd. All rights reserved. Keywords:
Hybrid warm–cold standby system Human errors Flow-graph Maintenance optimization 1. Introduction
human error failures were studied. In [11], assuming imperfect repair, an
In [1], authors developed probabilistic reliability models taking into
optimal geometric model for a cold standby repairable system with only two
account common-cause failure, human errors, and partially energized standby
identical units was developed. In [12], a system composed of m operating
subsystems. In [2], Using Markovian method, author developed formula for
units, w warm standby units and R repairmen was studied. In [13], using
the availability of the standby system composed of identical units that are reliability techniques, a
preventively maintained. In [3], authors developed a closed-form equation for
statistical method was proposed for preventive maintenance of a standby
a k-out-of-n warm standby system with dormant failure. In [4], authors
relays in power system. In [14], authors developed imprecise reliability models
presented a human errors analysis model with arbitrarily distributed repair
of a cold standby system because of unavailability of precise probability
times for a system composed of two working units and one standby unit. In
distribution of the unit times to failure. In [15], considering a minimal repair
[5], using exact distribution of the sum of two independent beta variables, the
with negligible repair time, a standby system lifetime was studied. In [16], a
reliability of the standby system composed of units with beta-distributed
warm standby system composed of units with different failure and repair rates
lifetime was calculated. In [6], a two-unit standby system was investigated
was studied. In [17], a cold standby system made up of non-repairable units
wherein the standby unit is put in cold state for a certain amount of time
with Erlang distribution lifetimes was investigated. Table 1 classifies the
before it is allowed to become warm. In [7], using Markovian model, authors
published literature dealt with standby systems subject to human errors,
analyzed a standby system made up of n units in parallel start operating and
common cause (CC), and hardware failures (HFs). This classification shows that
remaining m units are in standby mode. In [8], considering the constant failure
the published papers overlooked a warm–cold standby system defined as
rate, the availability of a standby system with n+1 identical units and one
hybrid standby system with arbitrary failure distributions. Therefore, the aim
standby unit was studied. In [9], several measures of reliability for a two-unit
of this study is to investigate such a standby system, and calculate time-to-
warm standby system with slow switch considering hardware and human error
failure data and the system failure probability by using a flow-graph-based
failures were assessed by Markovian method. In [10], using the regenerative
method. The results are required for maintenance optimization employing the
point technique in Markov renewal processes, the reliability measures for a
failure limit strategy [18]. 2. Problem description
two-unit warm standby system with a slow switch subject to hardware and
Corresponding author. Tel.: +1416 979 5000x6424; fax: +1416 979 5265. E-mail
address: jenab@ryerson.ca (K. Jenab).
0951-8320/$ - see front matter & 2008 Elsevier Ltd. All rights reserved.
doi:10.1016/j.ress.2008.05.003
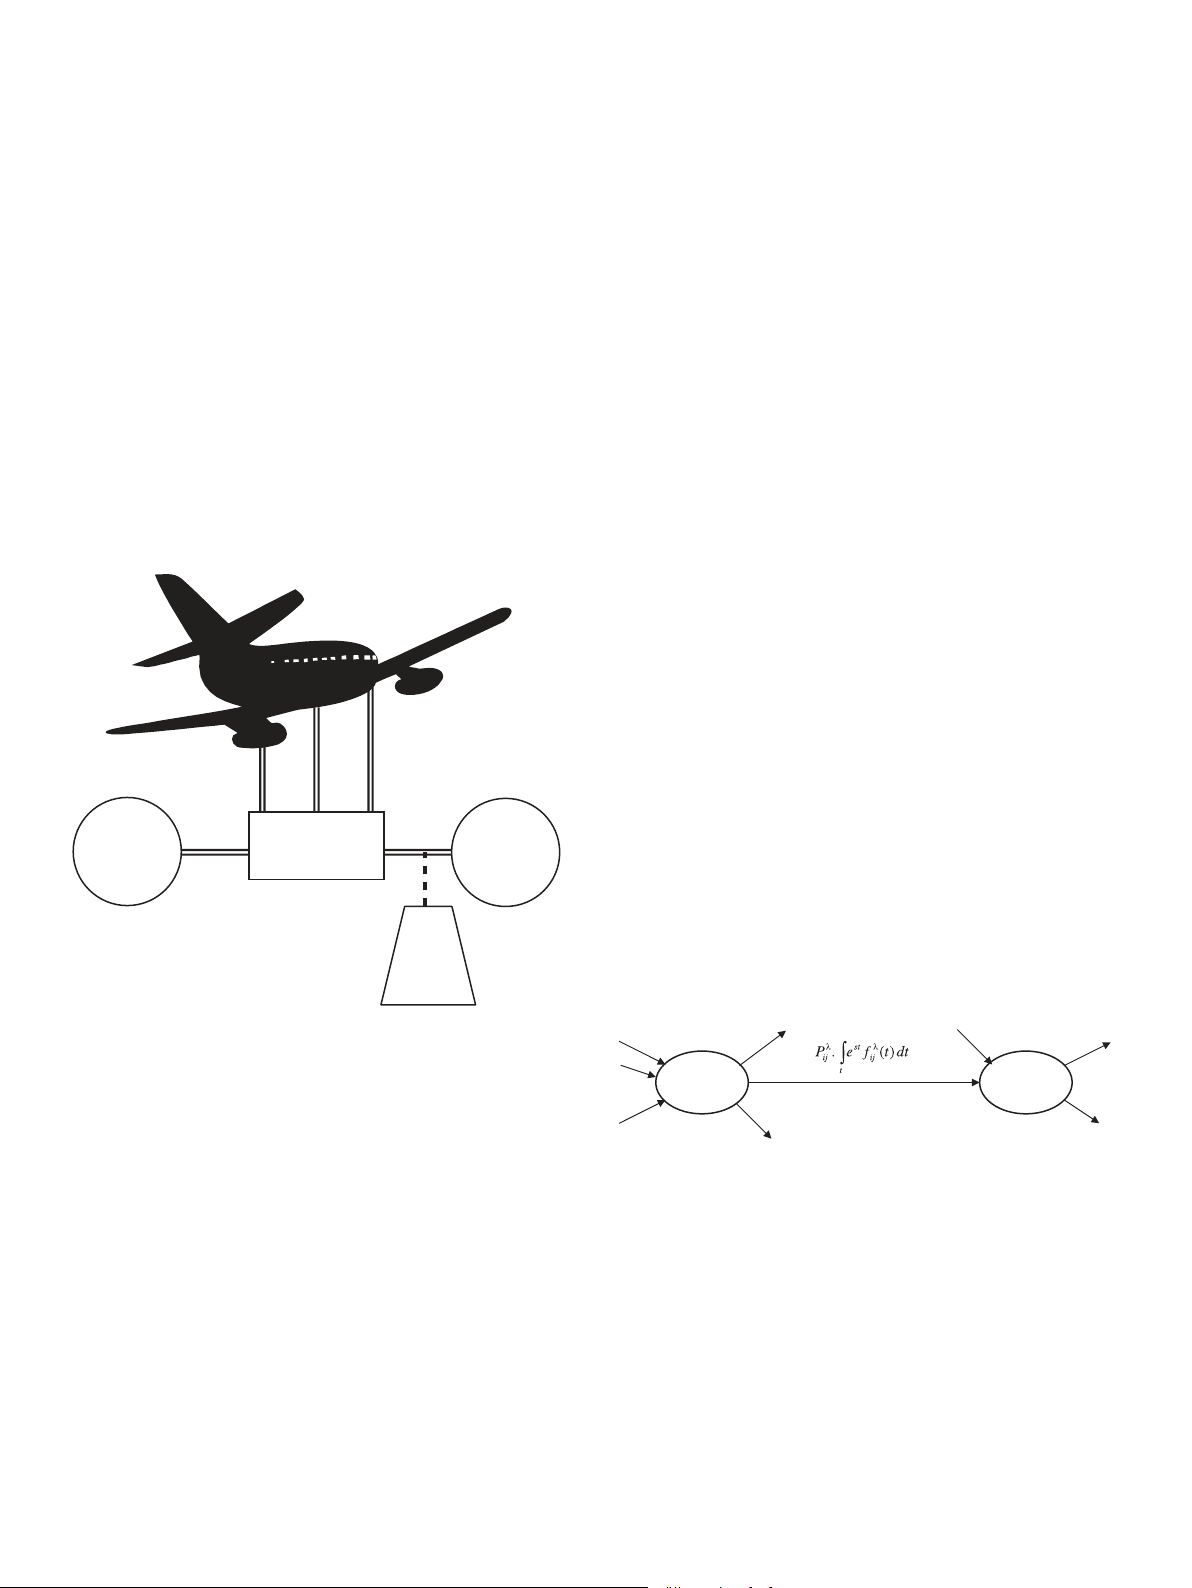
One of the major functions of the aircraft environmental
control system (ECS) is to maintain the temperature of the cabin at passenger
comfort level. This hybrid standby system is made up Table 1
Classification of published literature on standby systems Failure distribution Ref. Model Configuration of standby With human errors Exponential [1] Markov Exponential [4] Cold Markov Exponential [7] Warm Markov Exponential [9] Warm Mathematical expansion Exponential [10] Warm Mathematical expansion Without human errors Exponential [2] Cold Markov/simulation Exponential [3] Warm Mathematical expansion Beta [5] Cold Mathematical expansion Exponential [6] Hot/warm/cold Mathematical expansion Exponential [8] Cold Markov Exponential [11] Mathematical expansion Exponential [12] Warm Mathematical expansion Exponential [13] Cold Mathematical expansion Exponential [14] Cold Mathematical expansion Weibull [15] Cold Simulation Exponential [16] Warm Markov Erlang [17] Cold Mathematical expansion
of two dedicated cooling packs, and a non-dedicated RAM air as shown in
instructed to switch manually to RAM air in accordance with the aircraft flight
Fig. 1. The non-dedicated subsystem can be manually activated only in the
manual. This stage is a cold standby with slow switch subject to hardware
certain flight altitude by the flight crew. In the normal operation, both
and crew error failures. The crew errors may result from poor control panel
cooling packs are automatically operating. In case of one pack failure, the
design, poor work environment, poor task assignment, inadequate training,
remaining pack will automatically take over the load and an appropriate
poorly written flight manual, operating procedures, and deficiency of master
message will be posted on the crew alert system display (CAS) in the aircraft
minimum equipment list. Therefore, the required maintenance activities cockpit.
performed by the flight crews during the flight (Category I) or by
The system state would be reversible if the cooling pack fails due to
maintenance crews in the bases (Category II) may be associated with human
overheat. Up to this stage, we have the two-unit warm standby system with errors.
automatic switch subject to HFs. In case of both packs failure, crews are
To calculate time-to-failure data and the failure probability of such a
Category I maintenance task can be performed by the flight crews.
system, we define a warm–cold standby system (hybrid) with related terms
Category II maintenance task requires maintenance crews in site.
and conditions in the remaining part of this section. The warm–cold standby
Common-cause and HF rates are arbitrarily distributed and statistically
system comprises of several nonidentical and non-dedicated subsystems, independent.
which are independently functioning; however, they can be manually or
Human errors, common-cause, and HFs occur independently.
automatically activated subject to The repair time of the failed subsystems are arbitrarily distributed. (1) manual override option,
The failed system repair times are arbitrarily distributed.
(2) subsystem availability if it is non-dedicated, and
A common-cause failure or a human error can occur and trigger the system
(3) meeting certain flight operational requirements such as flight altitude.
failure from any of its operable states.
Repair is unrestricted for subsystems and system.
The repaired subsystem or system is as good as new.
The dedicated subsystems work in a warm standby configuration with
Switchover mechanism is automatic in warm standby and is manual in cold
automatic switch activation. On the other hand, the nondedicated standby configuration.
subsystems work in cold standby configuration with manual activation in
Self-loops in flow-graph that represent the corresponding subsystem are
accordance with the flight manual. As a maintenance point of view, the
properly working are s-independent [19].
subsystems may be repaired during the flight by the flight crews or at the
base by the maintenance crews based on maintenance procedures. The
maintenance task may be subjected to critical human errors (CHEs) resulting 2.1. Notation
from poor design, poor work environment, poor t
transition time due to failures (i.e., hardware, human error, common cause) ECS environmental control system CAS crew alert system CC common cause CHE
critical human errors in operation or maintenance HW
hardware failure including subsystem and switch ‘ link index i.e., CC, CHE, HW Pij‘
probability of transition from node i to node j in link ‘ Pstd
failure probability of the hybrid standby system Avij‘
availability of non-dedicated subsystem for switchover in transition ij and link ‘ MTTF
mean time to failure of the hybrid standby system ECS Control Cooling Cooling STTF
standard deviation of time to failure of the hybrid standby system System pack 2 pack 1 fij‘(t)
time distribution function for transition from state i to state j with index ‘ rij‘(t)
time distribution function for switch activation in transition from Dedicated connection RAM
state i to state j with index ‘ Non-dedicated Connection Air Wij
equivalent transition from state i to state j Wstd equivalent transition of the hybrid standby system model
Fig. 1. Environmental control system block diagram.
task assignment, inadequate training, poorly written manuals, operating S i S j
procedures, and maintenance procedures. Also, there exist CC failures that may Transition Description
be caused by a common design or material deficiency, a common installation
error, a common maintenance error, or a common harsh environment. This type Lm
the mth first-order loop in the model t total
of failure leads to total system failure. Third type of failure is HF (i.e., subsystem
number of disjoint loops in the model
failure and switch failure) that can be classified to detectable and non-
detectable HFs. Occurrence of the detectable failure will be announced by
warning, caution, or advisory message to the CAS display in the aircraft cockpit 3. Model description
for taking appropriate action in accordance with the flight and maintenance
manuals. In fact, the occurrence of the non-detectable failure will remain
The analytical model is based on the flow-graph concept presented in
dormant until next maintenance inspection.
Appendix A. The flow graph is made up of several nodes corresponding to
To develop an analytical model for computing time-to-failure data and
the states of the warm–cold standby ECS system and of links corresponding
failure probability of such a system, the following assumptions are taken into
to transitions among states. The link represented by an arrow is associated account:
with transition probability, transition time distribution, switch type
(automatic, manual), switch activation requirements (availability,
Dedicated subsystems only serve the warm–cold standby system.
operational procedure), and transition description. Fig. 2 presents a state
Non-dedicated subsystems may serve the warm–cold standby system subject
transition without a switch type and the switch activation requirements used
to availability and meeting the operational requirements.
for the CC failure and maintenance links. In case of more than one link
between two states, we use the index ‘ to differentiate them where the sum
of the probabilities for outgoing links is equal to one. The link description
The first-order loop (i.e., Lm) is composed of only one loop and the
indicates either the type of failures (‘CC’, critical human errors in flight or
second-order loop (i.e., Lm Ln) is composed of the product of two disjointed
maintenance ‘CHE’, ‘HW’) or categories of maintenance activities (Category
loops m and n. These disjointed loops m and n have no intersection in their
I, Category II). Category I is a simple maintenance procedure that may be
nodes and links. Similarly, the tth-order loop can be defined as a product of
performed by the flight crews. However, if a maintenance activity requires
t disjoint loops. The probability of failure of the system is
special tools and skills, this activity falls into Category II, which can be
performed by the maintenance crews in the base.
Pstd ¼ Wstdjs¼0
(2) and mean time to failure of the system can be
To calculate the time-to-failure data and the probability of the warm–cold
obtained from the below expression:
standby ECS system failure, the equivalent transition (W) of the system can
be derived from the topology equation [1]: 1 qWstd t t t t t t MTTF ¼ (3)
1 X Lm þ X Xman Lm Ln X mXanap X Lm Ln Lp þ ¼ 0 (1) m¼1 m¼1 n¼1 m¼1 n¼1 p¼1 P q std s s¼0
Also, standard deviation time to failure is defined by
where t is total number of disjoint loops in the ECS flow-graph model.
Fig. 2. Flow-graph model for a state transition without switch type and activation requirements. 1 W STTF ¼
uuvtffiffiffiffiffiffiffiffiffiffiffiffiffiffiffiffiffiffiffiffiffiffiffiffiffiffiffiffiffiffiffiffiffiffiffiffif
fiffiffiffiffiffiffiffiffiffiffiffiffiffiffiffiffistd q2q std 2 ½MTTF2ffi (4) P s s¼0
A developed model for the warm–cold standby ECS system may be
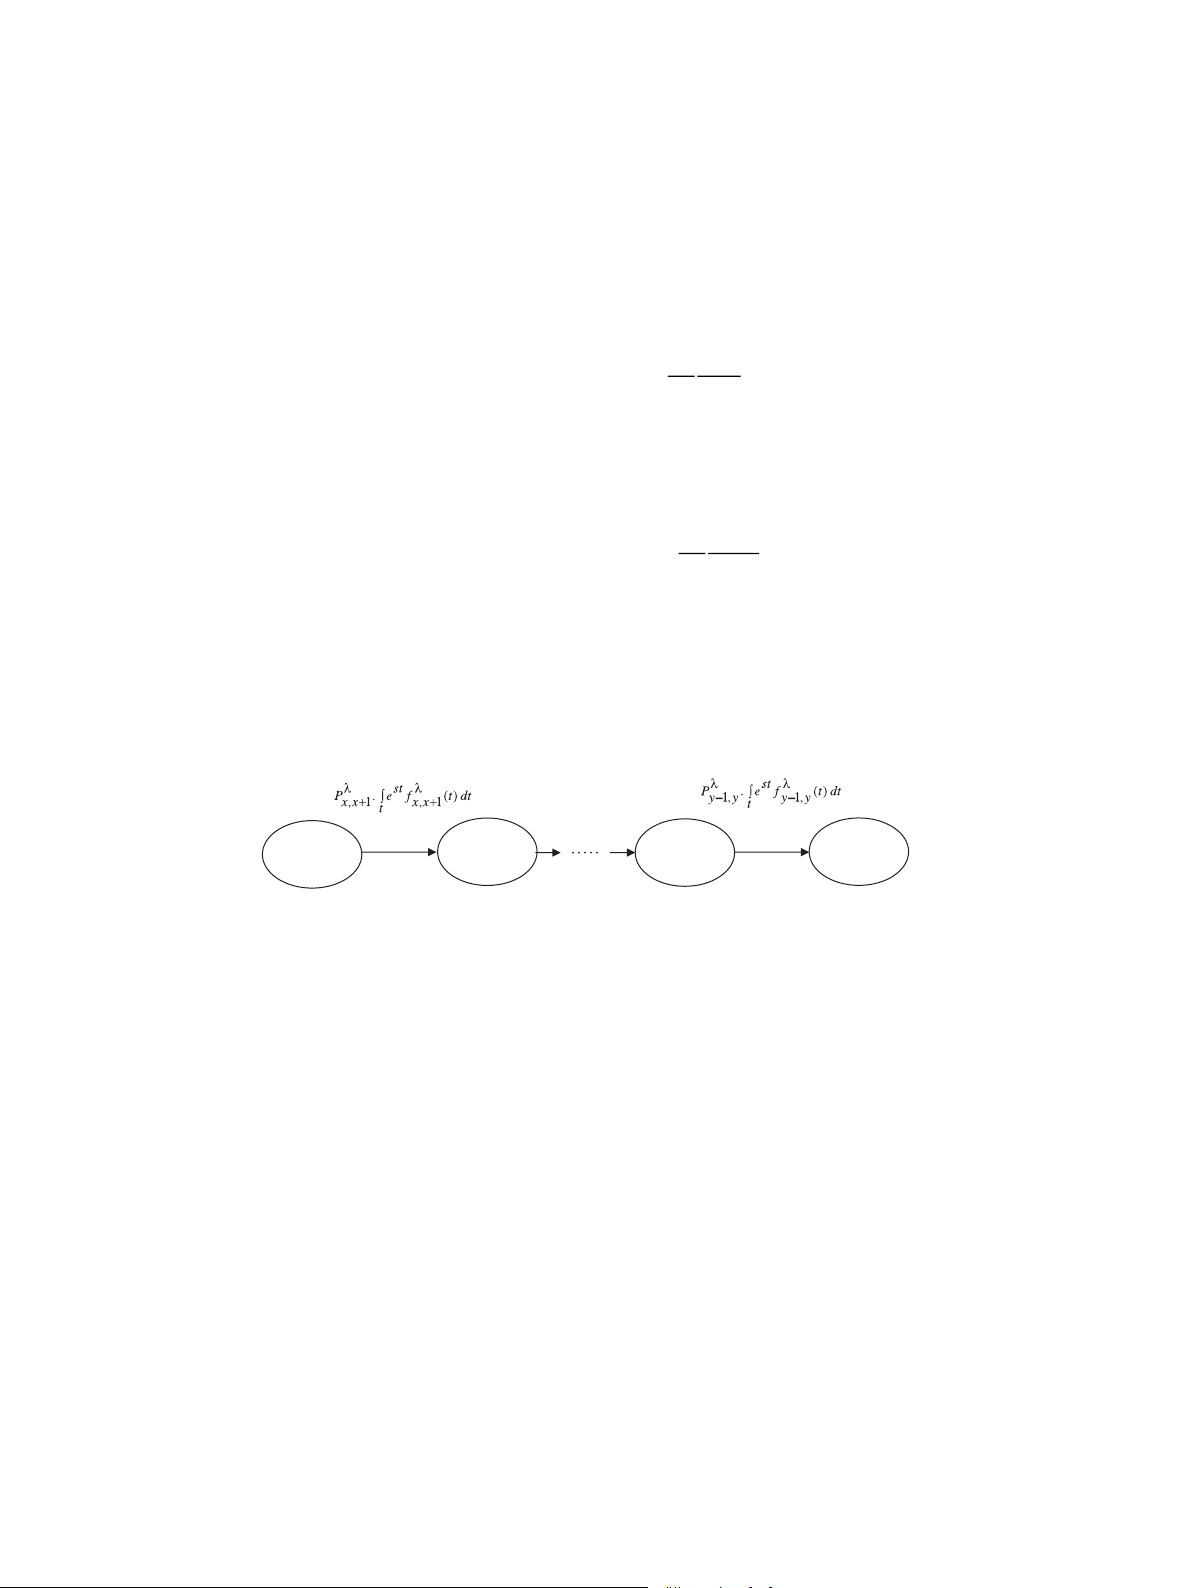
simplified by using series, parallel reduction techniques. S S x x+1 S S y-1 y Transition Description Transition Description
Fig. 3. Flow-graph model for series of state transitions. 3.1.
Series of sate transitions t ‘¼1
Using Eq. (1), the equivalent transition for a series of state transitions
where ‘ is the index for link between state i and state j.
depicted in Fig. 3 can be defined as follows:
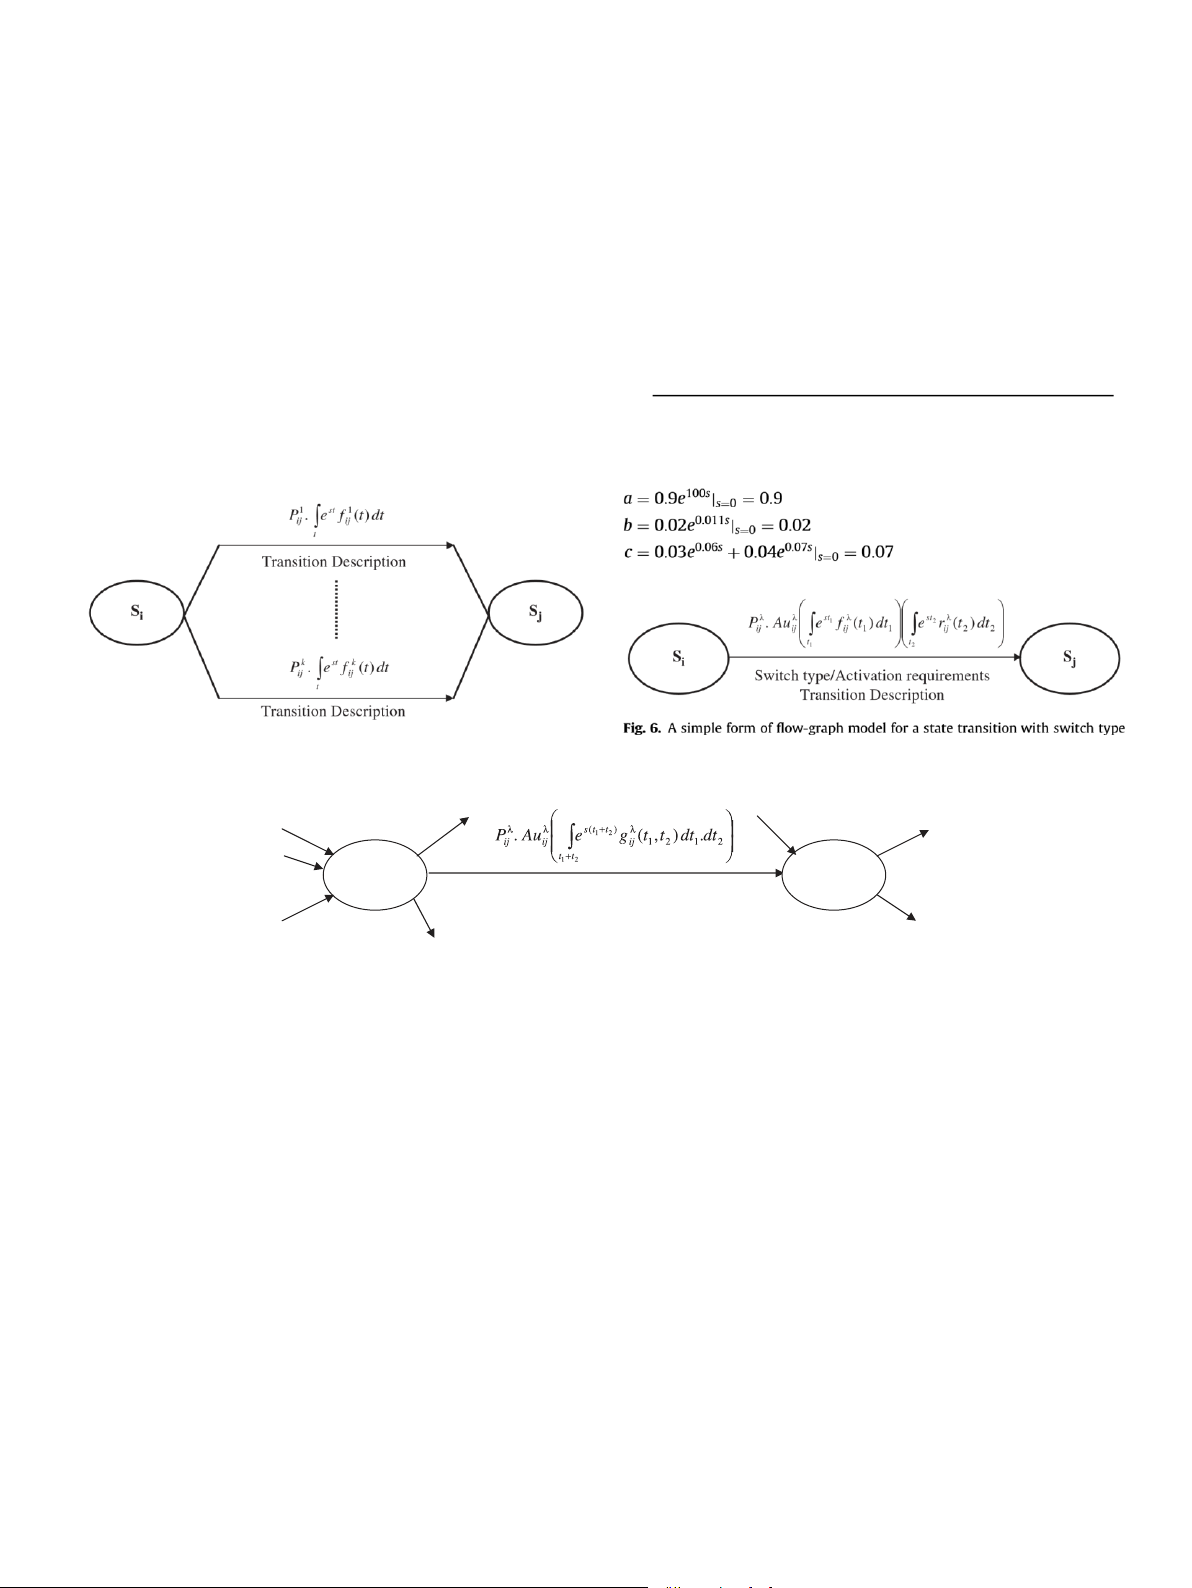
Similarly, we can extend the method for a link associated with switch type
and switch activation requirements shown in Fig. 5. The transition time is a y
random variable made up of two independent random variables (i.e., switch
time (t1) and activation time (t2)).
Wxy ¼ Y P‘ij Z
estf ‘ijðtÞdt (5)
Because transition time and activation time are independent, the total
transition time distribution function can be defined as follows:
ji¼¼iþx1 t
g‘ijðt1; t2Þ ¼ f ‘ijðt1Þr‘ijðt2Þ (7)
where ‘ ¼ 1, x is the starting state and y is the last state in the series.
Therefore, the simple form of the link is given in Fig. 6.
Similarly, using the approach for transition without switch type and 3.2.
Parallel state transitions
activation requirements, the system failure probability, MTTF and STTF can be
calculated for the warm–cold standby system with switch type and activation requirements.
Fig. 4 shows parallel transition states between state i and state j that
4. Numerical illustration
represents transitions because of HFs, CHEs in operation, maintenance, etc.
The equivalent of this parallel transition can be derived from the topology
Consider an aircraft ECS presented in Fig. 1 that maintains the temperature equation as follows:
of the cabin at the passenger comfort level. This warm–cold standby ECS k
system is made up of two dedicated cooling packs and a non-dedicated RAM
air functioning as warm–cold standby subsystems. In the normal operation,
Wij ¼ X P‘ij Z
estf ‘ijðtÞdt (6)
the cooling packs are automatically operating. However, flight crews always
have manual override option. In case of one pack failure, the warm standby
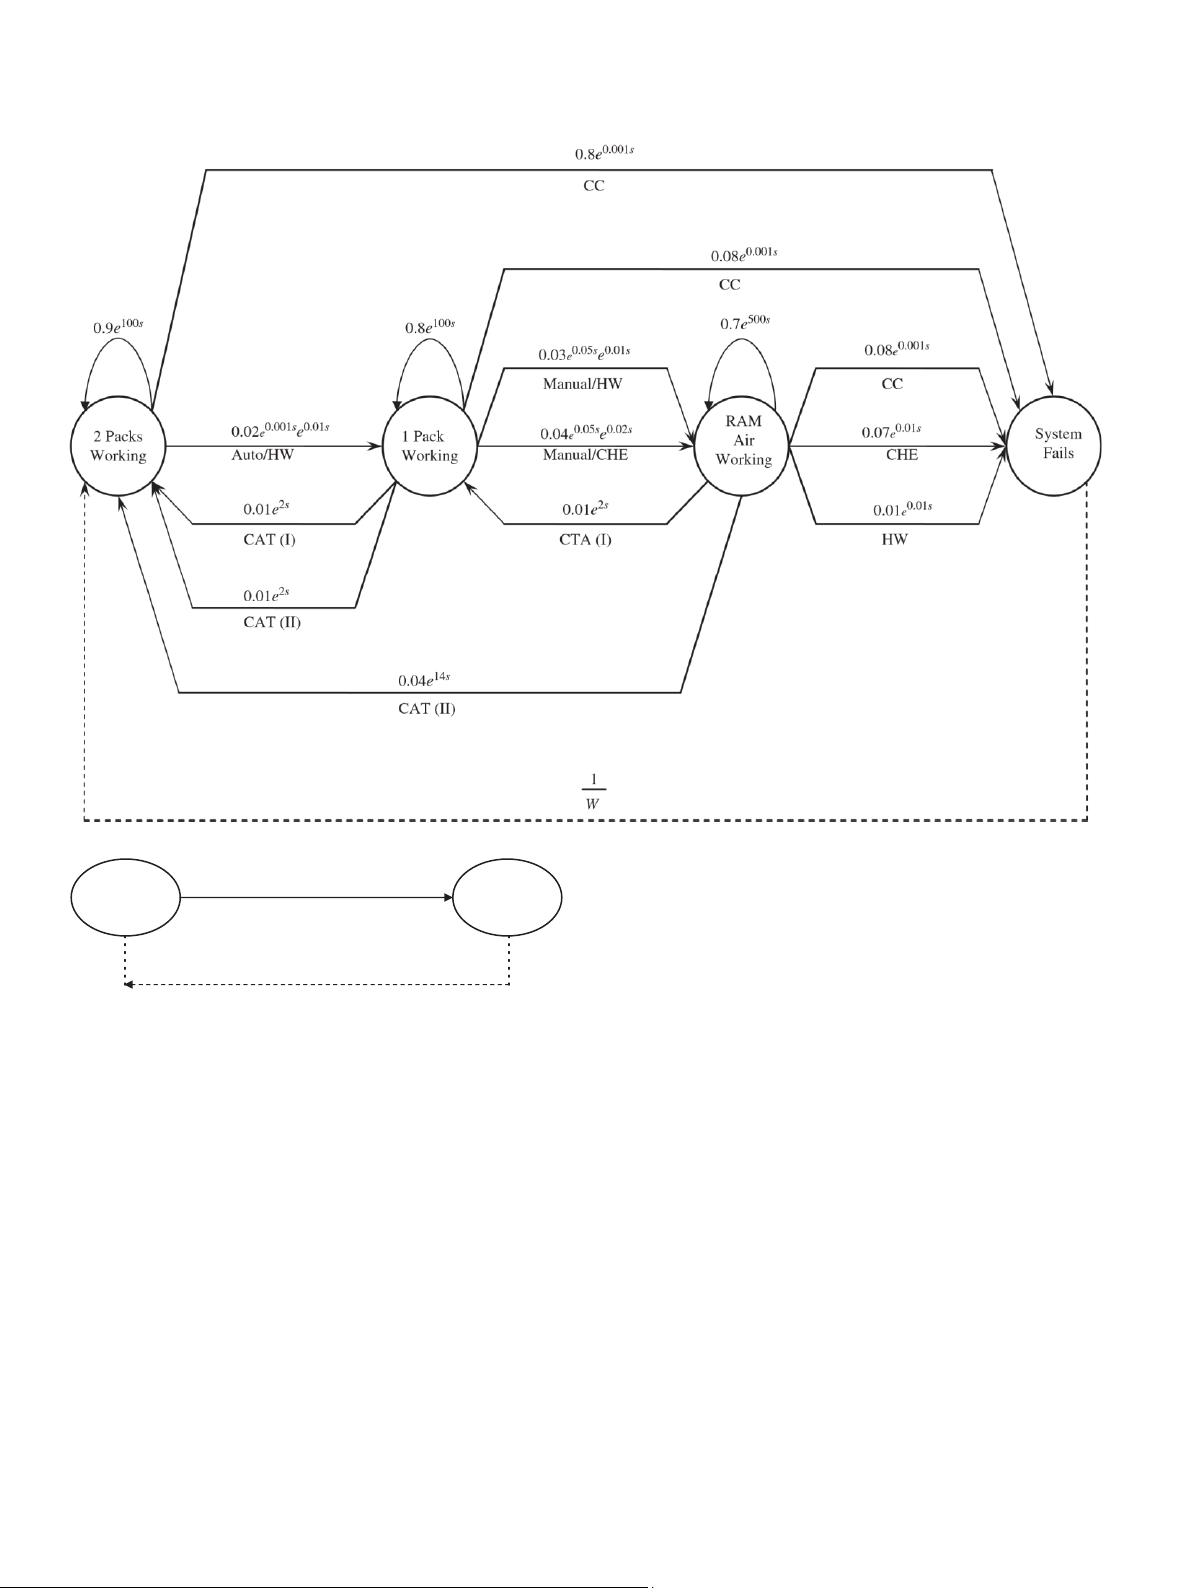
In state 1, the cooling packs work with reliability 0.92, mean time to failure
cooling pack can be instantaneously activated. Subsequently, if the remaining
100 h shown with a self-loop. State 2 shows that the ECS is vulnerably working
pack fails, RAM air can be automatically activated if the flight altitude is at or
with just one cooling pack. State 3 indicates that the RAM air standby
below 10,000 feet. Otherwise, flight crews may switch manually to the cold
subsystem with reliability 0.7 and the mean normal lifetime 500 h is activated.
standby RAM air subsystem. The manual switch activation requires certain
Finally, the RAM air failure due to CC, CHEs, or HF leads to the ECS system
procedure, which is time consuming. The required switch time is normally failure in State 4 (Fig. 8).
distributed with mean time 0.01 h. Also, in both switching cases, the required
Using step-wise reduction techniques and Eq. (1), we have the equivalent
time to change the flight altitude is normally distributed with mean 0.05 h. If
transition (W) from State 1 to State 4 as follows: e þ bcd þ bf eðcj þ g þ hÞ bfh
a pack fails due to overheat, the flight crews may repair the pack during flight.
The mean time to repair the overheat pack is normally distributed with mean þ egh
time 2 h. Also, it is assumed that all normal distributions have zero standard
deviation. The flight crew errors or maintenance crew errors in repairing the W ¼
pack may result in changing the state of the system. Fig. 7 presents the flow-
1 bi cj bck a g h þ bih þ cja þ aðg þ hÞ þ ghð1 aÞ
graph model for the warm–cold standby ECS including four states and all (8)
transitions with their associated parameters. where
Fig. 4. Flow-graph model for series of state transitions. and activation requirements. S i S j
Switch type/Activation requirements Transition Description
Fig. 5. Flow-graph model for a state transition with switch type and activation requirements.
Fig. 7. Flow-graph model for a simple version of ECS. 5. Conclusion W S 1 S 4
This study focuses on the warm–cold ECS standby system composed of
Equivalent transition for state 1 to state 4
non-identical and (non)-dedicated standby subsystems that may be activated
through automatic and manual switches under certain activation 1 / W
requirements. Contrary to dedicated subsystems, non-dedicated subsystems
are not general part of the ECS system. They can only be activated if they are
Fig. 8. Reduced flow-graph model for Fig. 7.
not serving other systems. Therefore, their activation method is manual
switch subject to meeting certain flight operational requirements.
Furthermore, because human plays a vital role in preparing the situation for
d ¼ 0:08ðe
switchover and maintenance activities, human errors may cause the system
0:001s þ e0:01sÞjs¼0 ¼ 0:16
degradation or failure. Therefore, we consider three types of failure including
e ¼ 0:08e0:001sjs¼0 ¼ 0:08 f ¼ 0:08e0:001sjs¼0 ¼ 0:08
CCs, human errors, and HFs in the developed model. Also, maintenance
activities are classified into two categories. Category I refers to the repair of
g ¼ 0:8e100sjs¼0 ¼ 0:8 h ¼
the subsystem by the flight crew during the operation time. Category II refers
0:7e500sjs¼0 ¼ 0:7 i ¼
to the repair activity performed by maintenance crews in the next
maintenance inspection in site.
0:02e2sjs¼0 ¼ 0:02 j ¼
The developed model for calculating the time-to-failure data and the 0:01e2sj
probability of the ECS system failure is based on the flowgraph concept. The s¼0 ¼ 0:01
model is made up of nodes and links representing states and transitions
k ¼ 0:04e14sjs¼0 ¼ 0:04
among states with arbitrary time distribution function. Using reduction
techniques and topology equation, the equivalent transition (W) from the
Using Eqs. (2)–(4), the mean time to failure of the system is
starting state to the end state can be obtained. Using Eqs. (2)–(4), we can
1078 flight hours. Also, standard deviation of time to failure is 1182 flight hours.
calculate the system failure probability, MTTF, and STTF. These data can be
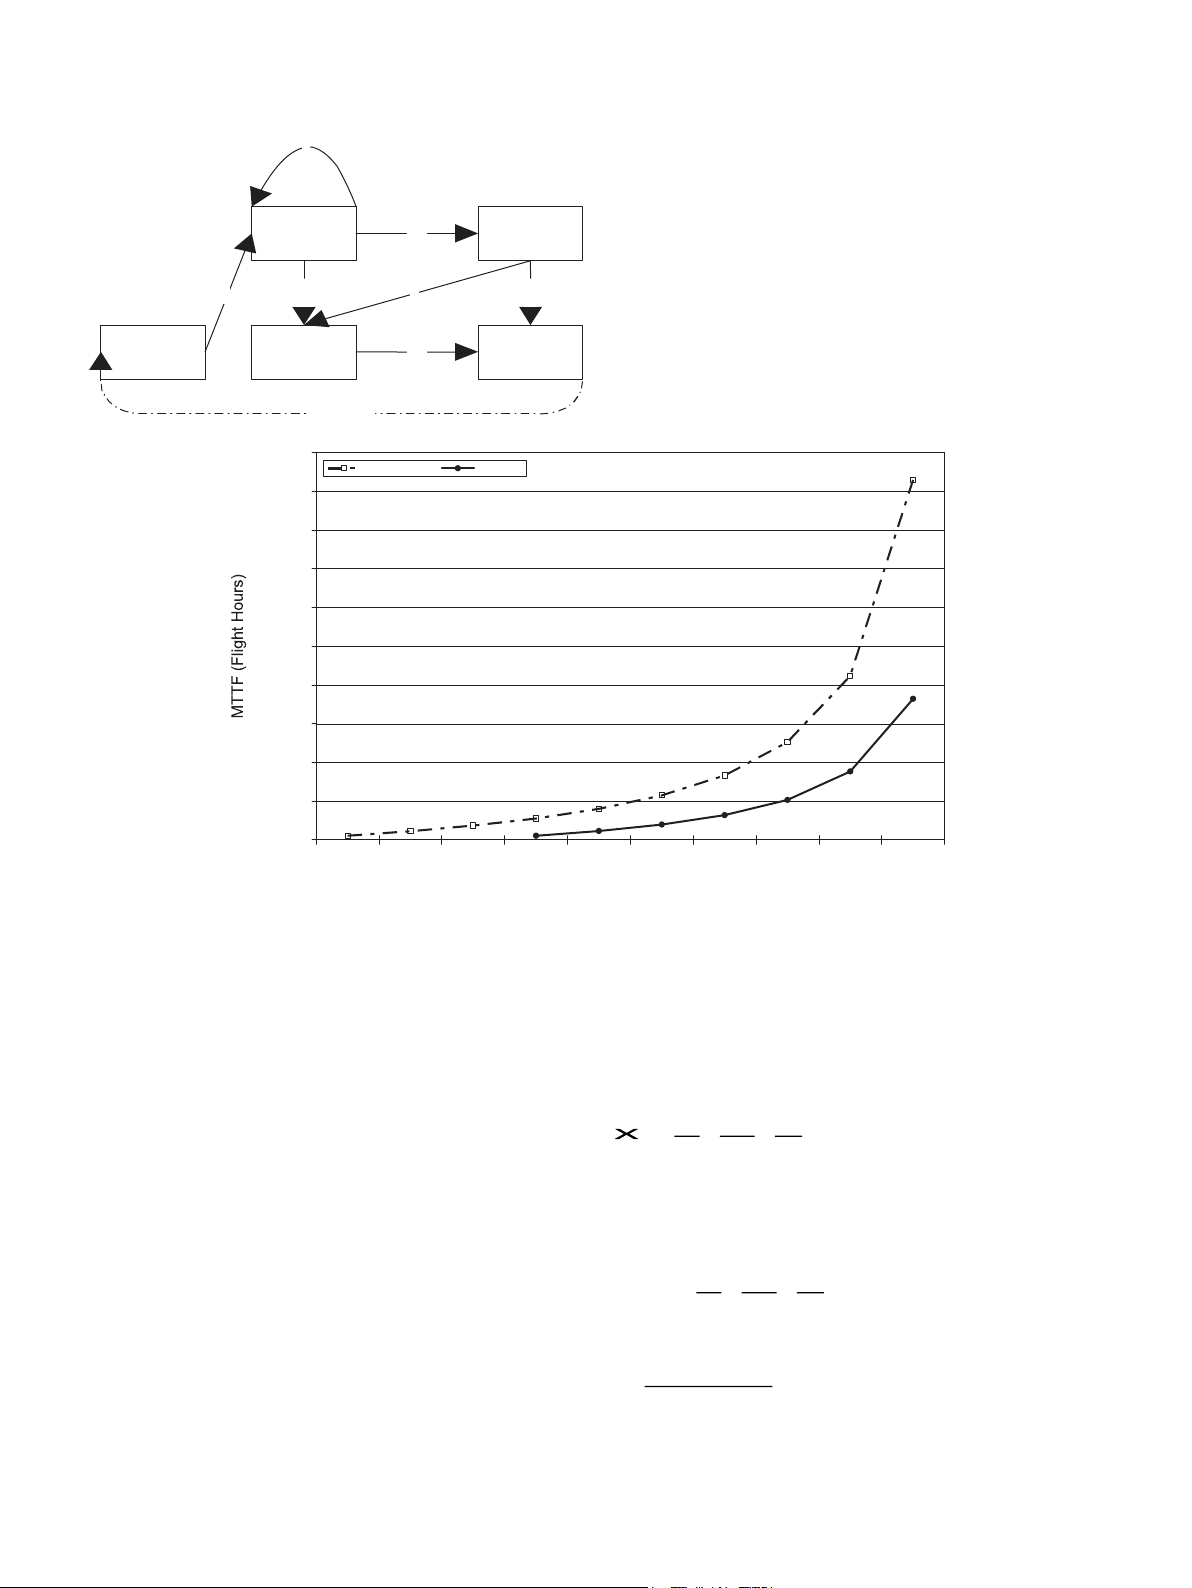
Performing sensitivity analysis, Fig. 9 depicts the relationship of the cooling pack
used for maintenance optimization based on limited failure strategy. Also, we
and the RAM air reliability with the mean time to failure of the ECS. The
can perform sensitivity analysis for MTTF and STTF of the ECS system that
reliability improvement of two warm–cold standby subsystems from 0.89 to
can be obtained from Eqs. (3) and
0.98 can improve the mean to failure. However, reducing the probability of CC,
CHEs, and HF links has no significant effect in improving MTTF. c
In Fig. 10, the flow graph has five nodes (state) and seven links (transition). If
one considers a dummy link from end node ‘E’ to start node ‘S’ with
transmittance 1/W, where W is the equivalent of the flow graph, the flow graph
becomes a closed flow graph. The flow graph has the following four loops: 1 b 2
transmittance of loop I (L1) ¼ abf/W,
transmittance of loop II (L2) ¼ abeg/W, a d e f
transmittance of loop III (L3) ¼ adg/W,
transmittance of loop IV (L4) ¼ c. S 3 g E
To find the equivalent of the flow graph, the topological Eq. (1) must be equal to zero: 1 /W ‘ ‘ ‘ ‘ ‘ ‘ 100000 Cooling packs RAM Air 90000 80000 70000 60000 50000 40000 30000 20000 10000 0 0.89 0.9 0.91 0.92 0.93 0.94 0.95 0.96 0.97 0.98 Reliability of the subsystem
Fig. 9. Mean time to failure of ECS. Fig. 10. Flow graph.
TP ¼ 1 X Li þ X X Li Lj X X X Li Lj Lk þ ¼ 0 i¼1 i j i j k
(4) based on changing the reliability of the subsystems, and transition
elements. For future work, one may extend the multilayer flow-graph for
where the first-order loop (i.e., Li) is composed of only one loop and the second-
evaluating different reliability scenarios.
order loop (i.e., Li Lj) is composed of the product of two disjointed loop ‘i’ and
‘j’. These disjointed loops ‘i’ and ‘j’ have no intersection in their nodes and links.
Similarly, the ‘n’thorder loop can be defined as a product of ‘n’ disjoint loops. Acknowledgments
For example, the transmittance of the first-order loops in Fig. 10 is given by 4
The authors would like to express their sincere appreciation to abf abeg adg
anonymous referees for the constructive comments, which enhanced the
Li ¼ þ þ þ c (9) W W W quality of the paper. i¼1
and there is no second-order loop, because the loops are not disjointed.
Thus, by substituting the transmittance of the first-order loop into the TP Eq. Appendix A
(1), and setting the remaining terms equal to zero, we obtain abf abeg adg
Fig. 10 presents a flow-graph model composed of nodes and links
associated with transmittance (i.e., a, b, etc.) representing states, transition
TP ¼ 1 þ þ þ c (10) W W W
process and transition parameters, respectively.
By equating TP equation equal to zero, we obtain
This closed flow graph has the following basic properties:
abf þ abeg þ adg only one start node, W ¼ (11) only one end node, 1 c
at least one path from the start to the end nodes,
Therefore, the equivalent of the flow graph in Fig. 10 is a singlenode flow
topological equation describing the relationship between path
graph with the transmittance of Eq. (11) where each link transmittance is the
transmittance of a closed flow graph is equal to zero.
product of its probability and its momentum generating function. For example,
in Fig. 2, the transmittance of the link between node ‘2’ and node ‘3’ denoted
by ‘e’ is equal to P23 Rt estf23ðtÞdt. References
[1] Dhillon BS, Rayapati SN. Common-cause failure and human error modeling of redundant
systems with partially energized standby units. Reliab Eng 1987;19:1–14.
[2] Aven T. Availability formulae for standby systems of similar units that are preventively
maintained. IEEE Trans Reliab 1990;39(5):603–6.
[3] She J, Pecht MG. Reliability of k-out-of-n warm standby system. IEEE Trans Reliab 1992;1(2):50–9.
[4] Dhillon BS, Yang N. Human error analysis of a standby redundant system with arbitrarily
distributed repair times. Microelectron Reliab 1993;33(3):431–44.
[5] Pham TG, Turkkan N. Reliability of a standby system with beta-distributed component lives.
IEEE Trans Reliab 1994;43(1):71–5.
[6] Subramanian R, Anantharaman V. Reliability analysis of a complex standby redundant
system. Reliab Eng Syst Saf 1995;45:57–70.
[7] Dhillon BS, Yang N. Probabilistic analysis of a maintainable system with human error. J Qual Maint Eng 1995;1(2):50–9.
[8] Aven T, Optal K. On the steady state unavailability of standby systems. Reliab Eng Syst Saf 1996;52:171–5.
[9] Sridharan V, Mohanavadivu P. Some statistical characteristics of a repairable, standby,
human and machine system. IEEE Trans Reliab 1998;47(4): 431–5.
[10] Mahmoud MAW, Esmail MA. Stochastic analysis of a two-unit warm standby system with
slow switch subject to hardware and human error failures. Microelectron Reliab 1998;38:1639–44.
[11] Zhong YL. An optimal geometric process model for a cold standby repairable system. Reliab
Eng Syst Saf 1999;63:107–10.
[12] Ke J, Wang K. The reliability analysis of balking and reneging in a repairable system with
warm standbys. Qual Reliab Eng Int 2002;18:467–78.
[13] Motta SB, Colosimo EA. Determination of preventive maintenance periodicities of standby
devices. Reliab Eng Syst Saf 2002;76:149–54.
[14] Utkin LV. Imprecise reliability of cold standby systems. Int J Qual Reliab Manage 2003;20(6):722–39.
[15] Seo JH, Jang JS, Ba DS. Lifetime and reliability estimation of repairable redundant system
subject to periodic alternation. Reliab Eng Syst Saf 2003; 80:197–204.
[16] Zhang T, Xie M, Horigome M. Availability and reliability of k-out-of-(M+N)-G warm standby
systems. Reliab Eng Syst Saf 2006;20(6):722–39.
[17] Azaron A, Katagiri H, Kato K, Sakawa M. Reliability evaluation of multicomponent cold-
standby redundant systems. Appl Math Comput 2006;173:137–49.
[18] Jayabalan V, Chaudhuri D. Optimal maintenance and replacement policy for deteriorating
system with increased mean downtime. Naval Res Logistics 1992;39:67–78.
[19] Pritsker AAB, Happ WW. GERT: Graphical evaluation and review technique:
Part I: fundamental. J Industrial Eng 1966;17(5):267–74.
Tài liệu liên quan:
-

KHTN 8 vật lý học kỳ II lý thuyết
16 8 -

Trình bày đề tài Nghiên cứu khoa học | Đại học Bách Khoa Hà Nội
26 13 -
Báo cáo Áp dụng lý thuyết học tập xã hội trong giáo dục trực tuyến môn Nghiên cứu khoa học | Trường Đại học Bách Khoa Hà Nội
117 59 -

Đề cương môn Nghiên cứu khoa học | Trường Đại học Bách Khoa Hà Nội
115 58