Practical Procedures and Methods | Môn Food Analysis - Trường Đại học Quốc tế, Đại học Quốc gia Thành phố Hồ Chí Minh
Determine the moisture content of rice flour and milk (using moisture balance analyzer and forced draft oven). Tài liệu được sưu tầm gồm 28 trang, giúp bạn ôn tập tốt hơn. Mời các bạn đón xem.
Môn: Food Analysis 5 tài liệu
Trường: Trường Đại học Quốc tế, Đại học Quốc gia Thành phố Hồ Chí Minh 1.9 K tài liệu
Tác giả:


Preview text:
lOMoAR cPSD| 58562220
VIETNAM NATIONAL UNIVERSITY - HCMC INTERNATIONAL UNIVERSITY
School of Biotechnology – Department of Food Technology Laboratory Manual
PRACTICE IN FOOD ANALYSIS BTFT352IU
Instructor: MSc. Tran Thi Yen Nhi
Teaching Assistant: BEng. Nguyen Thanh Nhi lOMoAR cPSD| 58562220
Ho Chi Minh City, 2024 Contents
LABORATORY 1 ..................................................................................................................... 4
DETERMINATION OF MOISTURE CONTENT ................................................................... 4
1. Objective ......................................................................................................................... 4
2. Materials and equipment ................................................................................................. 4
3. Procedure ......................................................................................................................... 4
4. Data and Calculations ...................................................................................................... 5
5. Questions ......................................................................................................................... 6
6. References ....................................................................................................................... 6
LABORATORY 2 ..................................................................................................................... 7
DETERMINATION OF ASH CONTENT ................................................................................ 7
1. Objective ......................................................................................................................... 7
2. Materials and equipment ................................................................................................. 7
3. Procedure ......................................................................................................................... 7
3.1. Chilli sauce ...................................................................................................................... 7
3.2. Rice flour ......................................................................................................................... 7
4. Data and Calculations ...................................................................................................... 8
5. Questions ......................................................................................................................... 8
6. References ....................................................................................................................... 8 LABORATORY 3
................................................................................................................... 10 lOMoAR cPSD| 58562220
DETERMINATION OF LIPID CONTENT ........................................................................... 10
1. Objective ....................................................................................................................... 10
2. Materials and equipment ............................................................................................... 10
3. Procedure ....................................................................................................................... 10
4. Data and Calculations .................................................................................................... 11
5. Questions ....................................................................................................................... 12
6. References ..................................................................................................................... 12
LABORATORY 4 ................................................................................................................... 13
PROTEIN CONTENT IN FOOD (KJELDAHL METHODS) ............................................... 13
1. Objective ....................................................................................................................... 13
2. Materials and equipment ............................................................................................... 13
3. Procedure ....................................................................................................................... 13
3.1. Digestion ....................................................................................................................... 13
3.2. Distillation ..................................................................................................................... 14
3.3. Titration ......................................................................................................................... 14
4. Calculation ..................................................................................................................... 14
5. Questions ....................................................................................................................... 15
6. References ..................................................................................................................... 15 LABORATORY 5
................................................................................................................... 16
DETERMINATION OF TOTAL CARBOHYDRATE IN FOODS ....................................... 16
1. Objective ....................................................................................................................... 16
2. Materials and equipment ............................................................................................... 16 lOMoAR cPSD| 58562220
3. Procedure ....................................................................................................................... 16
3.1. Prepare standard curve tubes ......................................................................................... 16
3.2. Prepare sample tubes ..................................................................................................... 17
4. Questions ....................................................................................................................... 17
7. References ..................................................................................................................... 17
LABORATORY 6 ................................................................................................................... 19
DETERMINATION OF CRUDE DIETARY FIBER IN FOODS.......................................... 19
1. Objective ....................................................................................................................... 19
2. Materials and equipment ............................................................................................... 19
3. Procedure ....................................................................................................................... 19
3.1. Digestion ....................................................................................................................... 19
3.2. Total dietary fiber determination ................................................................................... 19
4. Data and calculation ...................................................................................................... 20
4.1. Recorded data ................................................................................................................ 20
4.2. Calculation ..................................................................................................................... 21
5. Questions ....................................................................................................................... 21
6. References ..................................................................................................................... 21 LABORATORY 7
................................................................................................................... 22
DETERMINATION OF TOTAL FLAVONOID CONTENT (TFC) ..................................... 22
1. Objective ....................................................................................................................... 22
2. Materials and equipment ............................................................................................... 22
3. Procedure ....................................................................................................................... 22
3.1. Prepare standard curve tubes ......................................................................................... 22 lOMoAR cPSD| 58562220
3.2. Prepare rutin standard at different concentration .......................................................... 22
3.4. Determine total flavonoid contents of tea ..................................................................... 22
4. Questions ....................................................................................................................... 23
5. References ..................................................................................................................... 23
LABORATORY 8 ................................................................................................................... 24
DETERMINATION OF VITAMIN C IN FOODS ................................................................. 24
1. Objective ....................................................................................................................... 24
2. Materials and equipment ............................................................................................... 24
3. Procedure ....................................................................................................................... 24
3.1. Prepare 1% starch indicator solution ............................................................................. 24
3.2. Prepare iodine solution .................................................................................................. 24
3.3. Prepare vitamin C standard solution ............................................................................. 25
3.4. Standardize vitamin C solution ..................................................................................... 25
3.5. Prepare orange juice solution ........................................................................................ 25
3.6. Titrate juice samples ...................................................................................................... 25
3.7. Titrate blank solution ..................................................................................................... 25
4. Questions ....................................................................................................................... 26
5. References ..................................................................................................................... 26 LABORATORY 1
DETERMINATION OF MOISTURE CONTENT 1. Objective
Determine the moisture content of rice flour and milk (using moisture balance analyzer and forced draft oven). lOMoAR cPSD| 58562220
2. Materials and equipment − Rice flour, 50 g − Aluminum pan − Chilli sauce, 50 g − Tray − Plastic gloves − Desiccators − Tong − Analytical balance − Spoon − Moisture balance analyzer 3. Procedure
Moisture content is determined in triplicate for both methods.
3.1.Use moisture balance analyzer
Note: test rice flour and chilli sauce separately
− Follow instruction manual from manufacturer.
− Weigh 0.5g samples into the aluminum pan.
− Turn on the power switch and wait for instrument calibration.
− Specify settings: automatic operation mode for both rice flour and chilli sauce.
− Place the pan in the instrument.
− Carefully close the lid and wait until the weight of aluminum is constant (the sign O appears on the screen). − Tare instrument.
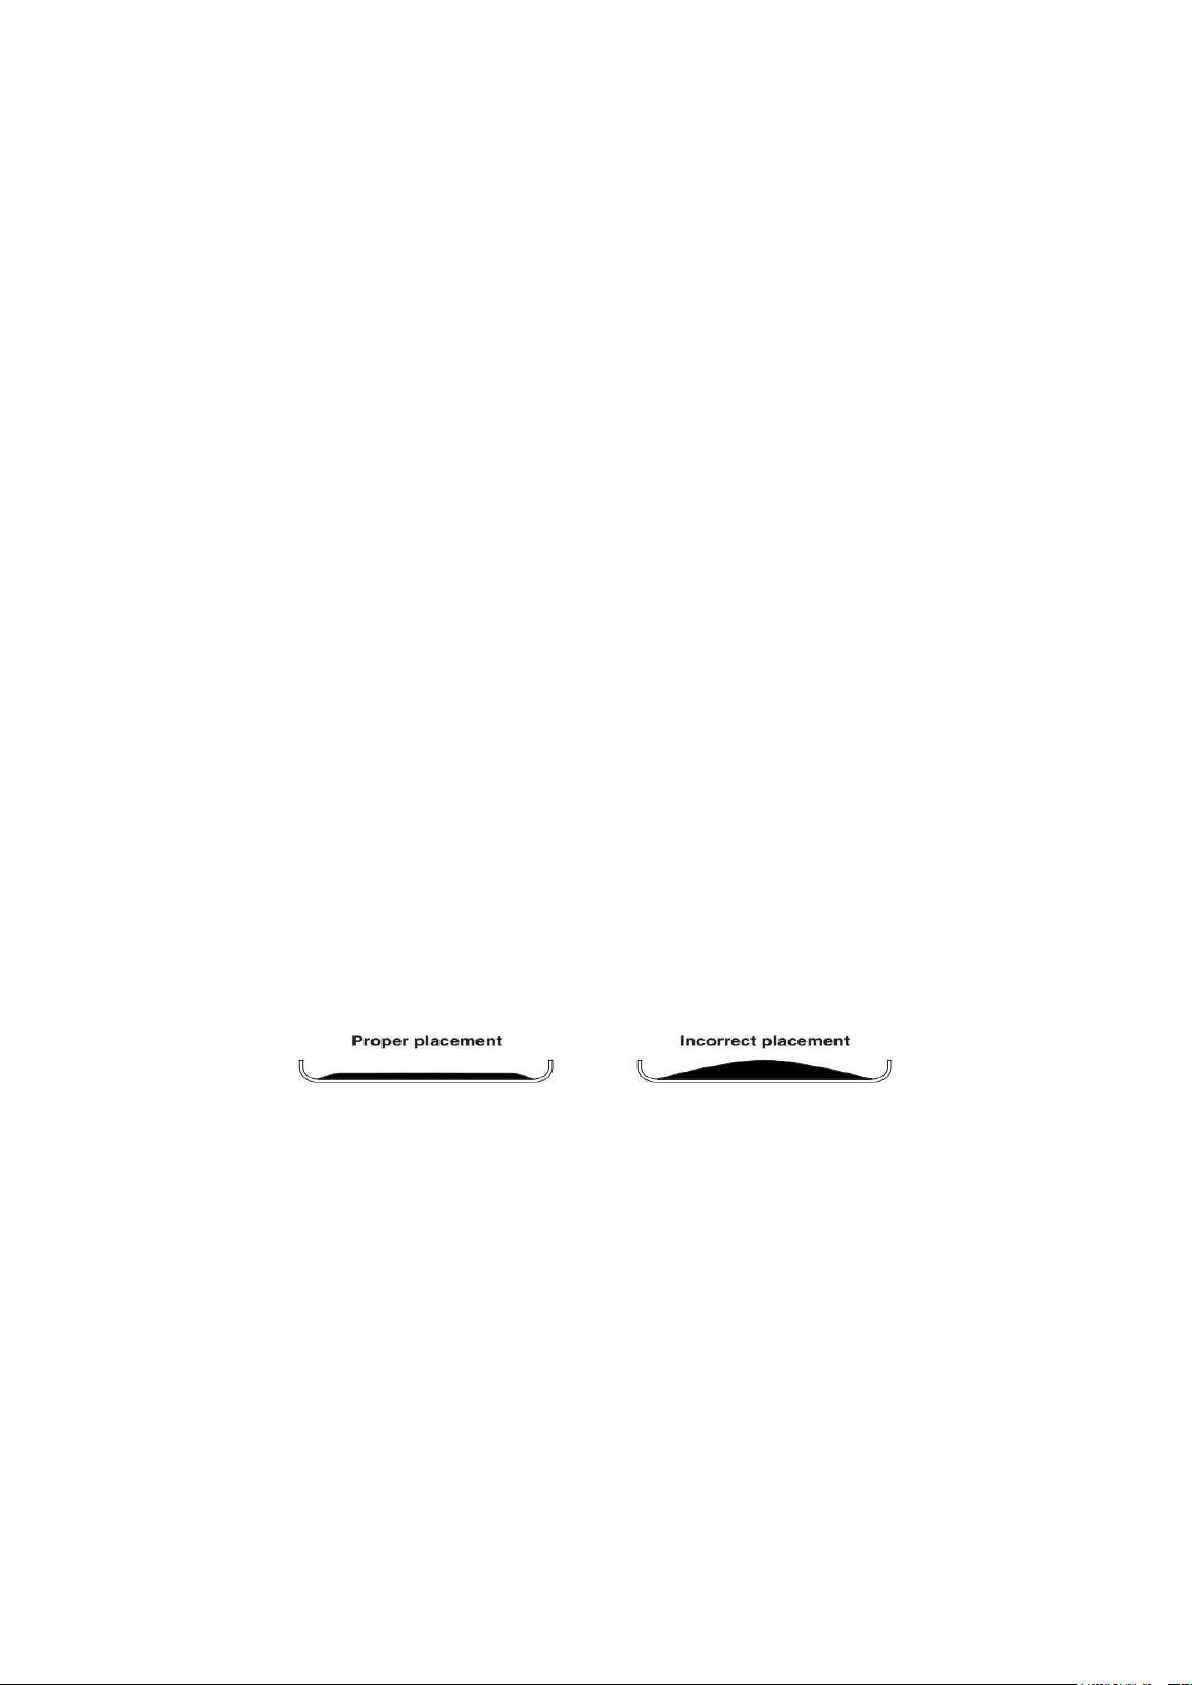
− Place testing sample on the pan.
Figure 1. Sample placement on aluminum pan. − Start the measurement. − Obtain results.
3.2.Using Forced Draft Oven Chilli sauce
− Label and weigh aluminum pans.
− Weigh 5 g into aluminum pans and weigh sample.
− Place the aluminum pans containing samples in a forced draft oven at 130 oC for 3 hours
(weigh the aluminum pans with samples after every 30 mins until no change in weight observed). lOMoAR cPSD| 58562220
− Store in a desiccator until samples are weighed. Rice flour
− Label and weigh aluminum pans.
− Weigh 2 g of sample into aluminum pans.
− Place the aluminum pans containing samples in a forced draft oven at 130 oC for 3 hours
(weigh the aluminum pans with samples after every 30 mins until no change in weight observed).
− Store in a desiccator until samples are weighed.
4. Data and Calculations 4.1.Recorded data Weight of pan
Weight of Weight of pan +
Sample Repitition
+ dried sample % moisture pan (g) wet sample (g) (g) 1 𝑋̅ = SD = Rice flour 2 3 1 𝑋̅ = SD Chilli 2 = sauce 3 4.2.Calculation
𝑊𝑒𝑖𝑔ℎ𝑡 𝑜𝑓 𝑤𝑎𝑡𝑒𝑟 (𝑔)
% 𝑚𝑜𝑖𝑠𝑡𝑢𝑟𝑒 = 𝑥 100
𝑊𝑒𝑖𝑔ℎ𝑡 𝑜𝑓 𝑤𝑒𝑡 𝑠𝑎𝑚𝑝𝑙𝑒 (𝑔)
% 𝑚𝑜𝑖𝑠𝑡𝑢𝑟𝑒 (𝑊𝑒𝑖𝑔ℎ𝑡 𝑜𝑓 𝑝𝑎𝑛 + 𝑤𝑒𝑡 𝑠𝑎𝑚𝑝𝑙𝑒) − (𝑊𝑒𝑖𝑔ℎ𝑡 𝑜𝑓 𝑝𝑎𝑛 + 𝑑𝑟𝑖𝑒𝑑 𝑠𝑎𝑚𝑝𝑙𝑒)(𝑔) = 𝑥 100
(𝑊𝑒𝑖𝑔ℎ𝑡 𝑜𝑓 𝑝𝑎𝑛 + 𝑤𝑒𝑡 𝑠𝑎𝑚𝑝𝑙𝑒) − 𝑊𝑒𝑖𝑔ℎ𝑡 𝑜𝑓 𝑝𝑎𝑛 (𝑔) 5. Questions
1. What is the difference between moisture content and water activity measurement? (20%) lOMoAR cPSD| 58562220
2. Why was the chilli sauce sample partially evaporated on a hot plate before being dried in a hot oven? (20%)
3. Compare moisture content results of different groups, compare results between chilli sauce
and rice flour, compare results between moisture balance analyzer and forced draft oven
method. Explain any difference. (40%)
4. What are the advantages and disadvantages of each method? (10%)
5. Lab-work behavior and participation (10%) 6. References
AACC International. (2010). Approved methods of analysis (11th ed.). AACC International, St. Paul, MN.
AOAC International. (2007). Official methods of analysis (18th ed.). AOAC International, Gaithersburg, MD.
Nielsen, S. S., & Bradley, R. L. (2010). Moisture and total solids analysis. Food analysis, 85104.
Hung, P. V. (n.d.). Food analysis lab manual. Ho Chi Minh, International University, Vietnam National University HCMC. lOMoAR cPSD| 58562220 LABORATORY 2
DETERMINATION OF ASH CONTENT 1. Objective
Determine ash content of rice flour and chilli sauce using muffle furnace.
2. Materials and equipment − Chilli sauce, 50 g − Gloves − Rice flour, 50 g − Tong − Crucibles − Spoon
− Desiccators (with dried desiccant) − Tray − Volumetric pipettes, 5 ml − Analytical balance − Aluminum pan − Muffle furnace 3. Procedure 3.1.Chilli sauce
− Label and weigh the crucible.
− Weigh 2 g sample into a crucible and weigh sample.
− Place the crucible containing samples in a forced draft oven at 130 oC.
− Weigh the crucible after each 30 mins until no change in weight observed. 3.2.Rice flour
− Label and weigh the crucible.
− Weigh 2 g of sample in the crucibles.
− Place crucibles containing samples in a forced draft oven at 110 oC.
− Weigh the crucible after each 30 min until no change in weight observed.
− Store samples in a desiccator until samples are weighed.
− Weigh crucible containing dried sample. lOMoAR cPSD| 58562220
− Primary burning the content of materials by flame in a fume hood.
− Place all the crucibles in muffle furnace at 550 oC for 3 h until only white matters can be seen.
− Cool crucibles in a desiccator and weigh crucibles with ashed samples.
4. Data and Calculations 4.1.Recorded data Weight of Weight of crucible + wet Weight of crucible
Sample Repitition crucible sample (g) % ash + ash (g) (g) 1 𝑋̅ = SD Rice 2 = flour 3 1 𝑋̅ = SD Chilli 2 = sauce 3 4.2.Calculation
𝑊𝑒𝑖𝑔ℎ𝑡 𝑜𝑓 𝑎𝑠ℎ (𝑔) % 𝑎𝑠ℎ, 𝑤𝑏 = 𝑥 100
𝑊𝑒𝑖𝑔ℎ𝑡 𝑜𝑓 𝑤𝑒𝑡 𝑠𝑎𝑚𝑝𝑙𝑒 (𝑔)
(𝑊𝑒𝑖𝑔ℎ𝑡 𝑜𝑓 𝑐𝑟𝑢𝑐𝑖𝑏𝑙𝑒 + 𝑎𝑠ℎ) − 𝑊𝑒𝑖𝑔ℎ𝑡 𝑜𝑓 𝑐𝑟𝑢𝑐𝑖𝑏𝑙𝑒 (𝑔) % 𝑎𝑠ℎ, 𝑤𝑏 = 𝑥 100
(𝑊𝑒𝑖𝑔ℎ𝑡 𝑜𝑓 𝑐𝑟𝑢𝑐𝑖𝑏𝑙𝑒 + 𝑤𝑒𝑡 𝑠𝑎𝑚𝑝𝑙𝑒) − 𝑊𝑒𝑖𝑔ℎ𝑡 𝑜𝑓 𝑐𝑟𝑢𝑐𝑖𝑏𝑙𝑒 (𝑔) 5. Questions
1. What is ash? What does ash consist of? Give examples to illustrate your answer (15%)
2. How many types of ashing procedures? What are they? (20%)
3. Compare ash content results of different groups, compare results between milk and rice flour,
compare your result and ash content reported on the nutrition label or in literature. (40%)
4. Why do the samples need to be placed in desiccators, but not outside, before weighing? (15%)
5. Lab-work behavior and participation (10%) lOMoAR cPSD| 58562220 6. References
AACC International. (2010). Approved methods of analysis (11th ed.). AACC International, St. Paul, MN.
AOAC International. (2007). Official methods of analysis (18th ed.). AOAC International, Gaithersburg, MD.
Nielsen, S. S., & Bradley, R. L. (2010). Moisture and total solids analysis. Food analysis, 6, 85104.
Hung, P. V. (n.d.). Food analysis lab manual. Ho Chi Minh, International University, Vietnam National University HCMC. lOMoAR cPSD| 58562220 LABORATORY 3
DETERMINATION OF LIPID CONTENT 1. Objective
Determine the lipid content of snack foods and rice bran by the Soxhlet method.
2. Materials and equipment − Rice bran, 30 g − Tongs − Snack food, 30 g − Beaker, 250 ml Graduated cylinder, 500 ml − Hexane − − Desiccators −
Aluminum weighing pan, pre-dried in 70 oC − Mortar and pestle oven over night − Pumice
− Filter paper, pre-dried in 70 oC oven over night − Analytical balance − Plastic gloves
Soxhlet extractor, with glassware − Forced draft oven − Spatula − − Tape 3. Procedure
− Record the fat content and serving size of products as shown on the package label: + Name of Product + Label g fat / serving + Label serving size (g) + Label g fat / 100 g product
− Snack: Grind approx. 10 g sample with mortar and pestle. − Correct moisture content:
+ Using the remainder of the ground sample and dried, labeled, and weighed aluminum
sample pans, prepare triplicate 2–3 g samples for moisture analysis.
+ Dry sample at 70°C, for 24 h in a drying oven.
+ Reweigh after drying and calculate moisture content of the sample. lOMoAR cPSD| 58562220
− Weigh filter paper and label on the filter paper.
− Prepare samples: place 5 g of snack or rice bran in the pre-weighed filter paper.
− Tightly wrap it up and reweigh.
− Prepare 1 control (blank).
− Fill 250 ml hexane in the round bottom flask. Add some 5 – 8 pumices.
− Place the wrapped filter paper in a Soxhlet extractor.
− Place the flask on the hotplate flask adapter and insert the extractor into the mouth of the flask.
− Attach the reflux condenser to the extractor and start the flow of cooling water.
− Turn the power switch on the front of the inline heating unit to the “I” position.
− Adjust the power levels at 60 % first, then to 70 – 80 % so that the solvent boils uniformly in
all positions and condenses in sufficient amounts to uniformly extract all of the samples. −
Remove wrapped filter paper from the Soxhlet extractor using tongs, air dry overnight in a hood,
and then open filter paper to expose the content; dry in a drying oven at 70 oC for 24 h.
− Cool dried samples in a desiccator then reweigh.
4. Data and Calculations 4.1.Recorded data Weight Weight Weight of Weight of
of filter of wet filter paper filter paper + % % (fat + %
Sample paper sample + wet
dried sample moisture moisture) fat (g) (g) sample (g) (g) 1 1 1 1 2 2 2 2 Snack 𝑋̅ = 𝑋̅ = 𝑋̅ = 𝑋̅ = SD = SD = SD = SD = 1 1 1 1 Rice 2 2 2 2 bran 𝑋̅ = 𝑋̅ = 𝑋̅ = 𝑋̅ = SD = SD = SD = SD = 4. 2.Calculation lOMoAR cPSD| 58562220
(𝑊𝑒𝑖𝑔ℎ𝑡 𝑜𝑓 𝑝𝑎𝑛 + 𝑤𝑒𝑡 𝑠𝑎𝑚𝑝𝑙𝑒) − (𝑊𝑒𝑖𝑔ℎ𝑡 𝑜𝑓 𝑝𝑎𝑛 + 𝑑𝑟𝑖𝑒𝑑 𝑠𝑎𝑚𝑝𝑙𝑒)(𝑔)
% 𝑚𝑜𝑖𝑠𝑡𝑢𝑟𝑒 = 𝑥 100
(𝑊𝑒𝑖𝑔ℎ𝑡 𝑜𝑓 𝑝𝑎𝑛 + 𝑤𝑒𝑡 𝑠𝑎𝑚𝑝𝑙𝑒) − 𝑊𝑒𝑖𝑔ℎ𝑡 𝑜𝑓 𝑝𝑎𝑛 (𝑔)
% (𝑓𝑎𝑡 + 𝑚𝑜𝑖𝑠𝑡𝑢𝑟𝑒)
(𝑊𝑒𝑖𝑔ℎ𝑡 𝑜𝑓 𝑓𝑖𝑙𝑡𝑒𝑟 𝑝𝑎𝑝𝑒𝑟 + 𝑤𝑒𝑡 𝑠𝑎𝑚𝑝𝑙𝑒) − (𝑊𝑒𝑖𝑔ℎ𝑡 𝑜𝑓 𝑓𝑖𝑙𝑡𝑒𝑟 𝑝𝑎𝑝𝑒𝑟 + 𝑑𝑟𝑖𝑒𝑑 𝑠𝑎𝑚𝑝𝑙𝑒) (𝑔) = 𝑥 100
𝑊𝑒𝑖𝑔ℎ𝑡 𝑜𝑓 𝑤𝑒𝑡 𝑠𝑎𝑚𝑝𝑙𝑒 (𝑔)
% fat (wt/w) = (% (fat + moisture)) – (% moisture) 5. Questions
1. Calculate % moisture and % fat. (30%)
2. Compare your findings to fat content reported on the nutrition label. Explain any similarities
and/or differences between the two. (30%)
3. What were the advantages of using the Soxhlet extraction method? Compare Soxhlet extraction
method with another lipid extraction method you know to illustrate your answer. (30%)
4. Lab-work behavior and participation. (10%) 6. References
AOAC International. (2007). Official methods of analysis (18th ed.). AOAC International, Gaithersburg, MD.
Min, D. B., & Ellefson, W. C. (2010). Fat analysis. Food analysis, 4, 117-136.
Nielsen, S. S., & Bradley, R. L. (2010). Determination of fat content. Food analysis, 4, 85-104.
Hung, P. V. (n.d.). Food analysis lab manual. Ho Chi Minh, International University, Vietnam National University HCMC. LABORATORY 4
PROTEIN CONTENT IN FOOD (KJELDAHL METHODS) 1. Objective
Determine the protein content of rice flour using the Kjeldahl method.
2. Materials and equipment lOMoAR cPSD| 58562220 − Rice flour, 30 g − Digestion tubes − NaOH 32% (wt/v) − Erlenmeyer flasks, 500 ml − H3BO3 4% (wt/v) − Spatula − Tashiro indicator − Weighing paper − H2SO4, 0.1 N − Analytical balance − Burette with ring stand H2SO4, concentrated − −
Kjeldahl digestion and distillation CuSO4 − − K2SO4 system 3. Procedure 3.1.Digestion
Note: Digestion takes place in a hood with fan on.
− Weigh approx. 1 g rice flour and sticky rice flour. Place rice flour/ sticky rice flour in a digestion tube.
− Add 0.2 g CuSO4, 1 g K2SO4, and 20 ml concentrated H2SO4 to each tube with rice flour/ sticky
rice flour (adjust dispenser to 10ml and take 2 times of dispenser).
− Prepare blank: Add 0.2 g CuSO4, 1 g K2SO4, and 20 ml concentrated H2SO4 to a tube with weighing paper.
− Take the sample rack from the lower hook.
− Insert digestion tubes into sample rack.
− Place rack of digestion tubes on digestion block.
− Cover digestion block with exhaust system turned on.
− Switch scrubber system on and switch the main switch into “I” position.
− Turn on digestion block and heat up to 4% energy first, then 25%, 40% and 80% (about 370oC)
− Let samples digest until white fumes can be seen. When heating energy level reaches 80%,
continue heating for about 60 – 90 minutes. The samples should be transparent with no charred material remaining.
− Take samples off the digestion block and hang them on hanging rack and allow to cool. When
lifting the rack, remember to lift all the system otherwise acid evaporation can be a risk.
− Dilute digest with 50 ml of distilled water. Swirl each tube. lOMoAR cPSD| 58562220 3.2.Distillation
− Start-up distillation system follows instruction manual: Rinse the distillation block throughout
using distilled water automatically pumped by the system (Program 0).
Note: Program O is applied when starting the new measurement and finishing a measurement.
− Add 50 ml H3BO3 4% into the 500 ml receiving flask.
− Insert the digestion tube and receiving flask into distillation block.
− Start measurement (Program 1):
+ Automatically pump 50 ml NaOH to digestion tube
+ Heat the digestion sample to boiling point.
+ Distill sample for 8 minutes. 3. 3.Titration Use a colorimetric endpoint:
− Fill 25 ml burette with H2SO4 0.1 N solution; record the initial volume
− Assemble burette into ring stand
− Place the receiving flask after distillation under the burette
− Add some Tashiro indicator into the flask before titrating
− Titrate each sample and blank with the H2SO4 0.1 N solution to the color before distillation
process. Record volume of H2SO4 0.1 N solution used. 4. Calculation
𝐶𝑜𝑟𝑟𝑒𝑐𝑡𝑒𝑑 𝑎𝑐𝑖𝑑 𝑣𝑜𝑙𝑢𝑚𝑒 (𝐿)
14 𝑔 𝑁 𝑊𝑒𝑖𝑔ℎ𝑡 𝑜𝑓
𝑠𝑎𝑚𝑝𝑙𝑒 (𝑔) 𝑚𝑜𝑙
%𝑁 = 𝑁𝑜𝑟𝑚𝑎𝑙𝑖𝑡𝑦 𝐻𝑠𝑆𝑂4 𝑥 𝑥 𝑥 100
%Protein = %N x Protein factor 5. Questions
1. Calculate the percent nitrogen and the percent protein, wet weight basis (wwb) and dry weight
basis (dwb). Assume moisture content of 10%. Use 6.25 for the nitrogen to protein conversion factor. (20%) lOMoAR cPSD| 58562220
2. Compare with those on the label. (10%)
3. Could phenolphthalein be used as an indicator in the Kjeldahl titration? Why or why not? (10%)
4. Describe the function of the following chemicals used in this determination. (20%) a) Catalyst pellet b) Borate c) H2SO4 d) NaOH
5. Why was it not necessary to standardize the boric acid solution? (10%)
6. For each of the disadvantages of the Kjeldahl method, give another protein analysis method that
overcomes that disadvantage. (20%)
7. Lab-work behavior and participation. (10%) 6. References
AOAC International. (2007). Method 960 :52 (Micro-Kjeldahl method) and Method 992.23
(Genetic combustion method). Official methods of analysis (18th ed.). AOAC International, Gaithersburg, MD.
Nielsen, S. S. (2010). Protein analysis. Food analysis, 9, 47-53.
Nielsen, S. S. (2010). Protein nitrogen determination. Food analysis laboratory manual, 39-45.
Hung, P. V. (n.d.). Food analysis lab manual. Ho Chi Minh, International University, Vietnam National University HCMC. LABORATORY 5
DETERMINATION OF TOTAL CARBOHYDRATE IN FOODS 1. Objective
Determine the total carbohydrate content of soft drinks and beers. 2.
Materials and equipment lOMoAR cPSD| 58562220
− Beer, regular; opened and stored in 10 oC − Test tube rack fridge over night
− Volumetric flasks, 1000 ml Volumetric pipette, 5 ml − −
Soft drink, regular; opened and stored 10oC Volumetric pipettes, 10 ml fridge over night − − Spectrophotometer
− Erlenmeyer flask, 100 ml, for distilled water − Vortex mixer
− Erlenmeyer flasks, 500 ml, for
− Water bath, maintained at 25 oC beverages
− Mechanical pipettes, 5000 μm, 1000 − Bottle to collect waste
μm and 100 μm (or 200 μm), with plastic
− Cuvettes for spectrophotometer tips − Gloves
− Test tubes, 16-20 mm internal diameter 3. Procedure
3.1.Prepare standard curve tubes
− Use the glucose standard solution (100 mg glucose/L) and distilled water as indicated in the table below:
Table 1. Concentration of standard curve. μg glucose/ml 0 20 40 60 80 100
Volume of glucose stock
solution (100 μg/ml) (ml) 0 2 4 6 8 10
Volume of distilled water (ml) 10 8 6 4 2 0
− Record caloric content from labels of soft drinks and beers. 3.
2.Prepare sample tubes
− Dilute sample tubes as 1:2000 dilution by taking
+ 1 ml sample + 9 ml distilled water 10ml A (dilute 10 times)
+ 1 ml A + 9 ml distilled water 10ml B (dilute 100 times)
+ 0.5 ml B + 9.5 ml distilled water 10ml C (dilute 2000 times) lOMoAR cPSD| 58562220
− Then pipette 1.0 ml sample and 1.0 ml of distilled water into a test tube.
Note: Phenol and H2SO4 additions are carried out in a hood with fan on.
− Phenol addition: add 0.05 ml 80 % phenol to each tube of Standard curve tubes and Sample
tubes containing a total volume of 2 ml.
− H2SO4 addition: after adding phenol, add 5.0 ml H2SO4 to each tube. Mix in a Vortex test tube mixer.
− Let tubes stand for 10 min to cool them to room temperature. Vortex.
− Reading absorbance: transfer samples from test tubes into cuvettes. Do not rinse cuvettes with water between samples.
− Zero the spectrophotometer with the blank.
− Read absorbance of all other samples at 490 nm. − Triplicate. 4. Questions
1. Construct a standard curve for your total carbohydrate determinations, expressed in terms of
glucose (A490 versus μg glucose/ 2 ml). Determine the equation of the line for the standard curve. (20%)
2. Calculate the concentration of glucose in your soft drink samples and beer samples in terms of g/L. (20%)
3. Calculate the caloric content (based only on carbohydrate content) of your soft drink samples and
beer samples in terms of Cal/L and compare to the label. Explain any differences. (30%)
4. Compare and explain any differences between the calories that carbohydrates contributed to soft drinks and to beers. (20%)
5. Lab-work behavior and participation. (10%) 7. References
BeMiller, J. N. (2017). Carbohydrate analysis. Food analysis, 333-360.
DuBois, M., Gilles, K. A., Hamilton, J. K., Rebers, P. T., & Smith, F. (1956). Colorimetric method
for determination of sugars and related substances. Analytical chemistry, 28(3), 350-356. Nielsen, S.
S. (2010). Phenol-sulfuric acid method for total carbohydrates. Food analysis laboratory manual, 47- 53. lOMoAR cPSD| 58562220
Hung, P. V. (n.d.). Food analysis lab manual. Ho Chi Minh, International University, Vietnam National University HCMC.
Tài liệu liên quan:
-
Lab Manual and Procedures Guide | Môn Food Analysis - Trường Đại học Quốc tế, Đại học Quốc gia Thành phố Hồ Chí Minh
100 50 -
Study on Milk Sterilization Methods and Their Effects on Quality | Môn Food Analysis - Trường Đại học Quốc tế, Đại học Quốc gia Thành phố Hồ Chí Minh
75 38 -

New Syllabus Môn Food Analysis | Trường Đại học Quốc tế, Đại học Quốc gia Thành phố Hồ Chí Minh
93 47 -
Giáo trình học phần Food Analysis | Trường Đại học Quốc tế, Đại học Quốc gia Thành phố Hồ Chí Minh
276 138