Rebuilding Reliable Data Pipelines Through Modern Tools - Đồ họa máy tính | Đại học Bách Khoa, Đại học Đà Nẵng
Rebuilding Reliable Data Pipelines Through Modern Tools - Đồ họa máy tính | Đại học Bách Khoa, Đại học Đà Nẵng giúp sinh viên tham khảo, ôn luyện và phục vụ nhu cầu học tập của mình cụ thể là có định hướng, ôn tập, nắm vững kiến thức môn học và làm bài tốt trong những bài kiểm tra, bài tiểu luận, bài tập kết thúc học phần, từ đó học tập tốt và có kết quả cao cũng như có thể vận dụng tốt những kiến thức mình đã học
Môn: Đồ họa máy tính (DHMT20) 22 tài liệu
Trường: Trường Đại học Bách khoa, Đại học Đà Nẵng 1.7 K tài liệu
Tác giả:


Preview text:
Rebuilding Reliable Data Pipelines Through Modern Tools Ted Malaska
with the assistance of Shivnath Babu REPORT Rebuilding Reliable Data Pipelines Through Modern Tools Ted Malaska
with the assistance of Shivnath Babu Be B iejing n Bo B s o tso t n o Fa F ran r h n a h m a Se S b e a b satsotp o o p lo To T k o y k o y
Rebuilding Reliable Data Pipelines Through Modern Tools by Ted Malaska
Copyright © 2019 O’Reil y Media. Al rights reserved.
Printed in the United States of America.
Published by O’Reil y Media, Inc., 1005 Gravenstein Highway North, Sebastopol, CA 95472.
O’Reil y books may be purchased for educational, business, or sales promotional use.
Online editions are also available for most titles (http://oreil y.com). For more infor‐
mation, contact our corporate/institutional sales department: 800-998-9938 or corporate@oreil y.com.
Acquisitions Editor: Jonathan Hassel
Proofreader: Sonia Saruba
Development Editor: Corbin Col ins
Interior Designer: David Futato
Production Editor: Christopher Faucher
Cover Designer: Karen Montgomery
Copyeditor: Octal Publishing, LLC
Il ustrator: Rebecca Demarest June 2019: First Edition
Revision History for the First Edition 2019-06-25: First Release 2019-07-25: Second Release
The O’Reil y logo is a registered trademark of O’Reil y Media, Inc. Rebuilding Relia‐
ble Data Pipelines Through Modern Tools, the cover image, and related trade dress
are trademarks of O’Reil y Media, Inc.
The views expressed in this work are those of the author, and do not represent the
publisher’s views. While the publisher and the author have used good faith efforts to
ensure that the information and instructions contained in this work are accurate, the
publisher and the author disclaim al responsibility for errors or omissions, includ‐
ing without limitation responsibility for damages resulting from the use of or reli‐
ance on this work. Use of the information and instructions contained in this work is
at your own risk. If any code samples or other technology this work contains or
describes is subject to open source licenses or the intel ectual property rights of oth‐
ers, it is your responsibility to ensure that your use thereof complies with such licen‐ ses and/or rights.
This work is part of a col aboration between O’Reil y and Unravel. See our statement of editorial independence. 978-1-492-05816-8 [LSI] Table of Contents
1. Introduction. . . . . . . . . . . . . . . . . . . . . . . . . . . . . . . . . . . . . . . . . . . . . . . . 1 Who Should Read This Book? 2
Outline and Goals of This Book 4
2. How We Got Here. . . . . . . . . . . . . . . . . . . . . . . . . . . . . . . . . . . . . . . . . . . . 7 Excel Spreadsheets 7 Databases 8 Appliances 9
Extract, Transform, and Load Platforms 10
Kafka, Spark, Hadoop, SQL, and NoSQL platforms 12
Cloud, On-Premises, and Hybrid Environments 13
Machine Learning, Artificial Intel igence, Advanced
Business Intel igence, Internet of Things 14
Producers and Considerations 14
Consumers and Considerations 16 Summary 18
3. The Data Ecosystem Landscape. . . . . . . . . . . . . . . . . . . . . . . . . . . . . . . 21
The Chef, the Refrigerator, and the Oven 21
The Chef: Design Time and Metadata Management 23
The Refrigerator: Publishing and Persistence 24
The Oven: Access and Processing 27
Ecosystem and Data Pipelines 37 Summary 38
4. Data Processing at Its Core. . . . . . . . . . . . . . . . . . . . . . . . . . . . . . . . . . . 39 What Is a DAG? 39 i i Single-Job DAGs 40 Pipeline DAGs 50 Summary 53
5. Identifying Job Issues. . . . . . . . . . . . . . . . . . . . . . . . . . . . . . . . . . . . . . . 55 Bottlenecks 55 Failures 64 Summary 67
6. Identifying Workflow and Pipeline Issues. . . . . . . . . . . . . . . . . . . . . . 69
Considerations of Budgets and Isolations 70 Container Isolation 71 Process Isolation 75
Considerations of Dependent Jobs 76 Summary 77
7. Watching and Learning from Your Jobs. . . . . . . . . . . . . . . . . . . . . . . . 79
Culture Considerations of Col ecting Data Processing Metrics 79 What Metrics to Col ect 81
8. Closing Thoughts. . . . . . . . . . . . . . . . . . . . . . . . . . . . . . . . . . . . . . . . . . . 91 iv | Table of Contents CHAPTER 1 Introduction
Back in my 20s, my wife and I started running in an attempt to fight
our ever-slowing metabolism as we aged. We had never been very
athletic growing up, which comes with the lifestyle of being com‐ puter and video game nerds.
We encountered many issues as we progressed, like injury, consis‐
tency, and running out of breath. We fumbled along making smal
gains and wins along the way, but there was a point when we deci‐
ded to ask for external help to see if there was more to learn.
We began reading books, running with other people, and running in
races. From these efforts we gained perspective on a number of
areas that we didn’t even know we should have been thinking about.
The perspectives al owed us to understand and interpret the pains
and feelings we were experiencing while we ran. This input became
our internal monitoring and alerting system.
We learned that shin splints were mostly because of old shoes land‐
ing wrong when our feet made contact with the ground. We learned
to gauge our sugar levels to better inform our eating habits.
The result of understanding how to run and how to interpret the
signals led us to quickly accelerate our progress in becoming better
runners. Within a year we went from counting the blocks we could
run before getting winded to finishing our first marathon.
It is this idea of understanding and signal reading that is core to this
book, applied to data processing and data pipelines. The idea is to
provide a high- to mid-level introduction to data processing so that 1
you can take your business intel igence, machine learning, near-real-
time decision making, or analytical department to the next level. Who Should Read This Book?
This book is for people running data organizations that require data
processing. Although I dive into technical details, that dive is
designed primarily to help higher-level viewpoints gain perspective
on the problem at hand. The perspectives the book focuses on
include data architecture, data engineering, data analysis, and data
science. Product managers and data operations engineers can also gain insight from this book. Data Architects
Data architects look at the big picture and define concepts and ideas
around producers and consumers. They are visionaries for the data
nervous system for a company or organization. Although I advise
architects to code at least 50% of the time, this book does not
require that. The goal is to give an architect enough background
information to make strong cal s, without going too much into the
details of implementation. The ideas and patterns discussed in this
book wil outlive any one technical implementation. Data Engineers
Data engineers are in the business of moving data—either getting it
from one location to another or transforming the data in some man‐
ner. It is these hard workers who provide the digital grease that
makes a data project a reality.
Although the content in this book can be an overview for data engi‐
neers, it should help you see parts of the picture you might have pre‐
viously overlooked or give you fresh ideas for how to express problems to nondata engineers. Data Analysts
Data analysis is normal y performed by data workers at the tail end
of a data journey. It is normal y the data analyst who gets the oppor‐
tunity to generate insightful perspectives on the data, giving compa‐
nies and organizations better clarity to make decisions.
2 | Chapter 1: Introduction
This book wil hopeful y give data analysts insight into al the com‐
plex work it takes to get the data to you. Also, I am hopeful it wil
give you some insight into how to ask for changes and adjustments to your existing processes. Data Scientists
In a lot of ways, a data scientist is like a data analyst but is looking to
create value in a different way. Where the analyst is normal y about
creating charts, graphs, rules, and logic for humans to see or exe‐
cute, the data scientist is mostly in the business of training machines through data.
Data scientists should get the same out of this book as the data ana‐
lyst. You need the data in a repeatable, consistent, and timely way.
This book aims to provide insight into what might be preventing
your data from getting to you in the level of service you expect. Product Managers
Being a product manager over a business intel igence (BI) or data-
processing organization is no easy task because of the highly techni‐
cal aspect of the discipline. Traditional y, product managers work on
products that have customers and produce customer experiences.
These traditional markets are normal y related to interfaces and user interfaces.
The problem with data organizations is that sometimes the custom‐
er’s experience is difficult to see through al the details of workflows,
streams, datasets, and transformations. One of the goals of this book
with regard to product managers is to mark out boxes of customer
experience like data products and then provide enough technical
knowledge to know what is important to the customer experience
and what are the details of how we get to that experience.
Additional y, for product managers this book dril s down into a lot
of cost benefit discussions that wil add to your library of skil s.
These discussions should help you decide where to focus good
resources and where to just buy more hardware. Data Operations Engineers
Another part of this book focuses on signals and inputs, as men‐
tioned in the running example earlier. If you haven’t read Site
Who Should Read This Book? | 3
Reliability Engineering (O’Reil y), I highly recommend it. Two
things you wil find there are the passion and possibility for great‐
ness that comes from listening to key metrics and learning how to
automate responses to those metrics.
Outline and Goals of This Book
This book is broken up into eight chapters, each of which focuses on
a set of topics. As you read the chapter titles and brief descriptions
that fol ow, you wil see a flow that looks something like this:
• The ten-thousand-foot view of the data processing landscape
• A slow descent into details of implementation value and issues you wil confront
• A pul back up to higher-level terms for listening and reacting to signals Chapter 2: How We Got Here
The mindset of an industry is very important to understand if you
intend to lead or influence that industry. This chapter travels back to
the time when data in an Excel spreadsheet was a huge deal and
shows how those early times are stil affecting us today. The chapter
gives a brief overview of how we got to where we are today in the
data processing ecosystem, hopeful y providing you insight regard‐
ing the original drivers and expectations that stil haunt the industry today.
Chapter 3: The Data Ecosystem Landscape
This chapter talks about data ecosystems in companies, how they are
separated, and how these different pieces interact. From that per‐
spective, I focus on processing because this book is about processing
and pipelines. Without a good understanding of the processing role
in the ecosystem, you might find yourself solving the wrong problems.
Chapter 4: Data Process at Its Core
This is where we descend from ten thousand feet in the air to about
one thousand feet. Here we take a deep dive into data processing
4 | Chapter 1: Introduction
and what makes up a normal data processing job. The goal is not to
go into details of code, but I get detailed enough to help an architect
or a product manager be able to understand and speak to an engi‐
neer writing that detailed code.
Then we jump back up a bit and talk about processing in terms of
data pipelines. By now you should understand that there is no magic
processing engine or storage system to rule them al . Therefore,
understanding the role of a pipeline and the nature of pipelines wil
be key to the perspectives on which we wil build.
Chapter 5: Identifying Job Issues
This chapter looks at al of the things that can go wrong with data
processing on a single job. It covers the sources of these problems,
how to find them, and some common paths to resolve them.
Chapter 6: Identifying Workflow and Pipeline Issues
This chapter builds on ideas expressed in Chapter 5 but from the
perspective of how they relate to groups of jobs. While making one
job work is enough effort on its own, now we throw in hundreds or
thousands of jobs at the same time. How do you handle isolation, concurrency, and dependencies?
Chapter 7: Watching and Learning from Your Jobs
Now that we know tons of things can go wrong with your jobs and
data pipelines, this chapter talks about what data we want to col ect
to be able to learn how to improve our operations.
After we have col ected al the data on our data processing opera‐
tions, this chapter talks about al the things we can do with that data,
looking from a high level at possible insights and approaches to give
you the biggest bang for your buck. Chapter 8: Closing Thoughts
This chapter gives a concise look at where we are and where we are
going as an industry with al of the context of this book in place. The
goal of these closing thoughts is to give you hints to where the future
might lie and where fil -in-the-gaps solutions wil likely be short lived.
Outline and Goals of This Book | 5 CHAPTER 2 How We Got Here
Let’s begin by looking back and gaining a little understanding of the
data processing landscape. The goal here wil be to get to know some
of the expectations, players, and tools in the industry.
I’l first run through a brief history of the tools used throughout the
past 20 years of data processing. Then, we look at producer and con‐
sumer use cases, fol owed by a discussion of the issue of scale. Excel Spreadsheets
Yes, we’re talking about Excel spreadsheets—the software that ran
on 386 Intel computers, which had nearly zero computing power
compared to even our cel phones of today.
So why are Excel spreadsheets so important? Because of expecta‐
tions. Spreadsheets were and stil are the first introduction into data
organization, visualization, and processing for a lot of people. These
first impressions leave lasting expectations on what working with
data is like. Let’s dig into some of these aspects: Visualization
We take it for granted, but spreadsheets al owed us to see the
data and its format and get a sense of its scale. Functions
Group By, Sum, and Avg functions were easy to add and returned in real time. 7 Graphics
Getting data into graphs and charts was not only easy but pro‐
vided quick iteration between changes to the query or the dis‐ plays. Decision making
Advanced Excel users could make functions that would flag
cel s of different colors based on different rule conditions.
In short, everything we have today and everything discussed here is
meant to echo this spreadsheet experience as the data becomes big‐ ger and bigger. Databases
After the spreadsheet came database generation, which included
consumer technology like Microsoft Access database as wel as big
corporate winners like Oracle, SQL Server, and Db2, and their mar‐
ket disruptors such as MySQL and PostgreSQL.
These databases al owed spreadsheet functionality to scale to new
levels, al owing for SQL, which gives an access pattern for users and
applications, and transactions to handle concurrency issues.
For a time, the database world was magical and was a big part of
why the first dot-com revolution happened. However, like al good
things, databases became overused and overcomplicated. One of the
complications was the idea of third normal form, which led to stor‐
ing different entities in their own tables. For example, if a person
owned a car, the person and the car would be in different tables,
along with a third table just to represent the ownership relationship.
This arrangement would al ow a person to own zero or more than
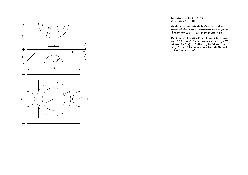
one car and a car to be owned by zero or more than one person, as shown in Figure 2-1.
Figure 2-1. Owning a car required three tables
8 | Chapter 2: How We Got Here
Although third normal form stil does have a lot of merit, its design
comes with a huge impact on performance and design. This impact
is a result of having to join the tables together to gain a higher level
of meaning. Although SQL did help with this joining complexity, it
also enabled more functionality that would later prove to cause problems.
The problems that SQL caused were not in the functionality itself. It
was making complex distributed functionality accessible by people
who didn’t understand the details of how the function would be exe‐
cuted. This resulted in functional y correct code that would perform
poorly. Simple examples of functionality that caused trouble were
joins and windowing. If poorly designed, they both would result in
more issues as the data grew and the number of involved tables increased.
More entities resulted in more tables, which led to more complex
SQL, which led to multiple thousand-line SQL code queries, which
led to slower performance, which led to the birth of the appliance. Appliances
Oh, the memories that pop up when I think about the appliance
database. Those were fun and interesting times. The big idea of an
appliance was to take a database, distribute it across many nodes on
many racks, charge a bunch of money for it, and then everything would be great!
However, there were several problems with this plan: Distribution experience
The industry was stil young in its understanding of how to
build a distributed system, so a number of the implementations were less than great. High-quality hardware
One side effect of the poor distribution experience was the fact
that node failure was highly disruptive. That required process‐
ing systems with extra backups and redundant components like
power supplies—in short, very tuned, tailored, and pricey hardware. Appliances | 9
Place and scale of bad SQL
Even the additional nodes with al the processing power they
offered could not overcome the rate at which SQL was being
abused. It became a race to add more money to the problem,
which would bring short-term performance benefits. The bene‐
fits were short lived, though, because the moment you had more
processing power, the door was open for more abusive SQL.
The cycle would continue until the cost became a problem. Data sizes increasing
Although in the beginning the increasing data sizes meant more
money for vendors, at some point the size of the data outpaced
the technology. The outpacing mainly came from the advent of
the internet and al that came along with it. Double down on SQL
The once-simple SQL language would grow more and more
complex, with advanced functions like windowing functions
and logical operations like PL/SQL.
Al of these problems together led to disil usionment with the appli‐
ance. Often the experience was great to begin with, but then became
expensive and slow and costly as the years went on.
Extract, Transform, and Load Platforms
One attempt to fix the problem with appliances was to redefine the
role of the appliance. The argument was that appliances were not the
problem. Instead, the problem was SQL, and data became so com‐
plex and big that it required a special tool for transforming it.
The theory was that this would save the appliance for the analysts
and give complex processing operations to something else. This approach had three main goals:
• Give analysts a better experience on the appliance
• Give the data engineers building the transformational code a new toy to play with
• Al ow vendors to define a new category of product to sel
10 | Chapter 2: How We Got Here The Processing Pipeline
Although it most likely existed before the advent of the Extract,
Transform, and Load (ETL) platforms, it was the ETL platforms that
pushed pipeline engineering into the forefront. The idea with a pipe‐
line is now you had to have many jobs that could run on different
systems or use different tools to solve a single goal, as il ustrated in Figure 2-2.
Figure 2-2. Pipeline example
The idea of the pipeline added multiple levels of complexity into the process, like the fol owing: Which system to use
Figuring out which system did which operation the best. Transfer cost
Understanding the extraction and load costs.
Extract, Transform, and Load Platforms | 11 Scheduling resources
Dealing with schedules from many different systems, creating a
quest to avoid bottlenecks and log jams. Access rights
Whenever you leave a system and interact with external sys‐
tems, access control always becomes an interesting topic.
However, for al its complexity, the pipeline real y opened the door
for everything that fol owed. No more was there an expectation that
one system could solve everything. There was now a global under‐
standing that different systems could optimize for different opera‐
tions. It was this idea that exploded in the 2000s into the open
source big data revolution, which we dig into next.
Kafka, Spark, Hadoop, SQL, and NoSQL platforms
With the advent of the idea that the appliance wasn’t going to solve
al problems, the door was open for new ideas. In the 2000s, internet
companies took this idea to heart and began developing systems that
were highly tuned for a subset of use cases. These inventions
sparked an open source movement that created a lot of the founda‐
tions we have today in data processing and storage. They flipped everything on its head: Less complexity
If many tables caused trouble, let’s drop them al and go to one
table with nested types (NoSQL). Embrace failure
Drop the high-cost hardware for commodity hardware. Build
the system to expect failure and just recover.
Separate storage from compute logical y
Before, if you had an appliance, you used its SQL engine on its
data store. Now the store and the engine could be made sepa‐
rately, al owing for more options for processing and future proofing. Beyond SQL
Where the world of the corporate databases and appliances was
based on SQL, this new system al owed a mix of code and SQL.
12 | Chapter 2: How We Got Here
For better or worse, it raised the bar of the level of engineer that could contribute.
However, this whole exciting world was built on optimizing for
given use cases, which just doubled down on the need for data pro‐
cessing through pipelines. Even today, figuring out how to get data
to the right systems for storage and processing is one of the most difficult problems to solve.
Apart from more complex pipelines, this open source era was great
and powerful. Companies now had little limits of what was techni‐
cal y possible with data. For 95% of the companies in the world,
their data would never reach a level that would ever stress these new
breeds of systems if used correctly.
It is that last point that was the issue and the opportunity: if they
were used correctly. The startups that built this new world designed
for a skil level that was not common in corporations. In the low-
skil , high-number-of-consultants culture, this resulted in a host of
big data failures and many dreams lost.
This underscores a major part of why this book is needed. If we can
understand our systems and use them correctly, our data processing
and pipeline problems can be resolved.
It’s fair to say that after 2010 the problem with data in companies is
not a lack of tools or systems, but a lack of coordination, auditing, vision, and understanding.
Cloud, On-Premises, and Hybrid Environments
As the world was just starting to understand these new tools for big
data, the cloud changed everything. I remember when it happened.
There was a time when no one would give an online merchant com‐
pany their most valuable data. Then boom, the CIA made a ground‐
breaking decision and picked Amazon to be its cloud provider over
the likes of AT&T, IBM, and Oracle. The CIA was fol owed by
FINRA, a giant regulator of US stock transitions, and then came
Capital One, and then everything changed. No one would question the cloud again.
The core technology real y didn’t change much in the data world,
but the cost model and the deployment model did, with the result of
doubling down on the need for more high-quality engineers. The
Cloud, On-Premises, and Hybrid Environments | 13
better the system, the less it would cost, and the more it would be
up. In a lot of cases, this metric could differ by 10 to 100 times.
Machine Learning, Artificial Intel igence,
Advanced Business Intel igence, Internet of Things
That brings us to today. With the advent of machine learning and
artificial intel igence (AI), we have even more specialized systems,
which means more pipelines and more data processing.
We have al the power, logic, and technology in the world at our fin‐
gertips, but it is stil difficult to get to the goals of value. Addition‐
al y, as the tools ecosystem has been changing, so have the goals and the rewards.
Today, we can get real-time information for every part of our busi‐
ness, and we can train machines to react to that data. There is a clear
understanding that the companies that master such things are going
to be the ones that live to see tomorrow.
However, the majority of problems are not solved by more PhDs or
pretty charts. They are solved better by improving the speed of
development, speed of execution, cost of execution, and freedom to iterate.
Today, it stil takes a high-quality engineer to implement these solu‐
tions, but in the future, there wil be tools that aim to remove the
complexity of optimizing your data pipelines. If you don’t have the
background to understand the problems, how wil you be able to
find these tools that can fix these pains correctly?
Producers and Considerations
For producers, a lot has changed from the days of manual y entering
data into spreadsheets. Here are a number of ways in which you can
assume your organization needs to take in data: File dropping
This is the act of sending data in units of files. It’s very common
for moving data between organizations. Even though streaming
is the cool, shiny option, the vast majority of today’s data is stil
sent in batch file submission over intervals greater than an hour.
14 | Chapter 2: How We Got Here Streaming
Although increasing in popularity within companies, streaming
is stil not super common between companies. Streaming offers
near-real-time (NRT) delivery of data and the opportunity to
make decisions on information sooner.
Internet of Things (IoT)
A subset of streaming, IoT is data created from devices, applica‐
tions, and microservices. This data normal y is linked to high- volume data from many sources.
EmailBelieve it or not, a large amount of data between groups and
companies is stil submitted over good old-fashioned email as attachments.
Database Change Data Capture (CDC)
Either through querying or reading off a database’s edit logs, the
mutation records produced by database activity can be an
important input source for your data processing needs. Enrichment
This is the act of mutating original data to make new datasets.
There are several ways in which data can be enriched:
• Data processing: Through transformation workflow and jobs
• Data tagging/labeling: Normal y human or AI labeling to
enrich data so that it can be used for structured machine learning
• Data tracing: Adding lineage metadata to the underlying data
The preceding list is not exhaustive. There are many more ways to
generate new or enriched datasets. The main goal is to figure out
how to represent that data. Normal y it wil be in a data structure
governed by a schema, and it wil be data processing workflows that
get your data into this highly structured format. Hence, if these
workflows are the gateway to making your data clean and readable,
you need these jobs to work without fail and at a reasonable cost profile.
Producers and Considerations | 15
What About Unstructured Data and Schemas?
Some wil say, “Unstructured data doesn’t need a schema.” And they
are partly right. At a minimum, an unstructured dataset would have
one field: a string or blob field cal ed body or content.
However, unstructured data is normal y not alone. It can come with
the fol owing metadata that makes sense to store alongside the body/content data: Event time The time the data was created. Source
Where the data came from. Sometimes, this is an IP, region, or maybe an application ID. Process time
The time the data was saved or received.
Consider the bal oon theory of data processing work: there is N
amount of work to do, and you can either say I’m not going to do it
when we bring data in or you can say I’m not going to do it when I read the data.
The only option you don’t have is to make the work go away. This
leaves two more points to address: the number of writers versus
readers, and the number of times you write versus the number of times you read.
In both cases you have more readers, and readers read more often.
So, if you move the work of formatting to the readers, there are
more chances for error and waste of execution resources.
Consumers and Considerations
Whereas our producers have become more complex over the years,
our consumers are not far behind. No more is the single consumer
of an Excel spreadsheet going to make the cut. There are more tools
and options for our consumers to use and demand. Let’s briefly look
at the types of consumers we have today:
16 | Chapter 2: How We Got Here SQL users
This group makes up the majority of SQL consumers. They live
and breathe SQL, normal y through Java Database Connectivity
(JDBC)/Open Database Connectivity (ODBC) on desktop
development environments cal ed Integrated Development
Environments (IDEs). Although these users can produce group
analytical data products at high speeds, they also are known to
write code that is less than optimal, leading to a number of the
data processing concerns that we discuss later in this book. Advanced users
This a smal er but growing group of consumers. They are sepa‐
rated from their SQL-only counterparts because they are
empowered to use code alongside SQL. Normal y, this code is
generated using tools like R, Python, Apache Spark, and more.
Although these users are normal y more technical than their
SQL counterparts, they too wil produce jobs that perform sub‐
optimal y. The difference here is that the code is normal y more
complex, and it’s more difficult to infer the root cause of the performance concerns. Report users
These are normal y a subset of SQL users. Their primary goal in
life is to create dashboards and visuals to give management
insight into how the business is functioning. If done right, these
jobs should be simple and not induce performance problems.
However, because of the visibility of their output, the failure of
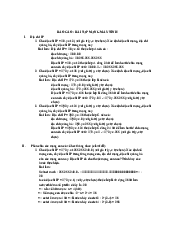
these jobs can produce unwanted attention from upper management. Inner-loop applications
These are applications that need data to make synchronous
decisions (Figure 2-3). These decisions can be made through
coded logic or trained machine learning models. However, they
both require data to make the decision, so the data needs to be
accessible in low latencies and with high guarantees. To reach
this end, normal y a good deal of data processing is required ahead of time.
Consumers and Considerations | 17
Figure 2-3. Inner-loop execution Outer-loop applications
These applications make decisions just like their inner-loop
counterparts, except they execute them asynchronously, which
offers more latency of data delivery (Figure 2-4).
Figure 2-4. Outer-loop execution Summary
You should now have a sense of the history that continues to shape
every technical decision in today’s ecosystem. We are stil trying to
solve the same problems we aimed to address with spreadsheets,
except now we have a web of specialized systems and intricate webs
of data pipelines that connect them al together.
18 | Chapter 2: How We Got Here
The rest of the book builds on what this chapter talked about, in topics like the fol owing:
• How to know whether we are processing wel
• How to know whether we are using the right tools
• How to monitor our pipelines
Remember, the goal is not to understand a specific technology, but
to understand the patterns involved. It is these patterns in process‐
ing and pipelines that wil outlive the technology of today, and,
unless physics changes, the patterns you learn today wil last for the
rest of your professional life. Summary | 19 CHAPTER 3
The Data Ecosystem Landscape
This chapter focuses on defining the different components of today’s
data ecosystem environments. The goal is to provide context for
how our problem of data processing fits within the data ecosystem as a whole.
The Chef, the Refrigerator, and the Oven
In general, al modern data ecosystems can be divided into three
metaphorical groups of functionality and offerings:
ChefResponsible for design and metamanagement. This is the mind
behind the kitchen. This person decides what food is bought
and by what means it should be delivered. In modern kitchens
the chef might not actual y do any cooking. In the data ecosys‐
tem world, the chef is most like design-time decisions and a
management layer for al that is happening in the kitchen. Refrigerator
Handles publishing and persistence. This is where food is
stored. It has preoptimized storage structures for fruit, meat,
vegetables, and liquids. Although the chef is the brains of the
kitchen, the options for storage are given to the chef. The chef
doesn’t redesign a different refrigerator every day. The job of the
fridge is like the data storage layer in our data ecosystem: keep
the data safe and optimized for access when needed. 21
OvenDeals with access and processing. The oven is the tool in which
food from the fridge is processed to make quality meals while
producing value. In this relation, the oven is an example of the
processing layer in the data ecosystem, like SQL; Extract, Trans‐
form, and Load (ETL) tools; and schedulers.
Although you can divide a data ecosystem differently, using these
three groupings al ows for clean interfaces between the layers,
affording you the most optimal enterprise approach to dividing up
the work and responsibility (see Figure 3-1).
Figure 3-1. Data ecosystem organizational separation
Let’s quickly dril down into these interfaces because some of them
wil be helpful as we focus on access and processing for the remain‐ der of this book:
• Meta ← Processing: Auditing
• Meta → Processing: Discovery
• Processing ← Persistence: Access (normal y through SQL inter‐ faces)
• Processing → Persistence: Generated output
• Meta → Persistence: What to persist
• Meta ← Persistence: Discover what else is persisted
The rest of this chapter dril s down one level deeper into these three
functional areas of the data ecosystem. Then, it is on to Chapter 4,
which focuses on data processing.
22 | Chapter 3: The Data Ecosystem Landscape
The Chef: Design Time and Metadata Management
Design time and metadata management is al the rage now in the
data ecosystem world for two main reasons: Reducing time to value
Helping people find and connect datasets on a meaningful level
to reduce the time it takes to discover value from related datasets. Adhering to regulations
Auditing and understanding your data can alert you if the data
is being misused or in danger of being wrongly accessed.
Within the chef’s domain is a wide array of responsibilities and
functionality. Let’s dig into a few of these to help you understand the chef’s world:
Creating and managing datasets/tables
The definition of fields, partitioning rules, indexes, and such.
Normal y offers a declarative way to define, tag, label, and describe datasets.
Discovering datasets/tables
For datasets that enter your data ecosystem without being
declaratively defined, someone needs to determine what they
are and how they fit in with the rest of the ecosystem. This is
normal y cal ed scraping or curling the data ecosystem to find signs of new datasets. Auditing
Finding out how data entered the ecosystem, how it was
accessed, and which datasets were sources for newer datasets. In
short, auditing is the story of how data came to be and how it is used. Security
Normal y, defining security sits at the chef’s level of control.
However, the implementation of security is normal y imple‐
mented in either the refrigerator or the oven. The chef is the
one who must not only give and control the rules of security,
but must also have ful access to know the existing securities given.
The Chef: Design Time and Metadata Management | 23
The Refrigerator: Publishing and Persistence
The refrigerator has been a longtime favorite of mine because it is
tightly linked to cost and performance. Although this book is pri‐
marily about access and processing, that layer wil be highly affected
by how the data is stored. This is because in the refrigerator’s world,
we need to consider trade-offs of functionality like the fol owing: Storage formats
This could be storage in a database or as files. Both wil affect
data size, read patterns, read speeds, and accessibility. Compression
There are a number of compression options, some slower to
write, some slower to read. JSON and comma-separated values
(CSV)—the formats normal y most common for data—can be
compressed beyond 80% or 90%. Compression is a big deal for
cost, transmission, and to reduce disk input/output (I/O). Indexing
Indexing in general involves direction to the data you want to
find. Without indexing, you must scan through large subsec‐
tions of your data to find what you are looking for. Indexing is
like a map. Imagine trying to find a certain store in the mal
without a map. Your only option would be to walk the entire
mal until you luckily found the store you were looking for. Reverse indexing
This is commonly used in tools like Elasticsearch and in the
technology behind tech giants like Google. This is metadata
about the index, al owing not only fast access to pointed items,
but real-time stats about al the items and methods to weigh dif‐ ferent ideas. Sorting
Putting data in order from less than to greater than is a hidden
part of almost every query you run. When you join, group by,
order by, or reduce by, under the hood there is at least one sort
in there. We sort because it is a great way to line up related
information. Think of a zipper. You just pul it up or down. Now
imagine each zipper key is a number and the numbers are scat‐
tered on top of a table. Imagine how difficult it would be to put
24 | Chapter 3: The Data Ecosystem Landscape
the zipper back together—not a joyful experience without pre‐ ordering. Streaming versus batch
Is your data one static unit that updates only once a day or is it a
stream of ever-changing and appending data? These two
options are very different and require a lot of different publish‐
ing and persistence decisions to be made. Only once
This is normal y related to the idea that data can be sent or
received more than once. For the cases in which this happens,
what should the refrigerator layer do? Should it store both
copies of the data or just hold on to one and absorb the other?
That’s just a taste of the considerations needed for the refrigerator
layer. Thankful y, a lot of these decisions and options have already
been made for you in common persistence options. Let’s quickly
look at some of the more popular tools in the data ecosystem and
how they relate to the decision factors we’ve discussed: Cassandra
This is a NoSQL database that gives you out-of-the-box, easy
access to indexing, sorting, real-time mutations, compression,
and deduplicating. It is ideal for pointed GETs and PUTs, but
not ideal for scans or aggregations. In addition, Cassandra can
moonlight as a time-series database for some interested entity- focused use cases.
KafkaKafka is a streaming pipeline with compression and durability
that is pretty good at ordering if used correctly. Although some
wish it were a database (inside joke at the confluent company),
it is a data pipe and is great for sending data to different destinations. Elasticsearch
Initial y just a search engine and storage system, but because of
how data is indexed, Elasticsearch provides side benefits of
deduplicating, aggregations, pointed GETs and PUTs (even
though mutation is not recommended), real-time, and reverse indexing.
The Refrigerator: Publishing and Persistence | 25 Database/warehouse
This is a big bucket that includes the likes of Redshift, Snow‐
flake, Teradata Database, Exadata, Google’s BigQuery, and many
more. In general, these systems aim to solve for many use cases
by optimizing for a good number of use cases with the popular
SQL access language. Although a database can solve for every
use case (in theory), in reality, each database is good at a couple
of things and not so good at others. Which things a database is
good at depends on compromises the database architecture
made when the system was built. In memory
Some systems like Druid.io, MemSQL, and others aim to be
databases but better. The big difference is that these systems can
store data in memory in hopes of avoiding one of the biggest
costs of databases: serialization of the data. However, memory
isn’t cheap, so sometimes we need to have a limited set of data
isolated for these systems. Druid.io does a great job of optimiz‐
ing for the latest data in memory and then flushing older data to
disk in a more compressed format. Time-series
Time-series databases got their start in the NoSQL world. They
give you indexing to an entity and then order time-event data
close to that entity. This al ows for fast access to al the metric
data for an entity. However, people usual y become unhappy
with time-series databases in the long run because of the lack of
scalability on the aggregation front. For example, aggregating a
mil ion entities would require one mil ion lookups and an
aggregation stage. By contrast, databases and search systems
have much less expensive ways to ask such queries and do so in a much more distributed way.
Amazon Simple Storage Service (Amazon S3)/object store
Object stores are just that: they store objects (files). You can take
an object store pretty far. Some put Apache Hive on top of their
object stores to make append-only database-like systems, which
can be ideal for low-cost scan use cases. Mutations and indexing
don’t come easy in an object store, but with enough know-how,
an object store can be made into a real database. In fact, Snow‐
flake is built on an object store. So, object stores, while being a
primary data ecosystem storage offering in themselves, are also
26 | Chapter 3: The Data Ecosystem Landscape
a fundamental building block for more complex data ecosystem storage solutions.
The Oven: Access and Processing
The oven is where food becomes something else. There is processing involved.
This section breaks down the different parts of the oven into how we
get data, how we process it, and where we process it. Getting Our Data
From the refrigerator section, you should have seen that there are a
number of ways to store data. This also means that there are a num‐
ber of ways to access data. To move data into our oven, we need to
understand these access patterns. Access considerations
Before we dig into the different types of access approaches, let’s first
take a look at the access considerations we should have in our minds as we evaluate our decisions:
Tel s us what the store is good at
Different access patterns wil be ideal for different quests. As we
review the different access patterns, it’s helpful to think about
which use cases they would be good at helping and which they wouldn’t be good at helping. Concurrence
Different access patterns al ow different volumes of different
requests at the same time. This can mean that one access pattern
is good for a smal er pool of users and another is good at sup‐
porting a larger pool of users. Isolation
The cost of access in some systems is expensive and/or it can
affect other users on that system. This is sometimes cal ed the
noisy neighbor problem or can be referred to having the level of
isolation of each request. Normal y, higher levels of concurrence
are aligned with better degrees of isolation.
The Oven: Access and Processing | 27 Accessibility
Some access patterns are easier for humans to interact with and
some are better suited for machine interaction. Paral elism
When accessing data, how many threads or systems can be
accessed at once? Do the results need to be focused into one
receiver or can the request be divided up? Access types
Let’s look at the different groupings of access patterns we have in our data ecosystem:
SQLOne of the most popular tools for analysts and machine learn‐
ing engineers for accessing data, SQL is simple and easy to
learn. However, it comes with three big problems:
• Offers too much functionality: The result of having so
many options is that users can write very complex logic in
SQL, which commonly turns out to use the underlying sys‐
tem incorrectly and adds additional cost or causes perfor‐ mance problems.
• SQL isn’t the same: Although many systems wil al ow for
SQL, not al versions, types, and extensions of SQL are
transferable from one system to another. Additional y, you
shouldn’t assume that SQL queries wil perform the same on different storage systems.
• Parallelism concerns: Paral elism and bottlenecks are two
of the biggest issues with SQL. The primary reason for this
is the SQL language was real y built to al ow for detailed
paral elism configuration or visibility. There are some ver‐
sions of SQL today that al ow for hints or configurations to
alter paral elism in different ways. However, these efforts
are far from perfect and far from universal cross-SQL implementations.
Application Programming Interface (API) or custom
As we move away from normal database and data warehouse
systems, we begin to see a divergence in access patterns. Even in
Cassandra with its CQL (a super smal subset of SQL), there is
28 | Chapter 3: The Data Ecosystem Landscape
usual y a learning curve for traditional SQL users. However,
these APIs are more tuned to the underlying system’s optimized
usage patterns. Therefore, you have less chance of getting your‐ self in trouble. Structured files
Files come in many shapes and sizes (CSV, JSON, AVRO, ORC,
Parquet, Copybook, and so on). Reimplementing code to parse
every type of file for every processing job can be very time con‐
suming and error prone. Data in files should be moved to one
of the aforementioned storage systems. We want to access the
data with more formal APIs, SQL, and/or dataframes in systems
that offer better access patterns. Streams
Streams is an example of reading from systems like Kafka, Pul‐
sar, Amazon’s Kinesis, RabbitMQ, and others. In general, the
most optimal way to read a stream is from now onward. You
read data and then acknowledge that you are done reading it.
This acknowledgement either moves an offset or fires off a com‐
mit. Just like SQL, stream APIs offer a lot of additional func‐
tionality that can get you in trouble, like moving offsets,
rereading of data over time, and more. These options can work
wel in control ed environments, but use them with care. Stay Stupid, My Friend
As we have reviewed our access types, I hope a common pattern has
grabbed your eye. Al of the access patterns offer functionality that
can be harmful to you. Additional y, some problems can be hidden
from you in low-concurrency environments. In that, if you run
them when no one else is on the system, you find that everything
runs fine. However, when you run the same job on a system with a
high level of “noisy neighbors,” you find that issues begin to arise.
The problem with these issues is that they wait to point up until you
have committed tons of resources and money to the project—then
it wil blow up in front of al the executives, fireworks style.
The laws of marketing require vendors to to add extra features to
these systems. In general, however, as a user of any system, we
should search for its core reason for existence and use the system
within that context. If we do that, we wil have a better success rate.
The Oven: Access and Processing | 29
Tài liệu liên quan:
-

Bài giảng khuếch đại cùng vi mạch khuếch đại thuật toán | Trường Đại học Bách Khoa, Đại học Đà Nẵng
278 139 -
Đề trắc nghiệm tham khảo cuối kì môn Đồ họa máy tính | Đại học Bách Khoa, Đại học Đà Nẵng
773 387 -
Tham khảo tài liệu đồ họa cuối kì 1 - Đồ họa máy tính | Đại học Bách Khoa, Đại học Đà Nẵng
553 277 -

Bài tập ôn tập thi về đồ họa máy tính có đáp án | Đại học Bách Khoa, Đại học Đà Nẵng
830 415 -
Báo cáo: Bài tập mạng máy tính | Đại học Bách Khoa, Đại học Đà Nẵng
399 200