Report: Military Logistics Optimization | Môn Probabilistic Models in Operations Research - Trường Đại học Quốc tế, Đại học Quốc gia Thành phố Hồ Chí Minh
Operation research (OR) is a scientific approach of analytical methods to improve problemsolving and decision-making. Tài liệu được sưu tầm gồm 21 trang, giúp bạn ôn tập tốt hơn. Mời các bạn đón xem.
Môn: Probabilistic Models in Operations Research 2 tài liệu
Trường: Trường Đại học Quốc tế, Đại học Quốc gia Thành phố Hồ Chí Minh 2 K tài liệu
Tác giả:


Preview text:
lOMoAR cPSD| 58097008
VIETNAM NATIONAL UNIVERSITY – HO CHI MINH CITY
INTERNATIONAL UNIVERSITY
SCHOOL OF LOGISTICS SUPPLY CHAIN & MANAGEMENT
Deterministic Models in Operations Research_G02
Lecturer: Mrs. Ha Thi Xuan Chi Group 4 PROJECT REPORT
Topic: Military Logistics
Ho Chi Minh City, Vietnam May 2024 lOMoAR cPSD| 58097008 GROUP MEMBERS No Student Name Student ID 1 Phan Kiến Quốc IELSIU22226 2 Hoàng Duy Anh IELSIU22279 3 Nguyễn Thị Thanh Hà IELSIU22270 4 Nguyễn Ngọc Bảo Trân IELSIU22350 lOMoAR cPSD| 58097008 TABLE OF CONTENTS
I. INTRODUCTION....................................................................................................................................... ....
1. Background of study...................................................................................................................................
2. Problem statement.......................................................................................................................................
3. Objectives................................................................................................................................................... .
4. Scope and Limitations.................................................................................................................................
4.1 Scope.................................................................................................................................................. .
4.2 Limitations..........................................................................................................................................
II. MATHEMATICAL MODEL/
ALGORITHMS.........................................................................................
1. Parameters...................................................................................................................................................
2. Decision variables.......................................................................................................................................
3. Objective function.......................................................................................................................................
4. Constraints..................................................................................................................................................
III. PROBLEM-SOLVING................................................................................................................................
1. CPLEX Code...............................................................................................................................................
2. Data input.................................................................................................................................................... 3. Processing and result
analysis.....................................................................................................................
IV. RESULT ANALYSIS AND DISCUSSION................................................................................................
1. Sensitivity Analysis.....................................................................................................................................
1.1. Scenario 2 ( We raise the using time of ship class 2 by 1)................................................................
1.2. Scenario 3 ( We raise the using time of ship class 3 by 1)................................................................
2. Solution Discussion.....................................................................................................................................
2.1. Comparative Analysis........................................................................................................................
2.2. Trip Utilization (z Matrix):................................................................................................................
2.3. Conclusion:........................................................................................................................................
3. Future Development....................................................................................................................................
V. REFERENCES............................................................................................................................................ ... VI. CONTRIBUTION
FORM........................................................................................................................... I. INTRODUCTION 1. Background of study
Operation research (OR) is a scientific approach of analytical methods to improve
problemsolving and decision-making. OR solves complex problems through mathematical lOMoAR cPSD| 58097008
logic, simulation, network analysis, and queuing theory. The operation research process consists of five steps:
● Identify or formulate the problems
● Construct the model for the problems with variables
● Use the model to determine the optimal solution
● Test and analyze the model ● Implement results
To find insights and solve problems, OR applications are abundant in many fields such as
scheduling, manufacturing, computer engineering, etc. This project uses OR for optimal Ship
Routing and Personnel Assignment for Naval Recruitment in Vietnam. Our approach focuses
on two problems. The first problem is the optimal assignment of draftees to branch naval bases,
formulated as a transportation problem. The second problem is the optimal routing of the
number of ships required for transporting all the draftees from the branch bases to the main
base, which is solved with an exact integer programming formulation. 2. Problem statement
Vietnam Navy recruits are drafted once a year. A draftee reports to one of 9 military regions in
a home locality and is then transported by bus to one of four (Naval Region I, II, III, IV) navy
branch bases. From there, recruits are transported to the main naval base by ship. All trips
originate from and terminate at the main base. The docking facilities at the branch bases may
restrict the type of ship that can visit a base. Three classes of ship are available as summarized
in Table 26.6. Table 26.7 provides the distances between the main base (0) and branch bases
(1, 2, 3, and 4). The matrix is symmetrical and all distances are in kilometers.
(The main base is Naval Region I located in Hai Phong, Branch
Base 1 is Naval Region II located in Ba Ria - Vung Tau,
Branch Base 2 is Naval Region III located in Da Nang,
Branch Base 3 is Naval Region IV located in Khanh Hoa,
Branch Base 4 is Naval Region V located in Kien Giang)
Each branch base has a limited capacity but, as a whole, the four bases have sufficient capacity
to accommodate all the draftees. 3108 draftees were transported from the drafting centers to
the four branch bases and then to the main base.
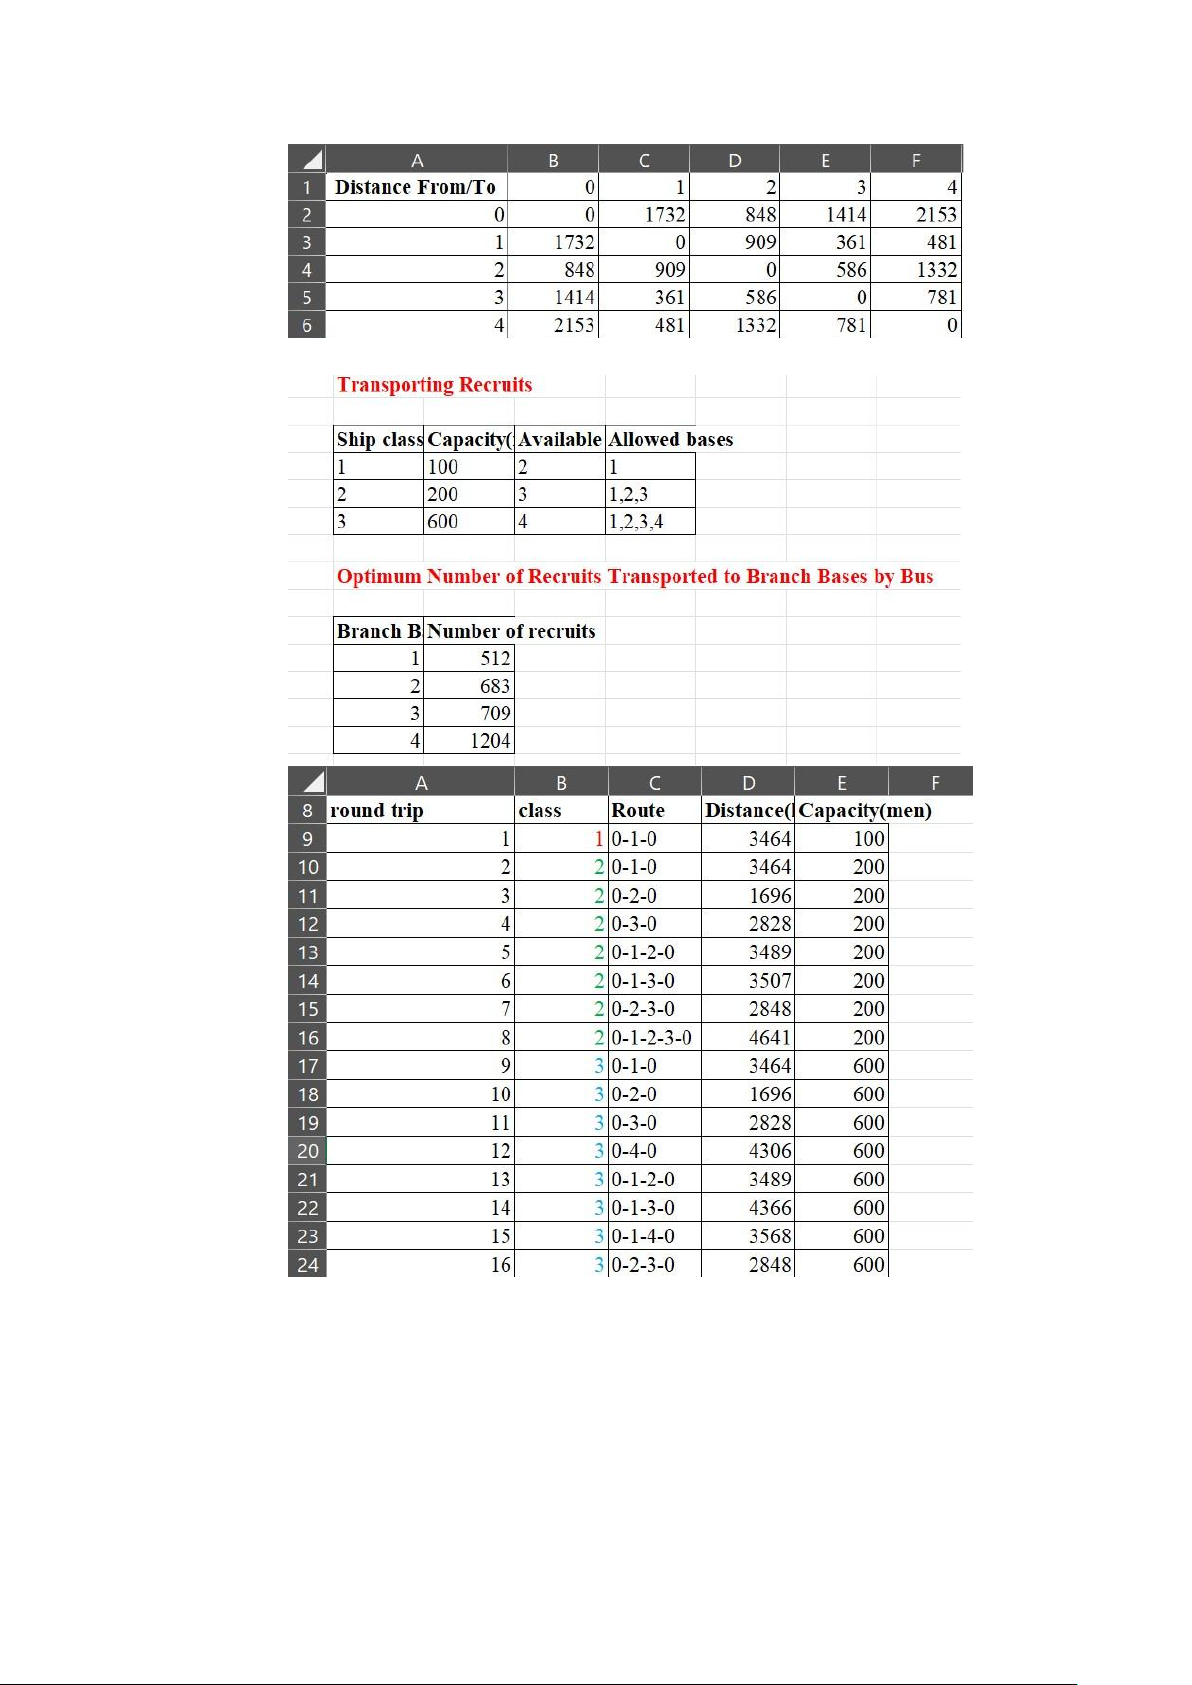
TABLE 26.6 Ship Availability for Transporting Recruits Ship class Capacity (number Available number of Allowed bases of recruits) round trips 1 100 2 1 2 200 3 1,2,3 3 600 4 1,2,3,4
TABLE 26.7 Distance matrix (in kilometers) for main (0) and branch (1, 2, 3, and 4) lOMoAR cPSD| 58097008 bases T 0 1 2 3 4 F 0 1732 848 1414 2153 0 1 1732 0 909 361 481 o 848 909 0 586 1332 2 r 1414 361 586 0 781 3 4 2153 481 1332 781 0 o m
TABLE 26.8 Voyage Specification Round trip Class Route Distance(km) Capacity(men) 1 1 0-1-0 3464 100 2 2 0-1-0 3464 200 3 2 0-2-0 1696 200 4 2 0-3-0 2828 200 5 2 0-1-2-0 3489 200 6 2 0-1-3-0 3507 200 lOMoAR cPSD| 58097008 7 2 0-2-3-0 2848 200 8 2 0-1-2-3-0 4641 200 9 3 0-1-0 3464 600 10 3 0-2-0 1696 600 11 3 0-3-0 2828 600 12 3 0-4-0 4306 600 13 3 0-1-2-0 3489 600 14 3 0-1-3-0 4366 600 15 3 0-1-4-0 3568 600 16 3 0-2-3-0 2848 600 17 3 0-2-4-0 4333 600 18 3 0-3-4-0 4348 600 19 3 0-1-2-3-0 4641 600 20 3 0-1-2-4-0 6126 600 21 3 0-1-3-4-0 5027 600 22 3 0-2-3-4-0 4368 600 23 3 0-1-2-3-4-0 6161 600
Therefore, problems arise concerning the transportation of the recruits: How should the
draftees be transported by ship from branch bases to the main base? 3. Objectives
In this project, our group aims to address the pivotal question: How can naval draftees be most
efficiently transported by ship from four regional branch bases to the main naval base? By
utilizing the CPLEX Optimization Model, we will construct a simulation that accurately
models the main base, the branch bases, and the distances between them, based on real-world
data. Our objective is to develop a robust optimization model that enhances the logistical
efficiency of transporting recruits, ensuring that all variables, such as ship capacity, route
selection, and scheduling constraints, are meticulously considered to streamline operations and
reduce transit times. This approach will help establish a systematic and effective transportation
strategy that can be implemented to improve the overall mobilization process within the naval
recruitment framework in Vietnam.
4. Scope and Limitations 4.1 Scope lOMoAR cPSD| 58097008
Transportation analysis for recruits analysis will cover the annual intake process of recruits in
the Vietnam Navy, mapping their journey from multiple drafting centers to branch bases, and
finally to the main naval base. The project includes the evaluation and planning of optimal ship
classes and their routes to transport recruits efficiently, with consideration given to the
limitations and permissions of each ship class at different naval bases. The approach relies on
the use of comprehensive data sets, including distances between bases, the availability of ships,
and the capacity of each base to develop a reliable model for recruiting transportation. 4.2 Limitations
Despite our optimizing model reaching the benchmarks established at the project's onset, it
operates within certain constraints that may affect its application in real-world scenarios: First
of all, due to the limited availability of official data pertinent to our study, our group was
compelled to construct a database based on relevant, accessible information. Consequently, our
model operates within the confines of this constructed dataset to minimize inconsistencies that
might arise from processing an unbounded data scope. This approach, while practical, restricts
the model's adaptability to newly available or updated data sets. Secondly, the dataset employed
captures conditions from a past period, optimized for enhancing operational efficiency within
those historical parameters. While useful for baseline analysis, this static data usage means the
model is not immediately adaptable to fluctuating real-time demands or changes in order
logistics, which could diminish its effectiveness in dynamic settings. Moreover, our model
assumes a continuous operation without interruptions, which may not hold in practical
scenarios. Real-world challenges such as equipment malfunctions, workforce fluctuations, or
unexpected logistical hurdles are not accounted for. This assumption can lead to
overestimations of system efficiency and underestimations of operational risks. Finally, the
model's performance is tightly linked to the stability of input data, such as recruit numbers and
facility capacities. Any unforeseen changes in these areas due to policy adjustments, strategic
decisions, or demographic shifts could substantially impact the model's outputs and its strategic
recommendations. These insights highlight the importance of continuous model evaluation and
adaptation to maintain its accuracy and applicability in changing circumstances. II.
MATHEMATICAL MODEL/ ALGORITHMS 1. Parameters
- di : Number of people needing transport at base i, where i ranges from 1 to 4.
- shipcapk : Ship capacity of ship class k, where k ranges from 1 to 3.
- nk : Number of ships available for ship class k, where k ranges from 1 to 3.
- Dj : Distance of trip j , where j ranges from 1 to 23.
- Aik : Indicator variable denoting whether base i is allowed for ship class k.
- Bjk : Indicator variable denoting whether ship class k is allowed for trip j.
- Rij : Indicator variable denoting whether base i is on the route for trip j.
- zjk : Number of times trip j is used by ship class k. lOMoAR cPSD| 58097008
- yijk : Number of recruits transported from base i on trip j by ship class k. 2. Decision variables
- The decision variables are already represented mathematically as:
zjk (Number of times trip j is used by ship class k)
yijk (Number of recruits transported from base i on trip j by ship class k) 3. Objective function
- The objective function is already represented mathematically as: 23 3
Z=∑∑ zjk ∙ D j j=1 k=1
This function aims to minimize the total distance traveled by all ships. 4. Constraints
- Recruitment needs are met for each base: 23 3
∑∑ y =d ∀i∈{1,2,3,4 } j
- Ship capacity is not exceeded: 4
∑ yijk ≤shipcapk∙ z jk ∀ j∈ {1,2,…,23},∀ k∈{1,2,3} i=1
- The number of ships used does not exceed availability: 23
∑ z ≤n ∀k ∈{1,2,3} j
- Restrict the bases allowed for each ship class:
yijk ≤ Aik ∙M ∀i∈{1,2,3,4},∀ j∈ {1,2,…,23}, ∀k ∈{1,2,3}
where M is a large positive constant.
- Ensure each trip uses the specified ship class:
zjk ≤ Bjk ∙ M ∀i∈{1,2,…,23},∀ k∈{1,2,3}
where M is a large positive constant. lOMoAR cPSD| 58097008
- Ensure trips follow the specified routes:
yijk ≤Rij∙M ∀i∈{1,2,3,4 },∀ j∈ {1,2,…,23 }, ∀k ∈{1,2,3}
where M is a large positive constant. III. PROBLEM-SOLVING 1. CPLEX Code // INDEX {int} base = {1,2,3,4}; // i
{int} trip = {1,2,3,4,5,6,7,8,9,10,11,12,13,14,15,16,17,18,19,20,21,22,23}; // j {int} class = {1,2,3}; // k // PARAMETERS
int d[base] = ...; // number of men at base i needing transport
int shipcap[class] = ...; // ship capacity in men int n[class] =
...; // number of ships time using available
int D[trip] = ...; // distance of trip j
int allowed_bases[class][base] = [
[1, 0, 0, 0], // class 1: only base 1
[1, 1, 1, 0], // class 2: bases 1, 2, 3
[1, 1, 1, 1] // class 3: all bases ];
int allowed_classes[trip][class] = [
[1, 0, 0], // trip 1: class 1
[0, 1, 0], // trip 2: class 2
[0, 1, 0], // trip 3: class 2
[0, 1, 0], // trip 4: class 2
[0, 1, 0], // trip 5: class 2
[0, 1, 0], // trip 6: class 2
[0, 1, 0], // trip 7: class 2
[0, 1, 0], // trip 8: class 2
[0, 0, 1], // trip 9: class 3
[0, 0, 1], // trip 10: class 3
[0, 0, 1], // trip 11: class 3
[0, 0, 1], // trip 12: class 3
[0, 0, 1], // trip 13: class 3
[0, 0, 1], // trip 14: class 3
[0, 0, 1], // trip 15: class 3
[0, 0, 1], // trip 16: class 3
[0, 0, 1], // trip 17: class 3
[0, 0, 1], // trip 18: class 3
[0, 0, 1], // trip 19: class 3
[0, 0, 1], // trip 20: class 3 lOMoAR cPSD| 58097008
[0, 0, 1], // trip 21: class 3
[0, 0, 1], // trip 22: class 3
[0, 0, 1] // trip 23: class 3 ];
// Route definitions for each trip
int route[trip][base] = [ [1, 0, 0, 0], // trip 1: 0-1-0
[1, 1, 0, 0], // trip 2: 0-1-0
[1, 0, 1, 0], // trip 3: 0-2-0
[1, 0, 0, 1], // trip 4: 0-3-0
[1, 1, 1, 0], // trip 5: 0-1-2-0
[1, 1, 0, 1], // trip 6: 0-1-3-0
[1, 0, 1, 1], // trip 7: 0-2-3-0
[1, 1, 1, 1], // trip 8: 0-1-2-3-0
[1, 0, 0, 0], // trip 9: 0-1-0
[1, 0, 1, 0], // trip 10: 0-2-0
[1, 0, 0, 1], // trip 11: 0-3-0
[1, 0, 0, 1], // trip 12: 0-4-0
[1, 1, 1, 0], // trip 13: 0-1-2-0
[1, 1, 0, 1], // trip 14: 0-1-3-0
[1, 1, 0, 1], // trip 15: 0-1-4-0
[1, 0, 1, 1], // trip 16: 0-2-3-0
[1, 0, 1, 1], // trip 17: 0-2-4-0
[1, 0, 0, 1], // trip 18: 0-3-4-0
[1, 1, 1, 1], // trip 19: 0-1-2-3-0
[1, 1, 1, 1], // trip 20: 0-1-2-4-0
[1, 1, 0, 1], // trip 21: 0-1-3-4-0
[1, 0, 1, 1], // trip 22: 0-2-3-4-0
[1, 1, 1, 1] // trip 23: 0-1-2-3-4-0 ]; // DECISION VARIABLES
dvar int+ z[trip][class]; // Number of times trip j is used by ship class k
dvar int+ y[trip][base][class]; // Number of recruits transported from base i on trip j by ship class k // OBJECTIVE FUNCTION
dexpr float Z = sum(j in trip, k in class) z[j][k] * D[j]; // MODEL minimize Z; subject to {
// Ensure recruitment needs are met for each base forall(i in base)
sum(j in trip, k in class) y[j][i][k] == d[i]; lOMoAR cPSD| 58097008
// Ensure ship capacity is not exceeded
forall(j in trip, k in class)
sum(i in base) y[j][i][k] <= shipcap[k] * z[j][k];
// Ensure the number of ships used does not exceed availability forall(k in class)
sum(j in trip) z[j][k] <= n[k];
// Restrict the bases allowed for each ship class
forall(j in trip, k in class, i in base)
y[j][i][k] <= allowed_bases[k][i] * 10000; // If not allowed, set max transport to 0
// Ensure each trip uses the specified ship class
forall(j in trip, k in class)
z[j][k] <= allowed_classes[j][k] * 10000; // If not allowed, set max usage to 0
// Ensure trips follow the specified routes
forall(j in trip, i in base, k in class)
y[j][i][k] <= route[j][i] * 10000; // If the base is not in the route, set max transport to 0 } 2. Data input
In this project, we were provided with data regarding the distances between each branch base,
as well as the distances from each branch base to the main base. Additionally, we were given
information about the available number of ships for each class, and the number of men needing
transportation to the main base from each branch base. Using this data, we created a table of
round trips based on the provided information.
Our decision variables include the number of times each round trip is used by ship class k, and
the number of recruits transported from base i on trip j by ship class k. To manage and analyze
this data efficiently, we utilized Excel to organize our data and then connected the Excel file to
CPLEX using the "SheetConnection" function. This integration allowed us to streamline data
handling and optimize our transportation strategy effectively. • CPLEX Code
SheetConnection excelsheet("data.xlsx");
d from SheetRead(excelsheet, "MAINscenario!J11:J14");
shipcap from SheetRead(excelsheet, "MAINscenario!J4:J6");
n from SheetRead(excelsheet, "MAINscenario!K4:K6"); D
from SheetRead(excelsheet, "MAINscenario!D9:D31"); lOMoAR cPSD| 58097008 lOMoAR cPSD| 58097008
3. Processing and result analysis lOMoAR cPSD| 58097008 lOMoAR cPSD| 58097008
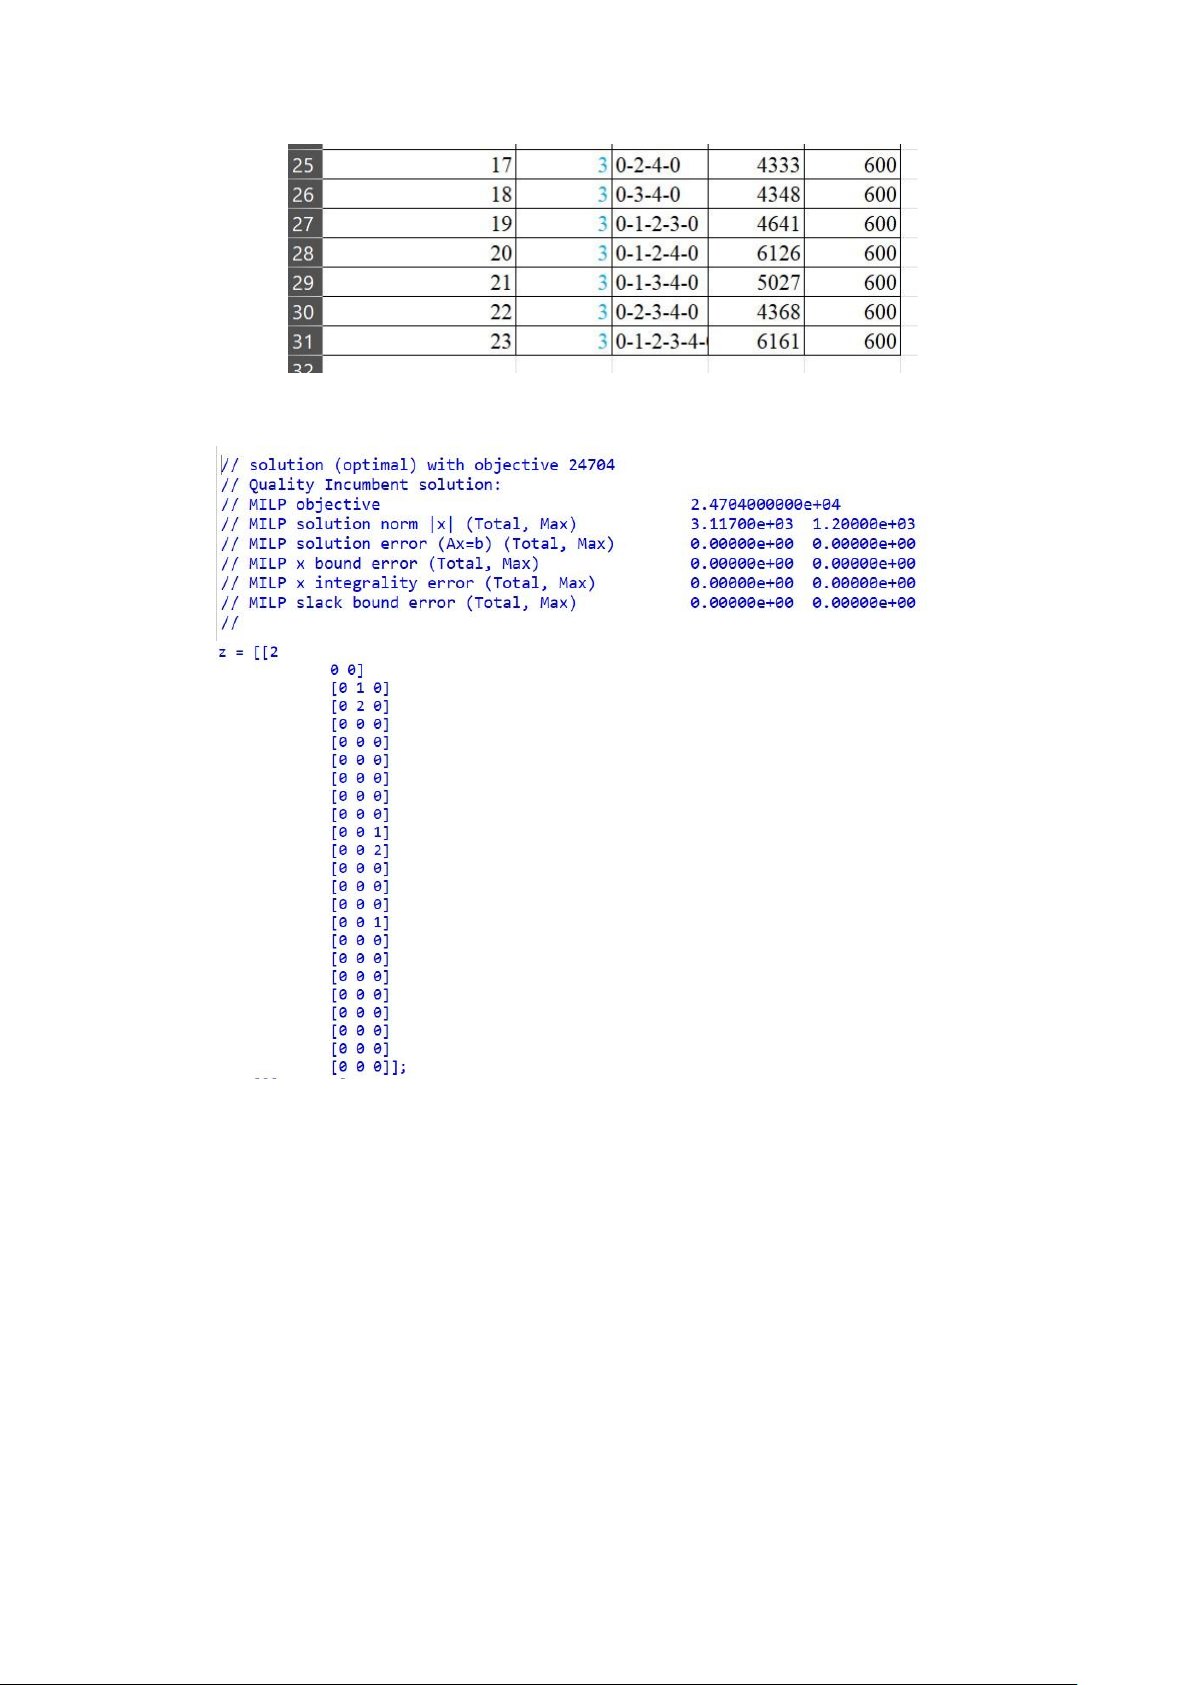
● Result Interpretation The total minimum distance (km) is 24704.
The z matrix shows how many times each trip is taken by each ship class.
z[1][1] = 2: Trip 1 is taken 2 times by ship class 1.
z[2][2] = 1: Trip 2 is taken 1 time by ship class 2.
z[3][2] = 2: Trip 3 is taken 2 times by ship class 2.
z[10][3] = 1: Trip 10 is taken 1 time by ship class 3.
z[11][3] = 2: Trip 11 is taken 2 times by ship class 3.
z[15][3] = 1: Trip 15 is taken 1 time by ship class 3.
All other trips either are not taken or taken 0 times, as indicated by the zeroes.
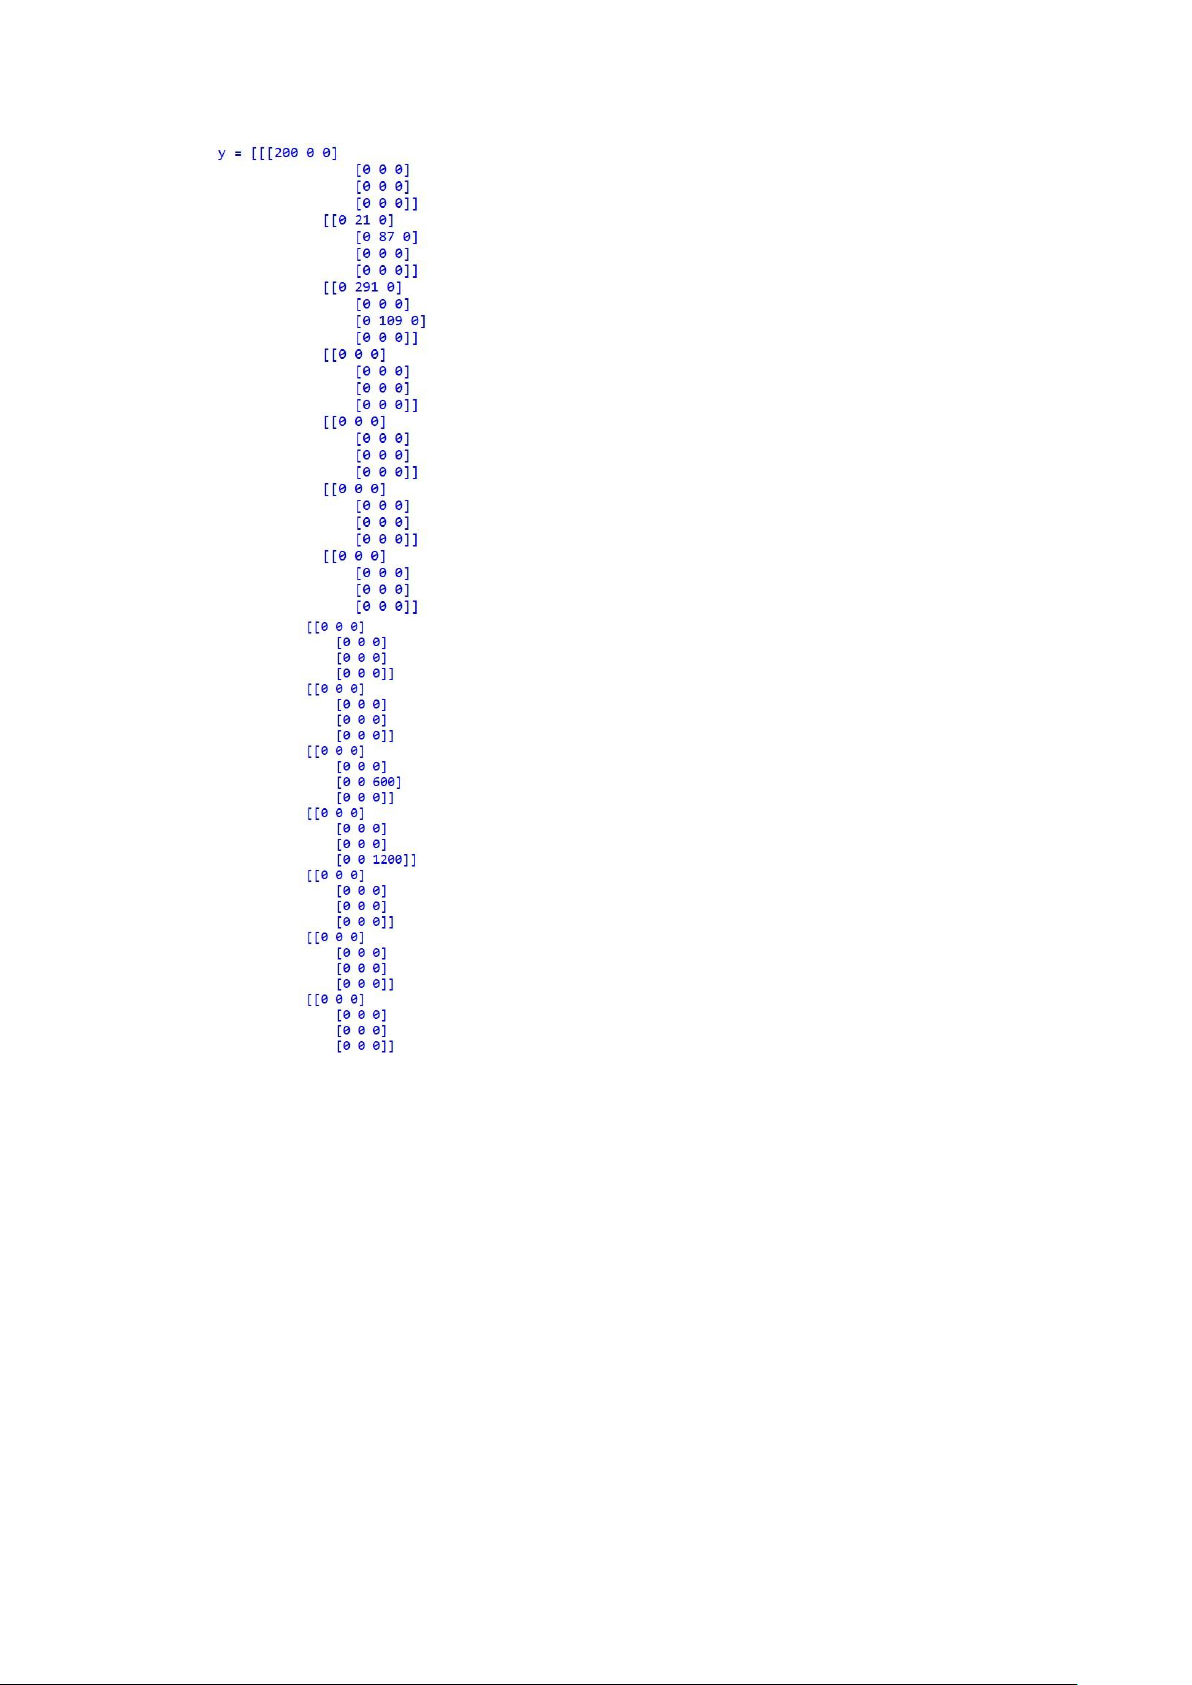
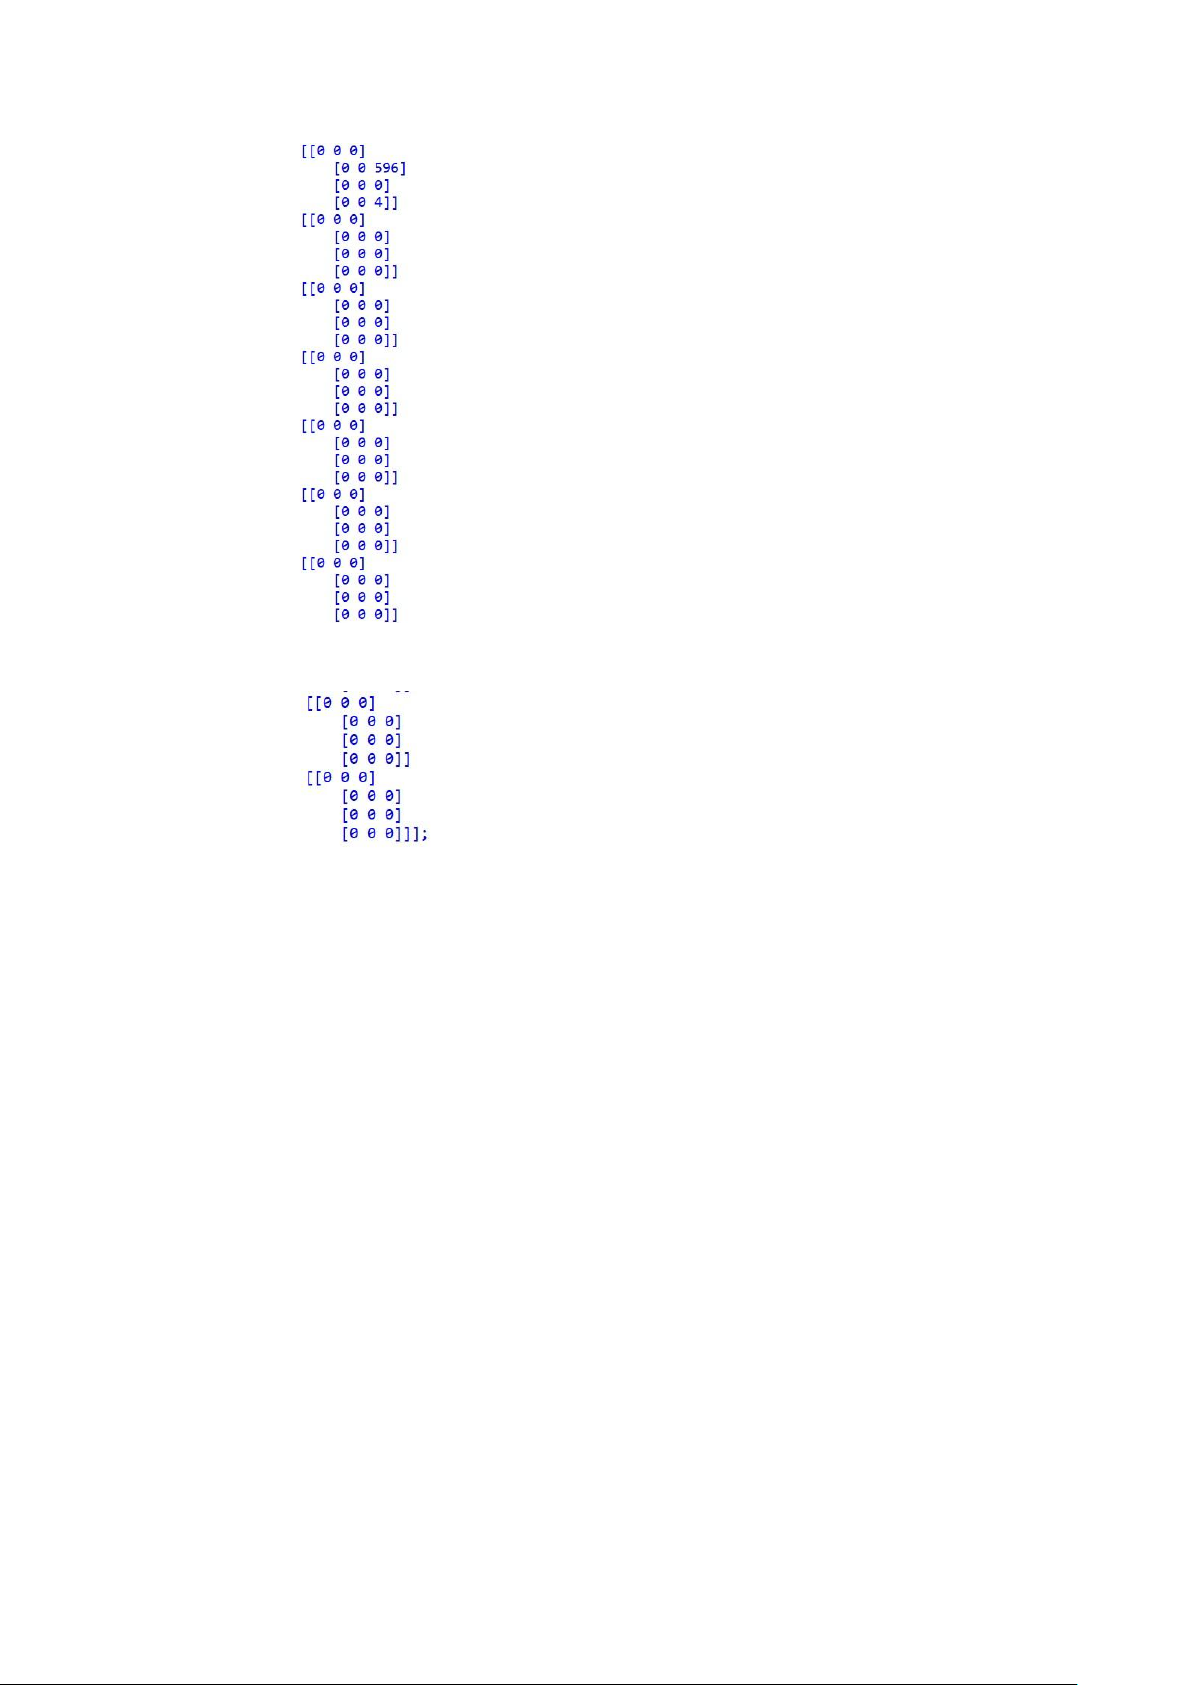
The y matrix shows the number of recruits transported from each base on each trip by each ship class.
y[1][1][1] = 200: On Trip 1, 200 recruits are transported from Base 1 by Ship Class 1. y[2][1][2]
= 21, y[2][2][2] = 87: On Trip 2, 21 recruits are transported from Base 1 and 87 from Base 2 lOMoAR cPSD| 58097008
by Ship Class 2. y[3][1][2] = 291, y[3][3][2] = 109: On Trip 3, 291 recruits are transported
from Base 1 and 109 from Base 3 by Ship Class 2. y[10][3][3] = 600: On Trip 10, 600 recruits
are transported from Base 3 by Ship Class 3. y[11][4][3] = 1200: On Trip 11, 1200 recruits are
transported from Base 4 by Ship Class 3. y[15][2][3] = 596, y[15][4][3] = 4: On Trip 15, 596
recruits are transported from Base 2 and 4 from Base 4 by Ship Class 3.
All other trips either do not transport any recruits or have 0 recruits transported, as indicated by the zeroes. IV.
RESULT ANALYSIS AND DISCUSSION
1. Sensitivity Analysis
In our case analysis, we focused on the scenarios that offered the shortest distances as the most
optimal solutions. The scenarios presented in this report represent the best results we achieved.
Although we explored many other scenarios, they did not yield better outcomes and thus are not included in this report.
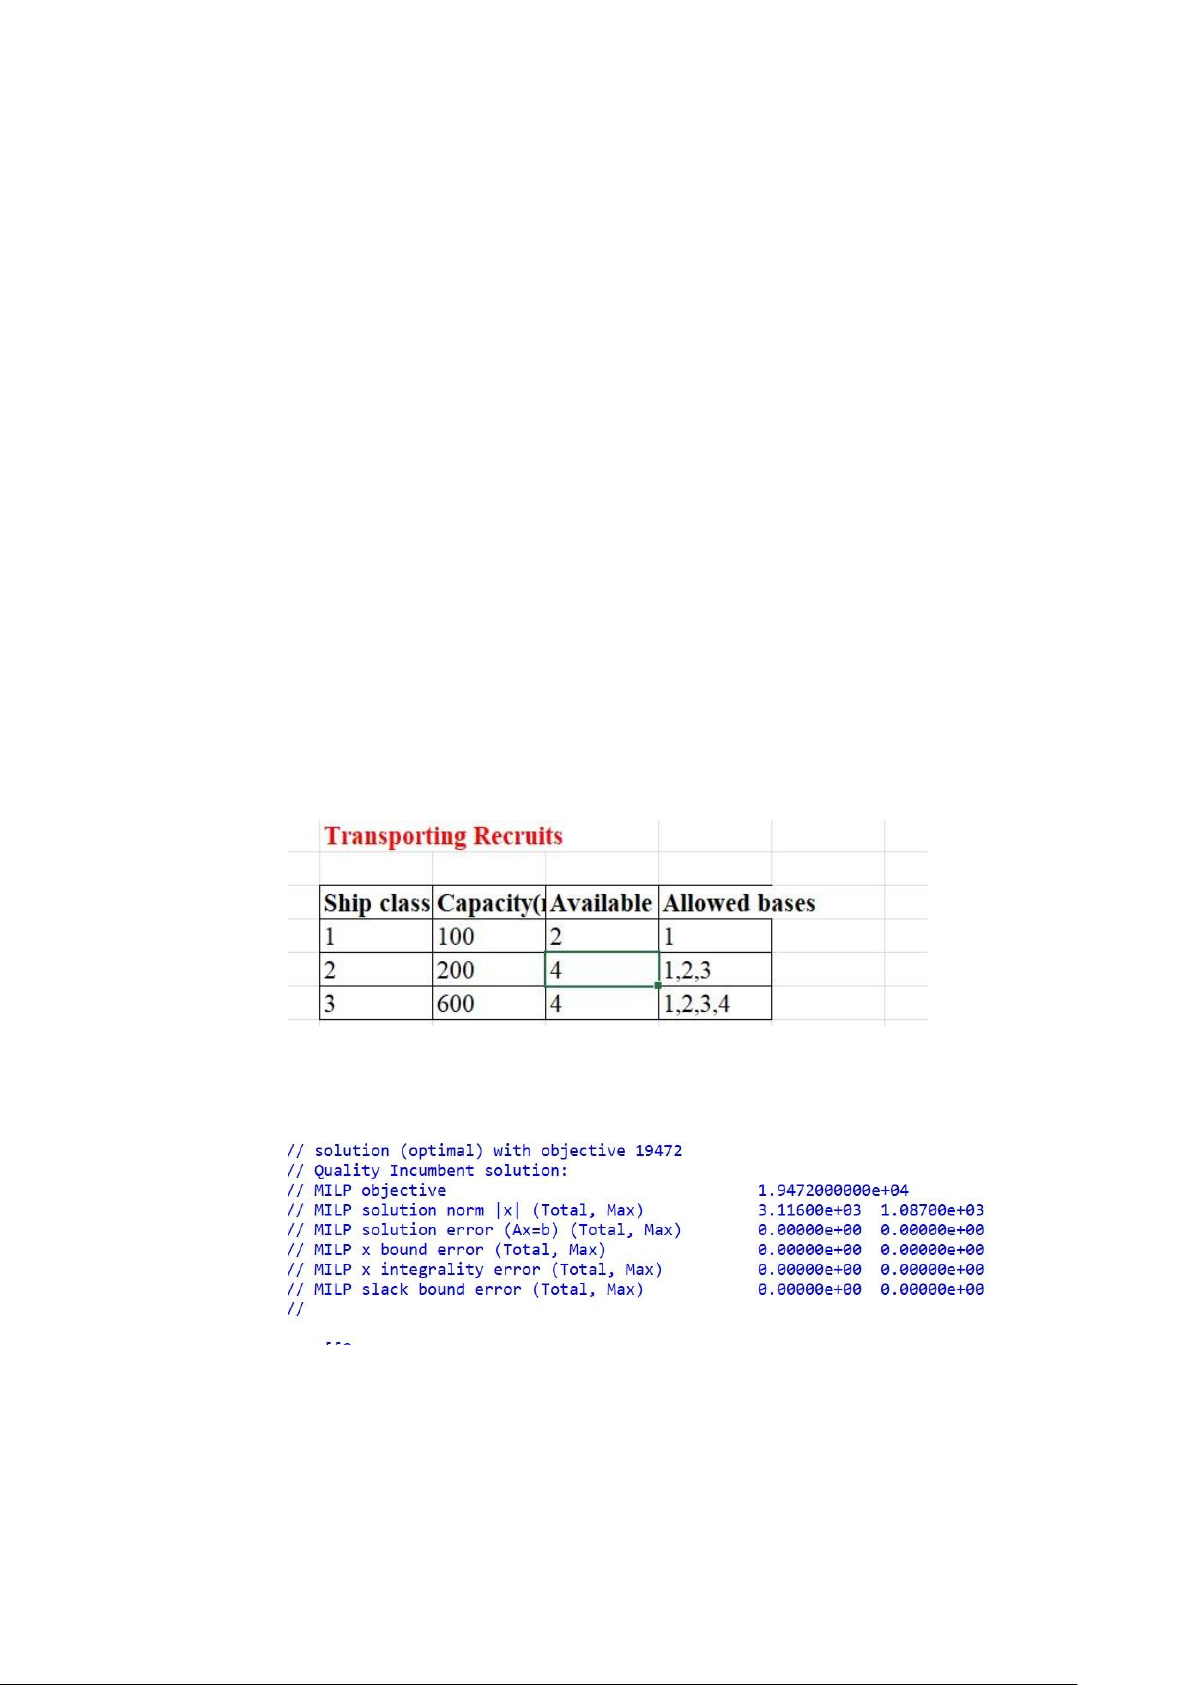
1.1. Scenario 2 ( We raise the using time of ship class 2 by 1) RESULT: lOMoAR cPSD| 58097008
Result Interpretation
The total minimum distance (km) in this scenario is 19472.
The z matrix shows how many times each trip is taken by each ship class.
z[2][2] = 1: Trip 2 is taken 1 time by ship class 2.
z[3][2] = 3: Trip 3 is taken 3 times by ship class 2.
z[10][3] = 1: Trip 10 is taken 1 time by ship class 3.
z[11][3] = 2: Trip 11 is taken 2 times by ship class 3.
z[15][3] = 1: Trip 15 is taken 1 time by ship class 3.
All other trips either are not taken or taken 0 times, as indicated by the zeroes.
The y matrix shows the number of recruits transported from each base on each trip by each ship class.
y[2][2][2] = 200: On Trip 2, 200 recruits are transported from Base 2 by Ship Class 2.
y[3][3][2] = 600: On Trip 3, 600 recruits are transported from Base 3 by Ship Class 2.
y[10][1][3] = 491, y[10][3][3] = 109: On Trip 10, 491 recruits are transported from Base 1 and
109 from Base 3 by Ship Class 3.
y[11][1][3] = 21, y[11][4][3] = 1087: On Trip 11, 21 recruits are transported from Base 1 and
1087 from Base 4 by Ship Class 3.
y[15][2][3] = 483, y[15][4][3] = 117: On Trip 15, 483 recruits are transported from Base 2 and
117 from Base 4 by Ship Class 3.
All other trips either do not transport any recruits or have 0 recruits transported, as indicated by the zeroes.
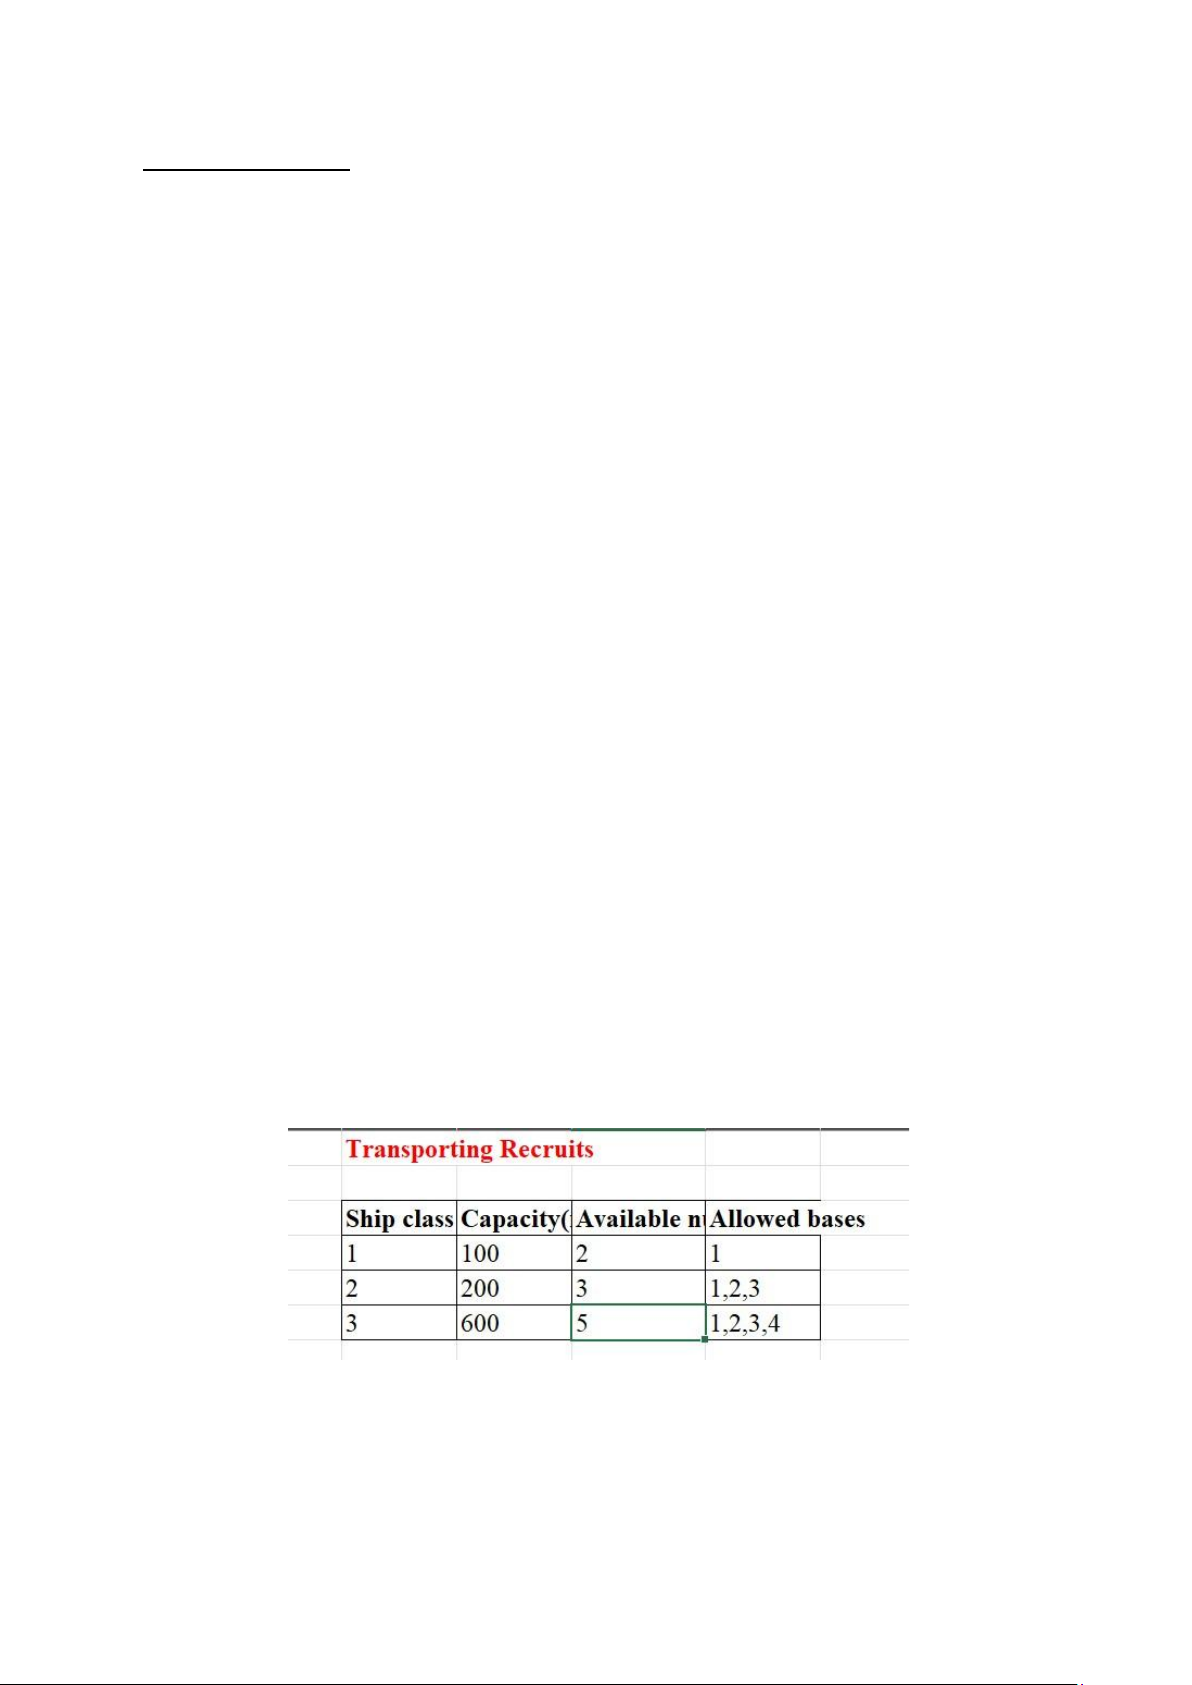
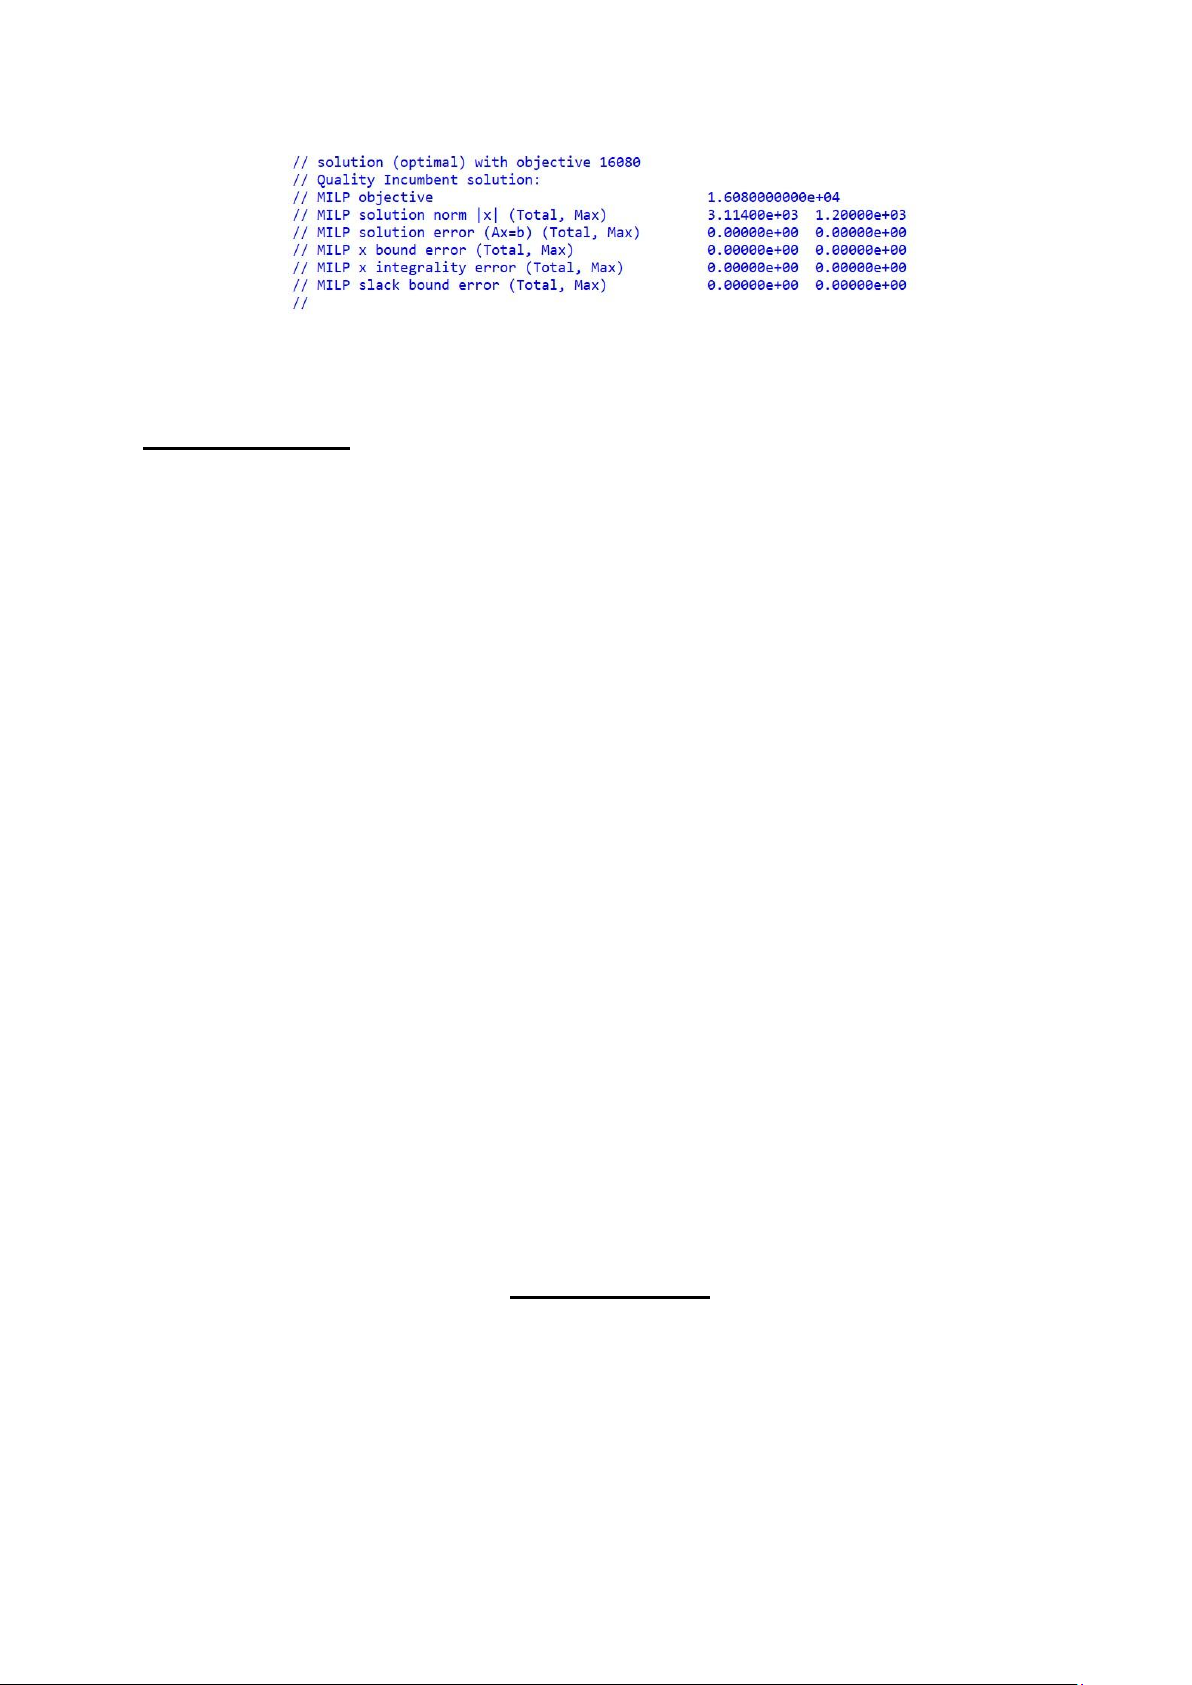
1.2. Scenario 3 ( We raise the using time of ship class 3 by 1) RESULT: lOMoAR cPSD| 58097008
Result Interpretation
The total minimum distance (km) in this scenario is 16080.
The z matrix shows how many times each trip is taken by each ship class.
z[2][2] = 1: Trip 2 is taken 1 time by ship class 2.
z[10][3] = 2: Trip 10 is taken 2 times by ship class 3.
z[11][3] = 2: Trip 11 is taken 2 times by ship class 3.
z[15][3] = 1: Trip 15 is taken 1 time by ship class 3.
All other trips either are not taken or taken 0 times, as indicated by the zeroes.
The y matrix shows the number of recruits transported from each base on each trip by each ship class.
y[2][1][2] = 113, y[2][2][2] = 87: On Trip 2, 113 recruits are transported from Base 1 and 87
from Base 2 by Ship Class 2. y[10][1][3] = 399, y[10][3][3] = 709: On Trip 10, 399 recruits
are transported from Base 1 and 709 from Base 3 by Ship Class 3. y[11][4][3] = 1200: On Trip
11, 1200 recruits are transported from Base 4 by Ship Class 3. y[15][2][3] = 596, y[15][4][3]
= 4: On Trip 15, 596 recruits are transported from Base 2 and 4 from Base 4 by Ship Class 3.
All other trips either do not transport any recruits or have 0 recruits transported, as indicated by the zeroes. 2. Solution Discussion
2.1. Comparative AnalysisMinimum Distance: Scenario 1: 24,704 km Scenario 2: 19,472 km Scenario 3: 16,080 km
Scenario 3 achieves the lowest minimum distance, indicating the most efficient route planning and resource allocation. lOMoAR cPSD| 58097008
2.2. Trip Utilization (z Matrix):
Scenario 1 shows diversified usage of trips across different ship classes. Scenario 2 focuses on
increasing the frequency of specific trips, particularly trip 2, due to the increased usage time of
ship class 2. Scenario 3 optimizes the utilization of trip 10 by ship class 3, resulting in reduced overall distance.
Recruits Transportation (y Matrix): Scenario 1 has a balanced approach with multiple bases
contributing to recruiting transportation. Scenario 2 emphasizes higher transportation from
base 2 in trip 2, leveraging the increased usage time of ship class 2. Scenario 3 optimizes recruit
transportation efficiently, balancing between different bases and ship classes, with significant activity in trip 10.
2.3. Conclusion:
In conclusion, the comparative analysis of the three scenarios indicates that Scenario 3 is the
most efficient in terms of minimum distance traveled, achieving a total of 16,080 km. The
adjustment of increasing the usage time of ship class 3 by 1 led to optimal allocation and
utilization of trips, significantly reducing the overall distance. Scenario 2 also showed
improved efficiency by increasing the usage time of ship class 2, resulting in a minimum
distance of 19,472 km. The baseline Scenario 1, with no adjustments, resulted in the highest
minimum distance of 24,704 km. 3. Future Development
Building on the insights from the three scenarios, several future developments can enhance the
transportation strategy's efficiency and effectiveness. These recommendations focus on
optimizing ship utilization, balancing resource distribution, and implementing regular sensitivity analysis.
Optimization of Ship Utilization:
Strategic Adjustments: Implement strategic adjustments to the usage times of different ship
classes. By fine-tuning the number of trips each class undertakes, it is possible to optimize the
allocation of trips and minimize the overall travel distance, leading to cost savings and
improved operational efficiency.
Dynamic Scheduling: Develop dynamic scheduling algorithms that can adjust ship utilization
in real time based on demand fluctuations, maintenance schedules, and unexpected events.
This flexibility will ensure that the fleet is used to its full potential at all times. Balanced Distribution: lOMoAR cPSD| 58097008
Even Resource Allocation: Ensure a balanced distribution of recruits from different bases to
avoid over-reliance on specific routes or bases. This can prevent bottlenecks and ensure that all
bases are serviced adequately.
Load Balancing Algorithms: Implement advanced load balancing algorithms that distribute the
transportation demand evenly across the fleet and routes. This will help in maintaining
consistent service levels and prevent overburdening certain ships or routes.
Regular Sensitivity Analysis:
Comprehensive Impact Assessment: Conduct regular sensitivity analyses to understand how
changes in parameters such as ship capacities, number of trips, and travel distances impact
overall efficiency. This will help in identifying critical parameters that significantly influence the model’s performance.
Predictive Insights: Use sensitivity analysis to gain predictive insights into potential areas for
improvement. By understanding the relationship between different variables, it becomes easier
to forecast the impact of changes and make informed decisions to enhance operations.
Enhanced Data Integration and Analysis:
Real-Time Data Integration: Integrate real-time data sources such as weather conditions, port
traffic, and ship availability into the model. This will enable more accurate and responsive
decision-making based on current conditions.
Advanced Analytics: Utilize advanced analytics and machine learning techniques to analyze
historical data and predict future trends. This can improve forecasting accuracy and help in
planning for varying demand levels. V. REFERENCES
Optimal Ship Routing and Personnel Assignment for Naval Recruitment in Thailand. (dtic.mil)
Ánh N. T. N. (2023, December 10). Quân số quân đội Việt Nam? Có bao nhiêu quân đoàn, quân
khu? Luật Dương Gia. https://luatduonggia.vn/quan-so-quan-doi-viet-nam-co-baonhieu-quan- doan-quan-khu/
Thuvienphapluat.Vn. (n.d.). Hải quân Việt Nam có mấy Vùng? Bộ Tư lệnh các Vùng bao gồm
những khu vực nào? ThuVienPhapLuat.vn. https://thuvienphapluat.vn/cong-dong-danluat/hai-
quan-viet-nam-co-may-vung-bo-tu-lenh-cac-vung-bao-gom-nhung-khu-vuc-nao212185.aspx