RSC Advances | Đại học Su Phạm Hà Nội
RSC Advances | Đại học Su Phạm Hà Nội với những kiến thức và thông tin bổ ích giúp sinh viên tham khảo, ôn luyện và phục vụ nhu cầu học tập của mình cụ thể là có định hướng, ôn tập, nắm vững kiến thức môn học và làm bài tốt trong những bài kiểm tra, bài tiểu luận, bài tập kết thúc học phần, từ đó học tập tốt và có kết quả cao cũng như có thể vận dụng tốt những kiến thức mình đã học vào thực tiễn cuộc sống
Môn: Khoa học tự nhiên và Công nghệ 159 tài liệu
Trường: Trường Đại học Sư Phạm Hà Nội 3.6 K tài liệu
Tác giả:


Preview text:
RSC Advances PAPER View Article Online
View Journal | View Issue
Effect of a pH-controlled co-precipitation process
on rhodamine B adsorption of MnFe2O4
Cite this: RSC Adv., 2018, 8, 6709 24. ercial 3.0 Unported Licence. nanoparticles 57: m om 8 06:
Umaporn Lamdab,a Khatcharin Wetchakun,b Wiyong Kangwansupamonkoncd onC N and Natda Wetchakun *ae ion-
We investigated the effect of a pH-controlled co-precipitation process on the adsorption behavior of ttribut
manganese ferrite (MnFe2O4) nanoparticles as well as their structural and magnetic properties. The pH of A
prepared MnFe O nanoparticles is typically an important factor a 2 4
ffecting the adsorption capacity of an ons
adsorbent. In this study, MnFe O nanoparticles were prepared using a co-precipitation method at four m 2 4 om
different pH values of 9.0, 9.5, 10.0, and 10.5. The adsorption behaviors on rhodamine B (RhB) by C
MnFe O nanoparticles prepared at di 2 4
fferent pH values were investigated. It was found that, via a pH-
controlled process, MnFe2O4 nanoparticles prepared at pH 10.5 showed the highest RhB removal
ry 2018. Downloaded on 26/02/201 reative C
efficiency. The results indicated that the large pore size and surface charge of MnFe2O4 nanoparticles ua Received 22nd December 2017 r a ebr
improved the adsorption capacities for RhB. Kinetic data were fitted to a pseudo-second order kinetic Accepted 4th February 2018
model and revealed that equilibrium was reached within 60 min. The isotherm data showed that the DOI: 10.1039/c7ra13570j ed unde
Langmuir maximum adsorption capacity of the MnFe2O4 nanoparticles prepared at pH 10.5 for RhB was d on 12 F rsc.li/rsc-advances 9.30 mg gû1. icens ishe s l ubl rticle i 1. Introduction
oxidation processes,9,10 direct coagulation/occulation-sand s a rticle. P
ltration or ozonation,11–14 membrane separation,15 coagula- hi T
Many textile industries use processes, such as dyeing silk,
tion and occulation, 16 as well as adsorption,17–19 have been ccess A
wool, jute, leather and cotton that are major sources of severe
used to remove dyes from wastewater. Adsorption processes n A
worldwide water pollution problems.1 The release of many
are considered to be an effective, promising and economical pe
dyes in the water is very harmful because these strong colored
alternative, which can be used to remove dyes in water.20–22 O
components create dangerous byproducts through oxidation,
Recently, magnetic nanoparticles have been used to remove
and inhibit benthic photosynthesis.2,3 The toxic and carcino-
dyes from water. Among ferrites utilized for dye removal,
genic degraded products of dyes from industrial effluents
manganese ferrite (MnFe2O4) is the most prominent ferrite
released into clean water affect the central nervous system in
because of its highest magnetization, high catalytic activity,
humans and the environment.4,5 Rhodamine B (RhB),
and good durability. Moreover, MnFe2O4 provides an advan-
a cationic dye, is a major source of environmental pollution
tage for repeating magnetic separation with good stability.23–29
because of its stability and resistance to biodegradation.6 It
It has been shown that MnFe2O4 nanoparticles can be
can be toxic to human beings and animals, and causes the
prepared via several methods such as hydrothermal,30,31 sol–
irritation of skin, eyes and respiratory tract.7,8 Thus, the
gel,29,32 and co-precipitation. 33–35 Among these methods, co-
development of efficient methods for RhB elimination is
precipitation has been widely utilized for the preparation of
urgently needed. Several techniques such as advanced
magnetic ferrite. When compared to other methods, the
products obtained from a co-precipitation method are rela-
tively uniform, and can be prepared easily and scaled up for
aDepartment of Physics and Materials Science, Faculty of Science, Chiang Mai
industrial purposes. From previous reports, the physical
University, Chiang Mai 50200, Thailand. E-mail: natda_we@yahoo.com b properties of MnFe
Program of Physics, Faculty of Science, Ubon Ratchathani Rajabhat University, Ubon
2O4 nanoparticles were strongly dependent Ratchathani 34000, Thailand
on the pH preparation value.36–38 Therefore, controlling the pH
cNational Nanotechnology Center, National Science and Technology Development
value within the co-precipitation process is important for the
Agency, 111 Thailand Science Park, Paholyothin Road, Khlong Luang, Pathumthani
synthesis of MnFe2 O4 nanoparticles with the desired 12120, Thailand
morphology and size for efficient adsorption. To the best of
dAFRST, The Royal Society of Thailand, Sanam Sueapa, Dusit, Bangkok 10300,
our knowledge, the characteristics and adsorption properties Thailand e
of MnFe2O4 nanoparticles prepared at various pH values for
Materials Science Research Center, Faculty of Science, Chiang Mai University, Chiang
RhB removal have not been investigated. Mai 50200, Thailand
This journal is © The Royal Society of Chemistry 2018
RSC Adv., 2018, 8, 6709–6718 | 6709 View Article Online RSC Advances Paper
In this study, the MnFe 2O4 nanoparticles prepared at
1.5418 nm). The morphology and particle size were determined
different pH values of 9.0, 9.5, 10.0, and 10.5 were synthesized
by scanning electron microscopy (SEM, JEOL JSM-6335F) and
by a co-precipitation method. The effect of controlling the pH
transmission electron microscopy (TEM, JEOL JEM-2010). The
during the co-precipitation process was studied to determine
Brunauer–Emmett–Teller (BET) specic surface area and pore
the crystal structure, morphology, magnetic properties of the
size of the prepared samples were analyzed by nitrogen
MnFe2O4 nanoparticles. The adsorption capacities, adsorption
adsorption–desorption isotherms obtained using an autosorb 1
kinetics and adsorption isotherms of the obtained MnFe2O4
MP (Quantachrome). The zeta potential determined by zetasizer
nanoparticles were evaluated based on the efficiency of the RhB
nano instrument (ZS Malvern) was used to evaluate the removal.
isoelectric point (IEP) of the MnFe2 O4 nanoparticles. A vibrating
sample magnetometer (VSM, Lakeshore VSM 7400) was
employed to measure the magnetic properties of the obtained 24. ercial 3.0 Unported Licence. 2. Experimental 57: m
samples. The Fourier transform infrared (FTIR) spectra of the om 2.1 Preparation of MnFe
samples were recorded in the 4000 2O4 nanoparticles –400 cmû1 wavenumber 8 06: onC
region using KBr disks as standard on a Thermo Scientic MnFe N
2O4 nanoparticles were prepared using a co-precipitation
model Nicolet 6700 FT-IR spectrophotometer. Surface compo-
method. Firstly, 25 mM of manganese nitrate hydrate ion-
sition and oxidation state were carried out using X-ray photo-
(Mn(NO3) 2$xH2O, Sigma-Aldrich, USA, 98%) and 50 mM of iron
electron spectroscopy (XPS, Kratos Axis ULTRADLD) with ttribut
nitrate nonahydrate (Fe(NO3)3$9H2O, Sigma-Aldrich, USA, 98%) A
were dissolved in deionized water. These solutions were mixed
a monochromatic Al Ka source (1486.6 eV). All XPS spectra for ons m
together using magnetic stirring at a constant speed. Then, the
the samples were referenced by setting the adventitious carbon C (1s) peak to 284.8 eV. om
mixed solution was heated to 70 C for 15 min, and then added C
dropwise 0.2 M of sodium hydroxide (NaOH, Sigma-Aldrich,
97%). The pH of each solution was adjusted to form different 2.3 Adsorption experiments
ry 2018. Downloaded on 26/02/201 reative C
values of 9.0, 9.5, 10.0, and 10.5. Correspondingly, the MnFe ua 2O4
The adsorption properties of MnFe 2O4 nanoparticles prepared r a ebr
samples produced during the pH-controlled preparation
at different pH values for RhB removal were examined using
process were denoted as MnFe2O4-pH 9.0, MnFe2O4-pH 9.5,
a batch adsorption experiment. Initially, at room temperature, ed unde
MnFe2O4-pH 10.0, and MnFe 2O4-pH 10.5. The mixture solutions
100 mg of the adsorbent was added to 100 mL of RhB reaction d on 12 F icens
were then stirred magnetically for 24 h at room temperature.
solution with a concentration of 2 10û5 M. During the ishe s l
The obtained precipitates were washed with deionized water by
adsorption process, samples were taken at 5 min intervals for ubl
centrifugation several times and were dried at 80 C for 24 h. A
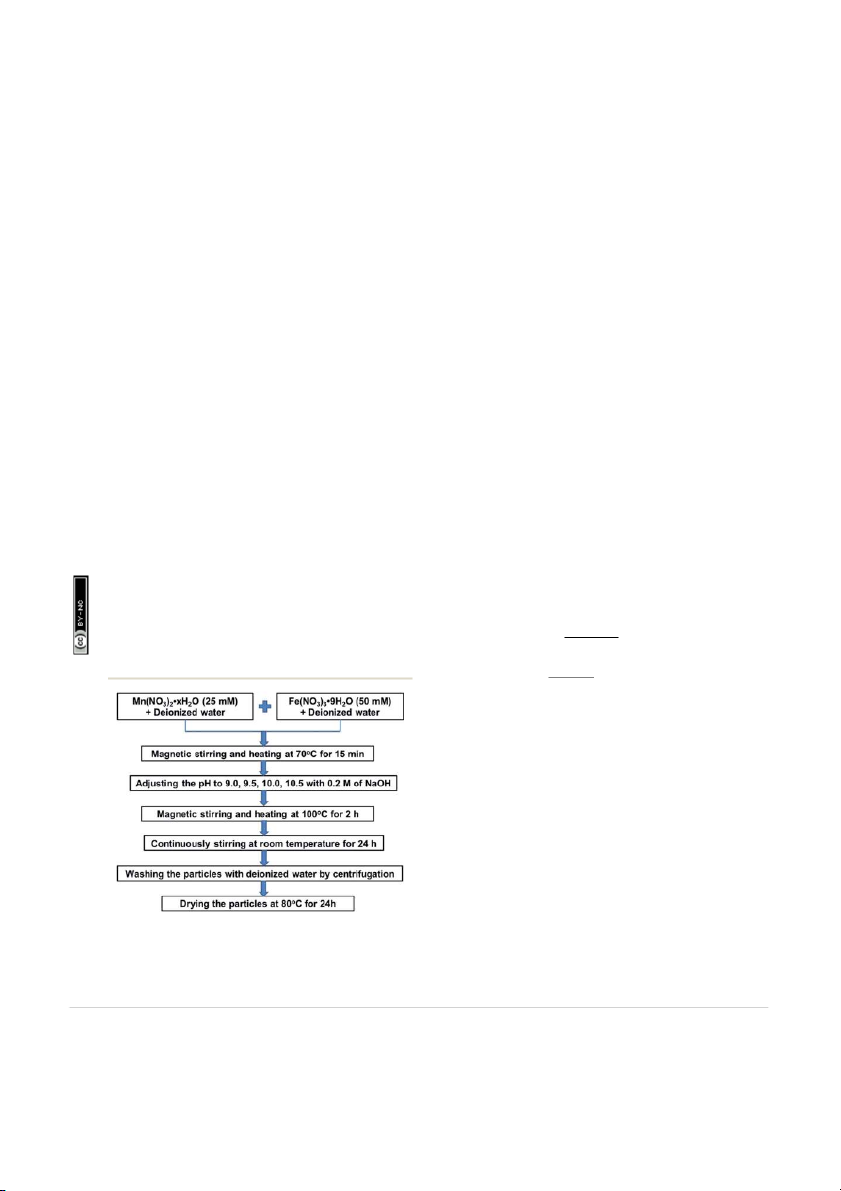
60 min. The MnFe 2O4 nanoparticles were separated from the rticle i s a
ow diagram of MnFe2O4 nanoparticles preparation at the pH
RhB solution by centrifugation at 3000 rpm for 5 min. The rticle. P hi T
values of 9.0, 9.5, 10.0, and 10.5 by co-precipitation method are
solute concentration was determined by a UV-vis spectropho- shown in Fig. 1.
tometer (Thermo Scientic Evolution 201) at lmax ¼ 550 nm. ccess A
The adsorption capacity and removal efficiency were calculated n A
using the following equations:39,40 pe 2.2 Characterization O ðC
The crystal phases of all samples were characterized by X-ray q 0 û CeÞV e ¼ (1) W
diffraction (XRD, JEOL JDX-3530) with Cu K irradiation (l ¼ a ðC E ¼ 0 û CeÞ 100% (2) C0
where qe is the equilibrium adsorption capability (mg gû1), C0
and Ce are the initial and equilibrium concentrations of RhB
(mg Lû1), W is the mass (g) of the magnetic adsorbent, and V is
the volume of the solution (mL). 3. Results and discussion 3.1 Crystal structure
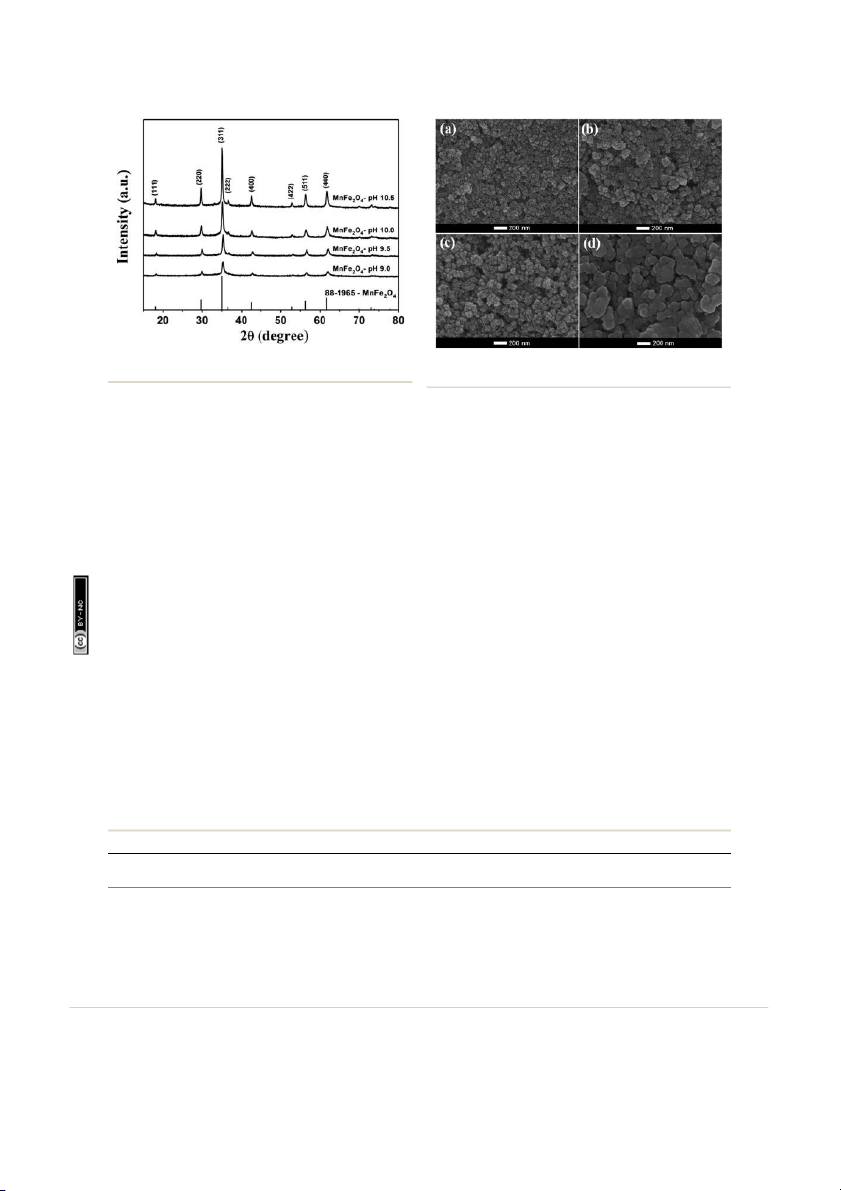
The XRD pattern of the MnFe2O4 powders prepared at different
pH values are shown in Fig. 2. The considered diffraction peaks with 2q values for MnFe
2O 4-pH 10.5 were 18.08, 29.74, 35.02 ,
36.66, 42.57, 52.82, 56.26, and 61.74 corresponding to the
crystal planes (111), (220), (311), (222), (400), (422), (511), and
(440), respectively. According to the JCPDS standard (card no.
88–1965), the crystal structure of MnFe2O4 powders can be Fig. 1 Flow diagram of the MnFe
indexed as spinel structure belonging to the face center cubic
2 O4 nanoparticles preparation by co-
precipitation at the pH values of 9.0, 9.5, 10.0, and 10.5.
(FCC) system. No diffraction peak was attributed to manganese
6710 | RSC Adv., 2018, 8, 6709–6718
This journal is © The Royal Society of Chemistry 2018 View Article Online Paper RSC Advances 24. ercial 3.0 Unported Licence. 57: m om 8 06: onC N ion- Fig. 2
XRD patterns of MnFe O nanoparticles prepared by prepara- ttribut 2 4 Fig. 3
SEM images of (a) MnFe2O4-pH 9.0, (b) MnFe2O4-pH 9.5, (c) A
tion by co-precipitation at the pH values of 9.0, 9.5, 10.0, and 10.5.
MnFe2O4-pH 10.0 and (d) MnFe2O4-pH 10.5. ons m om C
oxide and/or iron oxide materials. This suggests that the well-
hard-grained clusters. These nanoparticles consist of the
crystallized MnFe2O4 phase with a spinel structure has
spherical particles with average diameters of 69, 98, 149, and
ry 2018. Downloaded on 26/02/201 reative
formed during the co-precipitation process. ua C
247 nm for the preparation at pH values of 9.0, 9.5, 10.0, and r a
As seen from Fig. 2, the XRD diffraction pattern of MnFe2O4- ebr
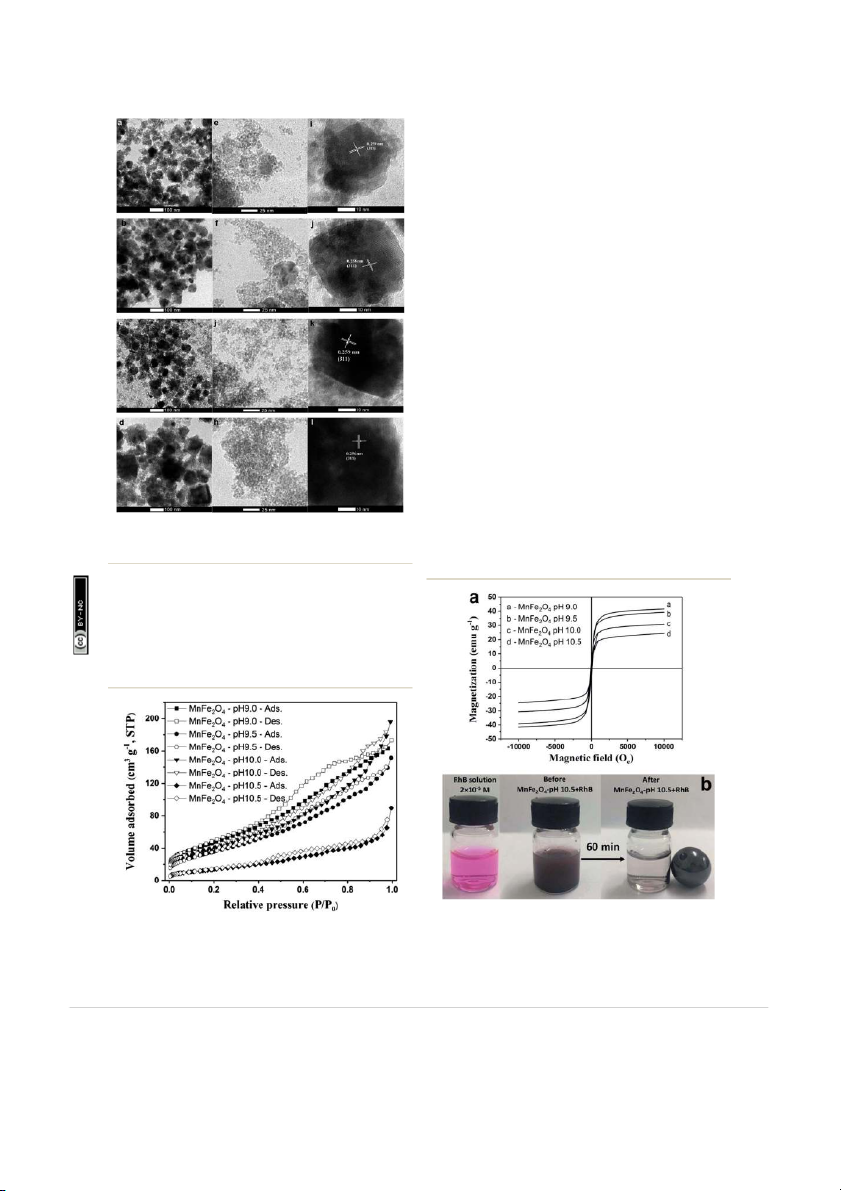
10.5, respectively. Furthermore, TEM images can reveal internal
pH 9.0 shows the lowest intensity due to its small crystallite size
structures, and provide more accurate measurement of particle ed unde
with low crystallinity. On the other hand, the intensity of the
sizes and morphology. The morphology of MnFe2O4 nano- d on 12 F
(311) peak increased with increasing pH values from 9.5 to 10.5, icens
particles from TEM images displayed spherical-like shapes. The ishe s l
indicating high crystallinity and large crystallite sizes for
average particle sizes of MnFe2 O4 nanoparticles were 4.4, 4.5, ubl
particles obtained under these preparation conditions. These
5.5, and 6.4 nm at the pH values 9.0, 9.5, 10.0, and 10.5, rticle i
results imply that the crystallite size and crystallinity of s a
respectively (Fig. 4e–h). Fig. 4a–d show that the agglomerated rticle. P hi
MnFe2O4 nanoparticles can be adjusted with the pH value used T
particles diameter of MnFe2O4 increased as the pH value
during the co-preparation process. The crystallite size of all
increased. The increase in the pH of the mixture solution ccess A
samples was calculated using the Debye–Scherer formula.41 The
resulted in more agglomeration of particles as the average n A
calculated crystallite size of MnFe2O 4 at the pH values of 9.0, pe
particle size increased.42,43 The agglomeration of MnFe2O4 O
9.5, 10.0, and 10.5 were 29.5, 41.2, 54.2, and 103.7 nm, respec-
nanoparticles affects the BET-specic surface area (SSA) (these tively (Table 1).
results are shown in the Section 3.3 BET-specic surface area
and pore size). The corresponding HRTEM images in Fig. 4i–l
show lattice spacings of the MnFe 3.2 Morphology 2O4 nanoparticles prepared at
pH 9.0 to 10.5. The d spacing of approximately 0.25 nm corre-
The morphology and particle size of MnFe2O4 nanoparticles
sponds to the (311) plane of MnFe 2O4.
with varying pH values (pH 9.0, 9.5, 10.0, and 10.5) were
investigated by SEM and TEM images, and are shown in Fig. 3
and 4 as well as Table 1. Fig. 3 displays the SEM images of 3.3
BET-specic surface area and pore size
MnFe2O4 prepared at different pH values of 9.0, 9.5, 10.0, and
Fig. 5 shows the N2 adsorption–desorption isotherms area and
10.5. The images indicated that synthesized manganese ferrites
the pore size distribution of the as-prepared MnFe2O4 nano- were composed of agglomerated small particles. The
particles. The N2 adsorption–desorption isotherm of MnFe2O4
morphology of MnFe2O4 nanoparticles appears to be not-so-
nanoparticles was matched to a type IV hysteresis loop Table 1
Physical properties of MnFe2O4 nanoparticles prepared by a co-precipitation at different pH values XRD-crystallite TEM-particle Average pore MnFe2O4 size (nm) size (nm) SSA (m2 g û1) size diameter (nm) Ms (emu gû1) pH 9.0 29.5 4.4 182.82 2.934 24.58 pH 9.5 41.2 4.5 139.25 3.371 30.60 pH 10.0 54.2 5.5 157.59 3.849 36.72 pH 10.5 103.7 6.4 53.99 5.094 41.48
This journal is © The Royal Society of Chemistry 2018
RSC Adv., 2018, 8, 6709–6718 | 6711 View Article Online RSC Advances Paper
and increasing the pH to 10.5 shows a surface area notably
diminished to 53.99 m2 g û1. This is possibly because of the
progressive aggregation of small crystallites into larger parti-
cles. The average pore size diameter was observed to increase as
the pH increased. Furthermore, the most signicant increase to
a pore size of 5.094 nm was noted at the highest pH of 10.5. This
result suggests that the larger pore size is benecial to an
improved ability of RhB to adsorb to the surface of MnFe2O4
nanoparticles. In addition to pore size of the adsorbent, other
factors such as initial dye concentration and surface charge of the adsorbent in 24.
uence the adsorption capacity of adsorbent ercial 3.0 Unported Licence. 57: m materials.43–46 om 8 06: onC 3.4 Magnetic properties N
The magnetic properties of MnFe2 O4 nanoparticles were ion-
investigated by using a vibrating sample magnetometer (VSM) ttribut
at room temperature under magnetic elds up to 10 kOe as A shown in Fig. 6a. All MnFe 2O4 samples exhibited so magnetic ons m
behavior with a narrow hysteresis loop. The values of saturation om
magnetization (Ms) of MnFe2O4 nanoparticles prepared at pH C
9.0, 9.5, 10.0, and 10.5 are shown in Table 1. The saturation
magnetization of the MnFe2O4 nanoparticles increased as the
ry 2018. Downloaded on 26/02/201 reative C
increased pH value of the prepared MnFe ua 2O4. MnFe2O4-pH 10.5 r a ebr
showed the highest M s value (41.48 emu gû1) due to the large
magnetic dipole moments from the large particle size and the ed unde
high crystallinity of the particles. The results also demonstrate d on 12 F icens
a faster magnetic attraction by external magnetic eld and ishe s l
probably a more effective removal of the MnFe2O4 particles ubl Fig. 4
TEM images and lattice fringes of MnFe2O4 nanoparticles
from the large volume of water. In Fig. 6b, MnFe2O 4-pH 10.5 was
prepared at the pH values of pH 9.0 (a, e and i), pH 9.5 (b, f and j), pH rticle i
10.0 (c, g and k), and pH 10.5 (d, h and l).
separated in solution aer applying a magnetic s a eld. It can be rticle. P hi T ccess A
(according to the IUPAC classication) indicating a mesoporous n A pe
structure. The BET-specic surface areas of the MnFe2O4 O
nanoparticles prepared at different pH values corresponded to
the average pore size diameter as listed in Table 1. The
MnFe2O4-pH 9.0 shows a specic surface area of 182.82 m2 gû1 Fig. 6
(a) M–H curves of MnFe2O4 nanoparticles prepared at different Fig. 5
N2 adsorption–desorption isotherms for MnFe2O4 nano-
pH values and (b) photograph of MnFe2O4 nanoparticles separation in
particles prepared at pH 9.0, 9.5, 10.0, and 10.5.
RhB solution by using a magnet.
6712 | RSC Adv., 2018, 8, 6709–6718
This journal is © The Royal Society of Chemistry 2018 View Article Online Paper RSC Advances
seen that the magnetic powders of MnFe2O4-pH 10.5 immedi-
pseudo-rst order model is presented in Fig. 8b. The qe, cal
ately moved towards the magnet and the RhB solution became
values of all samples were calculated from the intercept of the clear.
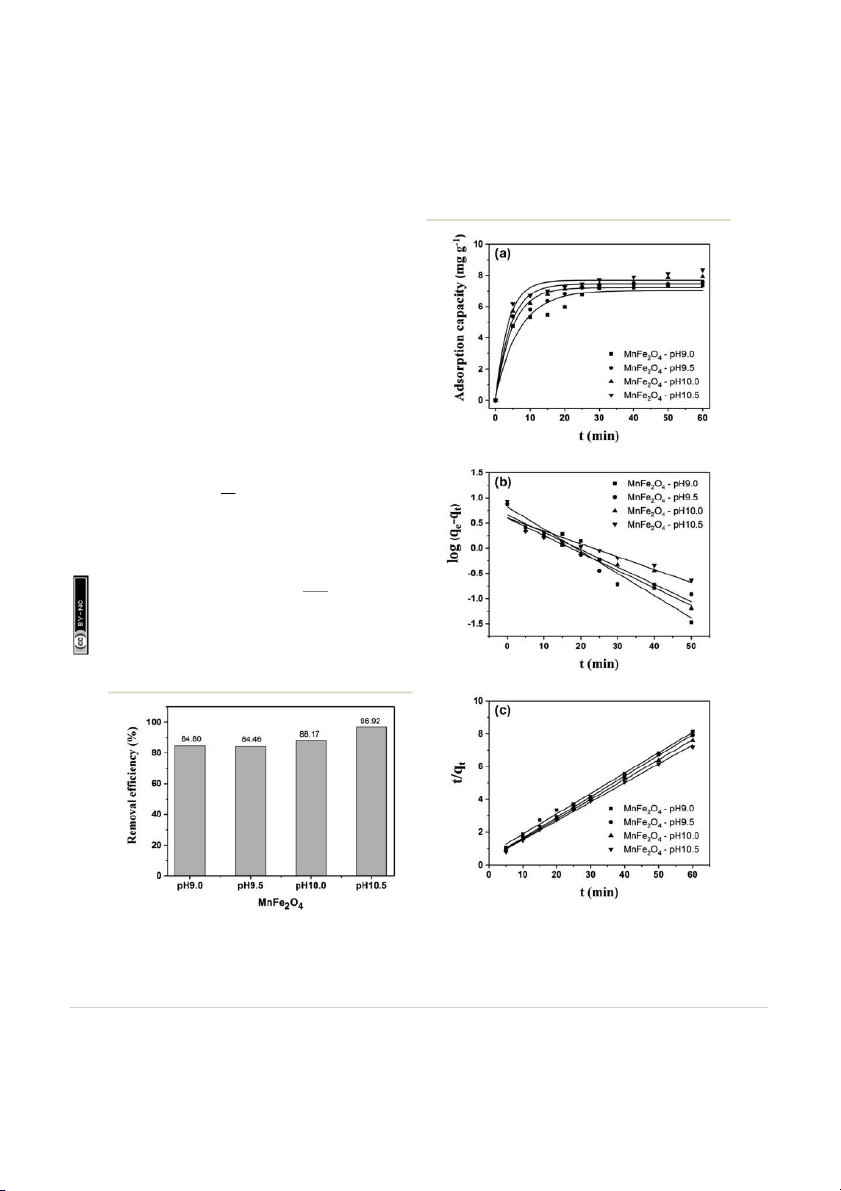
plot of log(qe) versus t. From the obtained data, R2 was relatively
low, indicating that the pseudo-rst order model was not well 3.5 Adsorption kinetics
suited to predict the kinetic rate constant. Therefore, the
pseudo-second order model was applied to determine the
In Fig. 7, the maximum removal percentage of RhB (96.92%)
was observed for MnFe2O4-pH 10.5. The adsorption capacity of
MnFe2O4 nanoparticles over RhB could be partially explained by
the surface charges characterized by zeta potential. The point of
zero charge (pzc) values of MnFe2O4 nanoparticles prepared at 24. ercial 3.0 Unported Licence.
pH 9.0, 9.5, 10.0, and 10.5 were 5.58, 6.13, 6.69, and 5.18, 57: m
respectively. The pH value of the suspension of the MnFe2O4 om 8 06:
nanoparticles and RhB solution was measured to be approxi- onC N
mately 8.8 which explains the negatives charges on the surface ion-
of the MnFe2O4. For this reason, the cationic RhB molecules
would preferentially adsorb onto the negatively charged ttribut
MnFe2O4 nanoparticles through electrostatic interaction.47 A
In order to further analyze the adsorption kinetics for ons m
removing RhB by MnFe2O4 nanoparticles, two kinetic models, om
the pseudo-rst-order and pseudo-second-order, models, were C
applied. The adsorption capacities of MnFe2O4 nanoparticles
for RhB adsorption are shown in Fig. 8a. The pseudo- reative rst order
ry 2018. Downloaded on 26/02/201 ua C
equation is generally represented according the following r a ebr equation48,49 (eqn (3)): dqt ed unde ¼ k d on 12 F dt 1ðqe û qtÞ (3) icens ishe s l
where k1 and qt are the rate constant of pseudo-rst order ubl
kinetics (minû1) and adsorption capacity at time t (min), rticle i
respectively. Aer integration by applying the conditions, q ¼ t s a rticle. P hi 0 at t ¼ 0 and q ¼ at t qt t ¼ t, the eqn (3) becomes T k ccess A logðq 1 e û qtÞ ¼ logðqeÞ û t (4) 2:303 n A pe O
The k1, calculated qe (qe, cal), and correlation coefficients (R2)
of MnFe2O4 with varying pH values were determined as shown
in Table 2. The plot of log(qe û qt) versus time aer tting the Fig. 8
Adsorption kinetics of (a) MnFe 2O4, the plots of (b) pseudo-first Fig. 7
Removal efficiency of RhB by MnFe2O4 nanoparticles prepared
order, and (c) pseudo-second order kinetic models for RhB adsorption
by co-precipitation at different pH values.
onto MnFe2O4 nanoparticles with varying pH preparation values.
This journal is © The Royal Society of Chemistry 2018
RSC Adv., 2018, 8, 6709–6718 | 6713 View Article Online RSC Advances Paper Table 2 Kinetic parameters, q , q
, k , k , and correlation of coe O nanoparticles prepared at e e, cal 1 2
fficient R2 for the adsorption of RhB onto MnFe2 4 varying pH values Pseudo-rst order Pseudo-second order Samples qe (mg gû1) qe, cal (mg gû1) k 1 (minû1 ) R2 q e, cal(mg g û1) k2 (g mgû1 minû1) R2 MnFe2O4 -pH 9.0 7.37 6.61 0.101 0.9587 7.76 0.283 0.9916 MnFe2O4 -pH 9.5 7.57 3.97 0.079 0.9143 7.78 0.469 0.9975 MnFe2O4 -pH 10.0 7.92 4.55 0.078 0.9295 8.10 0.460 0.9976 MnFe2O4 -pH 10.5 8.35 3.97 0.059 0.8975 8.45 0.443 0.9967 24. ercial 3.0 Unported Licence.
suitable kinetic model which is expressed as the following
The Freundlich isotherm is one of the applicable models to 57: m equation:
describe heterogeneous surface adsorption and multilayer om 8 06: dq
adsorption under various non-ideal conditions. The Freundlich t onC ¼ k N dt 2ðqe û qtÞ (5) ion-
where k2 is the pseudo-second order rate constant (g ttribut
mgû1 minû1). Aer integrating eqn (5), the linear tting is A
expressed as the following equation: ons m t 1 t ¼ þ (6) om q 2 t k2qe qe C
ry 2018. Downloaded on 26/02/201 reative
Fig. 8c shows pseudo-second-order kinetic models for RhB ua C r a
adsorption onto MnFe2O4 nanoparticles with varying pH prep- ebr
aration values. The adsorption kinetics and parameters of k2 and q ed unde
e, cal from the intercept and slope of the plot of t/qt versus t d on 12 F
are shown in Table 2. The R2 values show that the RhB removal icens ishe
kinetics can be approximated using a pseudo-second order s l ubl
model. Thus, the pseudo-second order model is more appro- rticle i
priate for explaining this adsorption process. s a rticle. P hi T ccess A n A 3.6 Adsorption isotherms pe O
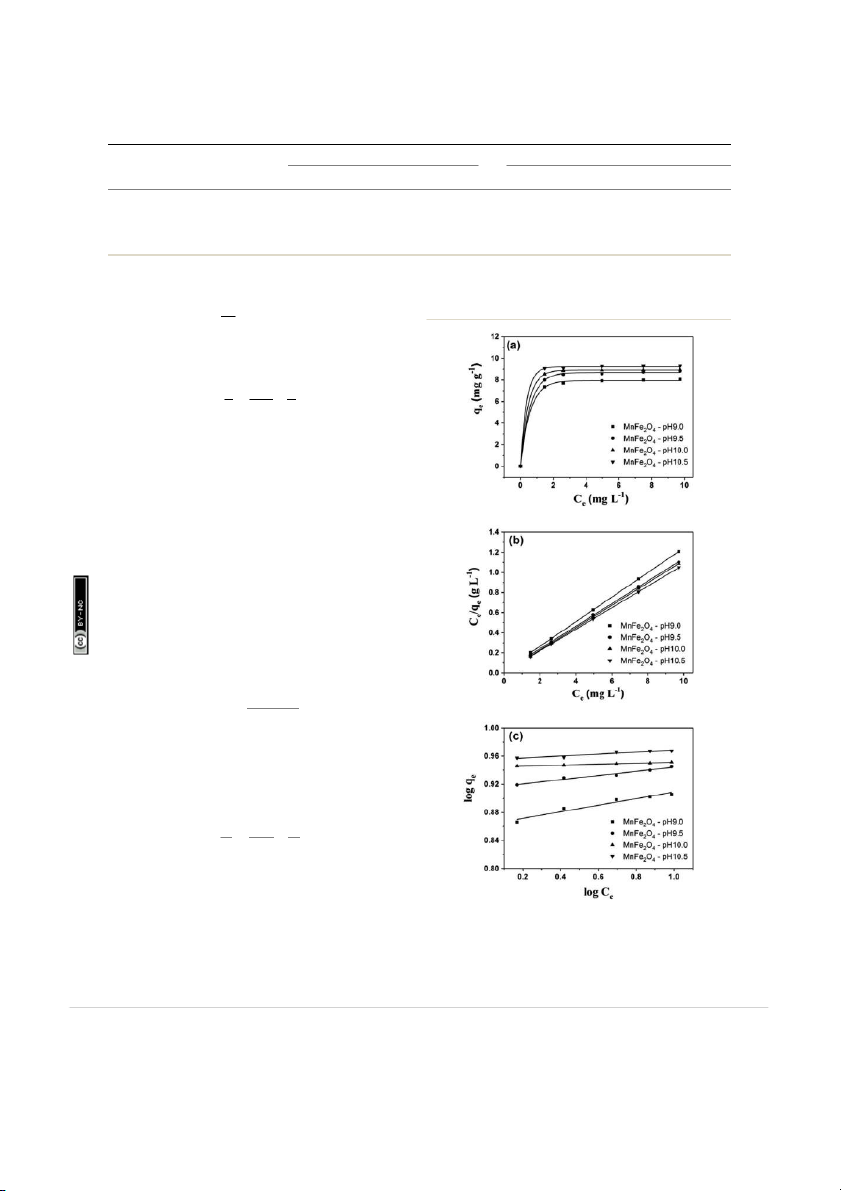
Two adsorption isotherm models, Langmuir and Freundlich
equations, were used to further describe the adsorption equi-
librium. The Langmuir equation describes monolayer adsorp-
tion with limited homogeneous sites. The Langmuir model is
given by the following equation:50,51 q q mKLCe e ¼ (7) ð1 þ KLCeÞ
where Ce, KL, qe, qm , are the concentration of adsorbate at
equilibrium (mg Lû1), Langmuir constant (L mg û1), the amount
of solute adsorbed at the equilibrium of RhB (mg gû1), and the
maximum adsorption capacity of RhB (mg gû1 ), respectively.
Eqn (7) can be expressed in a linear form as displayed in the following equation: Ce 1 C ¼ þ e (8) qe KLqm qm
Fig. 9a shows linear forms of the isotherms for representa-
tive RhB adsorption by MnFe2O4 nanoparticles with varying
preparation of pH values. The Langmuir isotherm for RhB Fig. 9
(a) Adsorption isotherms, (b) a typical linear Langmuir, and (c)
adsorption on MnFe2O4 nanoparticles was examined from
Freundlich isotherms of RhB removal using MnFe 2O 4 nanoparticles
a linear plot of Ce/qe versus Ce as presented in Fig. 9b.
with varying pH preparation values.
6714 | RSC Adv., 2018, 8, 6709–6718
This journal is © The Royal Society of Chemistry 2018 View Article Online Paper RSC Advances Table 3
Extracted values of q , K , K , and n from RhB adsorption using MnFe O nanoparticles by curve m L f 2 4 fitting based on Langmuir and Freundlich isotherms Langmuir equation Freundlich equation Samples qe (mg gû1 ) qm (mg g û1) KL (L mg û1) R2 K f (L mgû1) 1/n R 2 MnFe2O4 -pH 9.0 8.04 8.09 10.75 0.9998 7.28 0.0469 0.9052 MnFe2O4 -pH 9.5 8.81 8.83 13.33 0.9998 8.22 0.0295 0.9688 MnFe2O4 -pH 10.0 8.94 8.94 22.82 0.9999 8.80 0.0170 0.9869 MnFe2O4 -pH 10.5 9.28 9.30 34.68 0.9999 9.01 0.0139 0.9139 24. ercial 3.0 Unported Licence. 57: m
isotherm can be shown in the simplest model50,51 as the
depends on several factors such as size, morphology, and om following: speci 8 06:
c surface area. Moreover, the extrinsic properties of onC 1
adsorption capacity such as adsorbent loading and initial dye N qe ¼ KFCen (9)
concentration signicantly affected to the removal efficiency. ion- where K
No report has been found for MnFe 2O4 reacting with RhB from
F and 1/n are the adsorption capacity at unit concen- – ttribut
tration (L mgû1) and adsorption intensity, respectively. The 1/n
previous work (Table 5).58 63 It was found that MnFe2O4 nano- A
indicates the degree of non-linearity between solution concen-
particles can adsorb RhB from water with adsorption capacity of ons m
tration and adsorption, 1/n ¼ 0 (irreversible), 0 < 1/n < 1
9.30 mg gû1. This indicates that the prepared MnFe2O4 nano- om
(favorable), and 1/n > 1 (unfavorable). The linear form of the
particles can be considered as a promising adsorbent for the C
Freundlich isotherm can be expressed as the following
removal of rhodamine B from aqueous solution. equation:
ry 2018. Downloaded on 26/02/201 reative ua C 3.7
Fourier transform infrared analysis 1 r a ebr log q log C e ¼ log KF þ n e (10)
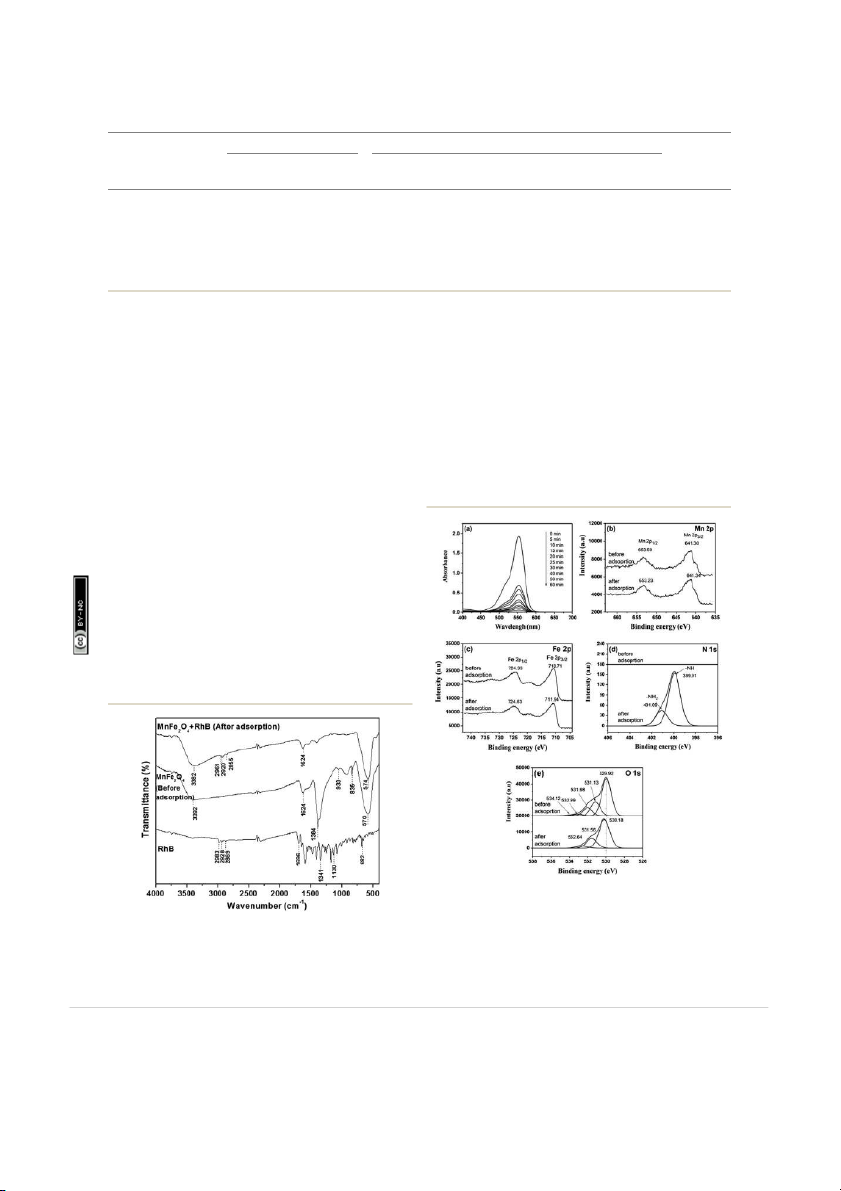
The FTIR spectroscopy was performed to investigate the
possible interactions between MnFe2 O4 nanoparticles and RhB ed unde as shown in Fig. 10. The MnFe d on 12 F The values of K
2O4 -pH 10.5 exhibits an adsorp-
F , n, and R2 are shown in Table 3. The tting icens
tion peak at 1624 cmû1, corresponding to O ishe s l
result of the Freundlich model using eqn (10) for RhB adsorp- –H group due to the ubl
adsorbed water or moisture in samples. The broad band at
tion on MnFe2O4 nanoparticles is shown in Fig. 9c. From the rticle i
around 3392 cmû1 is attributed to the symmetric vibration of
tting results of the Langmuir and Freundlich models, the s a rticle. P hi
experiment isotherm ts quite well with the Langmuir model
–OH groups of H 2O adsorbed by the sample. Meanwhile, the T
two bands at 576 and 1384 cmû1 can be attributed to the
based on an examination of the values of each model's constant
intrinsic vibrations of octahedral coordinated metal ions in the ccess A
and correlation coefficient (R2). This implies that the RhB
spinel structure and OH bending vibration, respectively. Typi- n A
adsorption onto MnFe2O4 is monolayer adsorption and the pe
cally, the metal oxide vibrations occur below 1000 cmû1.64,65 For O
adsorption sites of MnFe2O4 nanoparticles are homogeneous.
spectrum of RhB, the weak intensity band at 2983 cmû1 is
Moreover, the practical value of the equilibrium adsorption
ability is much closer to the theoretical value obtained from the
associated with the aromatic C–H vibrations, which also appear Langmuir model.
at 1130 cmû1 (plane bending) and at 682 cmû1 (wagging vibra-
The adsorption capacity of the as-prepared MnFe
tions). Moreover, the vibration bands in 2928–2869 cmû1 is 2O4 nano-
particles was compared with other reports as shown in Table
inferred to the presence of RhB. In addition, the band at 4.
1696 cmû1 corresponds to the C
52–57 It was found that the adsorption capacity of adsorbents ]O stretching vibration, while
the band at 1341 cmû1 is associated with aromatic skeletal C–C Table 4
Comparison of the studied dyes with MnFe O and MnFe O -based composites as adsorbents based on the removal capacities 2 4 2 4 Properties Adsorption properties SSA Ms Initial dye Adsorbent loading qe Adsorbent Size (nm) (m2 gû1) (emu gû1) Dye concentration (mg L û1) (g Lû1) (mg gû1) Reference MnFe2O4 80–100 — 78.4 Congo red 100 0.3 92.4 52 MnFe2O4 200–290 155.7 18.8 Congo red 150 16 25.78 53 MnFe2O4 2470 68.6 42.8 Azo dye acid 100 4 53.8 54 red B MnFe2O4 /bentonite 300–800 130 — AR138 100 0.1 g/30 ml — 55 MnFe2O4 /PW 21.1–25.6 — 1.53 Congo red 50–100 0.05–0.1 g 86.96 56 MnFe2O4 @resin <5 (TEM) — 6.2 Congo red 10 0.2 1000 57 MnFe2O4 5 53.99 41.48 RhB 7.5 0.1 9.30 In this study
This journal is © The Royal Society of Chemistry 2018
RSC Adv., 2018, 8, 6709–6718 | 6715 View Article Online RSC Advances Paper Table 5
Comparison of the studied RhB with different types of adsorbents based on the adsorption capacities Properties Adsorption properties Size SSA Ms Initial dye Adsorbent loading qe Adsorbent (nm) (m2 gû1) (emu gû1) Dye concentration (mg Lû1) (g Lû1) (mg gû1) Reference Fly ash 7500 40.16 40.16 RhB 5–25 20 0.193–0.173 58 ZnFe2O4 4–13 139 139 RhB 5–25 0.15 5.02–9.38 59 ZnTi0.6Fe1.4O4 20 — — RhB 4–36 0.05–2.0 8–17 60 BiFeO3 60–80 — — RhB 25 0.5 g 64.22 61 CoFe2O4/graphene oxide 14.58 239.76 59.2 RhB 3.75 0.25 121.8 62 Graphene/Fe3 O4 <50 — — RhB 20 0.6 30.211 63 24. ercial 3.0 Unported Licence. MnFe2O4 5 53.99 41.48 RhB 7.5 0.1 9.30 In this study 57: m om 8 06: onC N
stretch.66–68 The appearances of the three peaks at 2961, 2920,
spectrum of the MnFe2O 4 nanoparticles/RhB while disappear- ion-
2855 cmû1 aer RhB adsorption could be attributed to the
ing in the MnFe2O4 nanoparticles. Therefore, this indicates the
formation of chemical bonds between RhB and MnFe2O4. These
presence RhB on the surface of the MnFe2 O4 nanoparticles. The ttribut
peaks shied aer RhB adsorption, conrming the interactions
O 1s deconvoluted spectrum of MnFe2O4 nanoparticles before A between MnFe2O4 and RhB.32,69
RhB adsorption (Fig. 11e) presents four Gaussian peaks ons m
centered at 529.92, 531.13, 531.98, and 532.99–534.12 eV asso- om
ciated with the binding energies of the lattice oxygen species C 3.8 UV-vis and XPS analyses
(O2û), highly oxidative oxygen species (O 2û 2 /Oû), hydroxyl
ry 2018. Downloaded on 26/02/201 reative
The adsorption mechanism of the MnFe
groups (–OH), and surface adsorbed water molecules (H2O), 2O4-pH 10.5 to remove ua C r a
RhB was investigated using UV-vis absorption spectroscopy and
respectively.69,76,77 The XPS spectrum of the O 1s shows a chem- ebr
X-ray photoelectron spectroscopy (XPS) techniques. From
ical shi aer adsorption of RhB onto the MnFe2O4 surface.
Fig. 11a, the characteristic peak of RhB appeared on the spec-
This is attributed to the adsorption of RhB on the surface of ed unde d on 12 F
trum of MnFe2O4 /RhB. This peak signies that RhB was icens ishe
absorbed on the surface of the MnFe s l 2O4 nanoparticles. In ubl
Fig. 11b, the two peaks of Mn 2p, centered at about 641 and rticle i
653 eV, correspond to the binding energy for Mn 2p3/2 and Mn s a rticle. P hi
2p1/2 , indicating the oxidation state of Mn2+ in MnFe2O4 T
nanoparticles.70,71 Moreover, the Fe 2p spectra show two main ccess A
peaks at the binding energies of about 711 and 724 eV, which n A
are assigned to the Fe 2p3/2, and Fe 2p1/2 of Fe3+, respectively pe O
(Fig. 11c).72,73 The interaction of RhB and MnFe2O4 nano-
particles at the interface was also determined by XPS technique.
The N 1s spectra of MnFe2O4 nanoparticles aer RhB adsorp-
tion were contributed to the components of –NH2 (401 eV) and
–NH (399 eV) (Fig. 11d).74,75 The N 1s peaks appearing in the Fig. 11
(a) UV-visible absorption spectra of MnFe 2O4 prepared at pH
of 10.5 with different adsorption times of RhB adsorption in aqueous
solution. XPS spectra of MnFe2O4 microspheres before and after RhB Fig. 10
FTIR spectra of RhB and MnFe2O4-pH 10.5 before and after
adsorption. Peak-fitting XPS spectra in the (b) Mn 2p, (c) Fe 2p, (d) N 1s, RhB adsorption.
and (e) O 1s regions of MnFe2O4 nanoparticles and MnFe2 O4/RhB.
6716 | RSC Adv., 2018, 8, 6709–6718
This journal is © The Royal Society of Chemistry 2018 View Article Online Paper RSC Advances Conflicts of interest
There are no conicts to declare. Acknowledgements
We wish to thank the following organizations for nancial
support: the Thailand Graduate Institute of Science and Tech-
nology Development Agency (TGIST), National Science and
Technology Development Agency (NSTDA); the Center of
Excellence in Materials Science and Technology, Chiang Mai 24. ercial 3.0 Unported Licence. 57: m
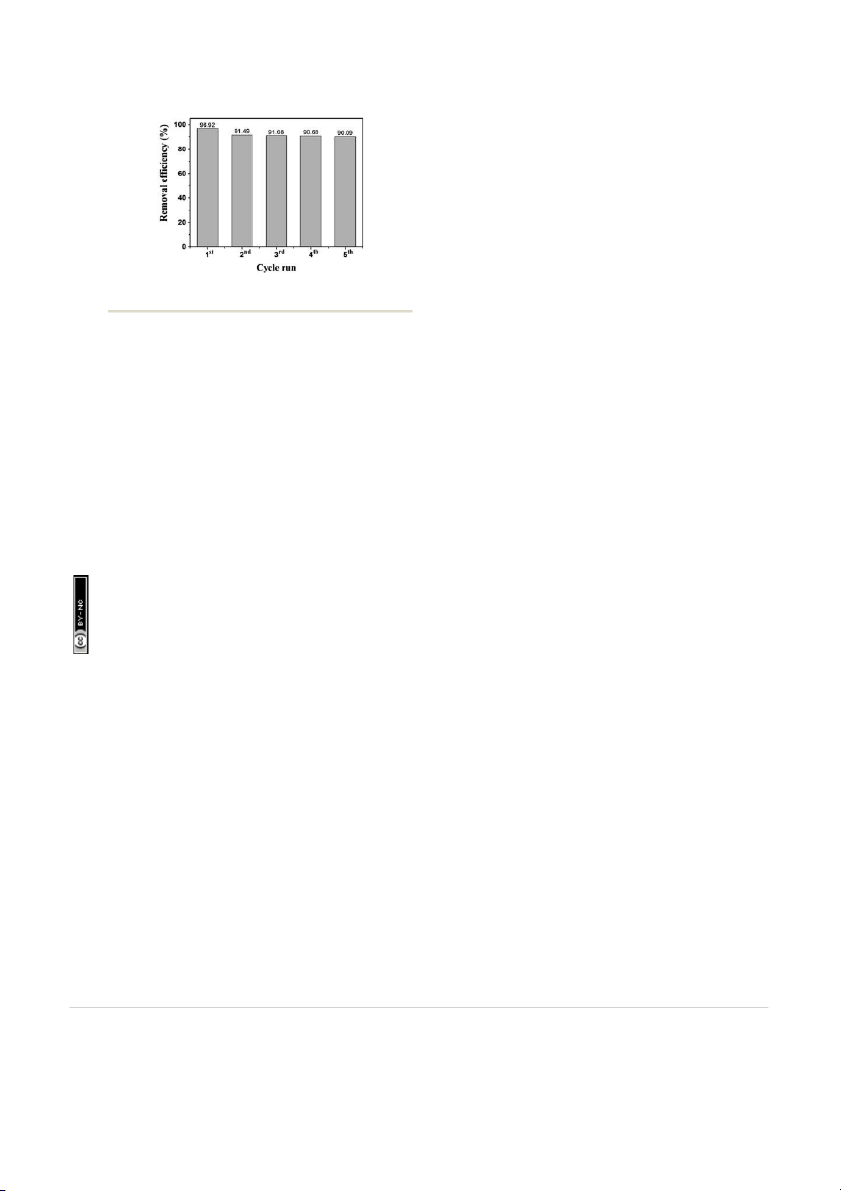
University under the administration of Materials Science Fig. 12
Removal efficiencies of RhB during adsorption cycles for om
Research Center, Faculty of Science and the Graduate School, MnFe 8 06: 2 O4-pH 10.5. onC
Chiang Mai University. Finally, we would like to thank Ms. N
Cythia Bail for her grateful kindness and valuable guidance for ion- MnFe manuscript preparation.
2O4 particles.78,79 The signicant binding energy shis ttribut
observed from XPS study as well as the results from UV-vis and A
zeta potential analyses suggest there is strong electrostatic and References ons m
chemical interactions between MnFe2O4 and RhB. These results om
conrm the adsorption of RhB on the MnFe
1 S. Zhu, T. Xu, H. Fu, J. Zhao and Y. Zhu, Environ. Sci. Technol., 2O4 surface. C 2007, 41, 6234.
2 P. Saritha, C. Aparna, V. Himabindu and Y. Anjaneyulu, 3.9 Reusability of MnFe reative 2O4 nanoparticles
ry 2018. Downloaded on 26/02/201
J. Hazard. Mater., 2007, 149, 609. ua C
Reusability is one of the prerequisites to verify the practicality of r a
3 S. C. Jung, Water Sci. Technol., 2011, 63(7), 1491. ebr
a direct application of adsorbents for dye removal. The stability
4 T. Yao, S. Guo, C. Zeng, C. Wang and L. Zhang, J. Hazard.
of the MnFe2O 4-pH 10.5 was evaluated by repeating experiments Mater., 2015, 292, 90. ed unde d on 12 F
on the RhB adsorption as shown in Fig. 12.
5 Q. Li, Q. Yue, Y. Su, B. Gao and J. Li, J. Hazard. Mater., 2009, icens ishe
Aer each run, the MnFe2O4 nanoparticles were collected 165, 1170. s l ubl
using a magnetic eld and washed by ultrasonic cleaning with
6 E. Baldev, D. Mubarakali, A. Ilavarasi, D. Pandiaraj, rticle i
deionized water following with absolute ethanol. Then, the
K. A. Sheik Syed Ishack and N. Thajuddin, Colloids Surf., B, s a rticle. P
separated MnFe2O 4 nanoparticles were re-dispersed in fresh hi 2013, 105, 207. T
RhB solution with the same concentration (2 10û5 M), and
7 I. K. Konstantinou and T. A. Albanis, Appl. Catal., B, 2004, 49,
next the new adsorption cycle began again. Aer 5 cycles, the ccess A 1. removal e n A
fficiency decreased by a small fraction from 96.92% to
8 H. Lee, S. H. Park, Y.-K. Park, B. H. Kim, S.-J. Kim and pe 90.09%. O
S.-C. Jung, Chem. Cent. J., 2013, 7(156), 1.
9 C. Galindo, P. Jacques and A. Kalt, Chemosphere, 2001, 45, 4. Conclusions 997.
10 W. S. Kuo and P. H. Ho, Chemosphere, 2001, 45, 77.
The magnetically separable MnFe2O4 nanoparticles were
11 A. Y. Zahrim and N. Hilal, Water Resources and Industry,
successfully prepared by a co-precipitation method with varying 2014, 3, 23.
pH values. It was found that the physical, magnetic, and
12 S. A. Avlonitis, I. Poulios, D. Sotiriou, M. Pappas and
adsorption properties of MnFe2 O4 nanoparticles were changed
K. Moutesidis, Desalination, 2008, 221, 259.
by controlling the pH value during MnFe2O4 nanoparticles
13 Q. Y. Yue, B. Y. Gao, Y. Wang, H. Zhang, X. Sun, S. G. Wang
preparation. The MnFe2O4-pH 10.5 sample exhibited the high-
and R. R. Gu, J. Hazard. Mater., 2008, 152, 221.
est adsorption capacity towards RhB solution. The highest
14 S. Wang, Dyes Pigm., 2008, 76, 714.
adsorption of RhB on the MnFe2O4-pH 10.5 sample depends on
15 M. Sundrarajan, G. Vishnu and K. Joseph, Dyes Pigm., 2007,
two factors that are large pore size and negative charge surface. 75, 273.
Moreover, the reusability of MnFe2O 4-pH 10.5 particles can be
16 J. Liu, S. Ma and L. Zang, Appl. Surf. Sci., 2013, 265, 393.
achieved by an external magnetic eld separation with magne-
17 H. Tajizadegan, M. Jafari, M. Rashidzadeh and A. Saffar-
tization of 41.48 emu gû1. The experimental results correlated
Teluri, Appl. Surf. Sci., 2013, 276, 317.
reasonably well with the Langmuir model. The adsorption
18 W. Deligeer, Y. W. Gao and S. Asuha, Appl. Surf. Sci., 2011,
kinetics of RhB by MnFe2O4 followed the pseudo-second order 257, 3524.
model. This study concludes that the facile synthesized
19 M. Anbia, S. Asl Hariri and S. N. Ashrazadeh, Appl. Surf. Sci.,
magnetic MnFe2O 4 nanoparticles prove to be effective as 2010, 256, 3228.
a potential adsorbent for the removal of RhB from aqueous
20 J. Hu, I. M. C. Lo and G. Chen, Langmuir, 2005, 21, 11173.
solutions and a promising adsorbent for further utilizations in
21 H. F. Liang and Z. C. Wang, Mater. Chem. Phys., 2010, 124,
dye removal from colored textile wastewater. 964.
This journal is © The Royal Society of Chemistry 2018
RSC Adv., 2018, 8, 6709–6718 | 6717 View Article Online RSC Advances Paper
22 S. Zhang, H. Niu, Y. Cai, X. Zhao and Y. Shi, Chem. Eng. J.,
50 Y. C. Wong, Y. S. Szeto, W. H. Cheung and G. McKay, 2010, 158, 599. Langmuir, 2003, 19, 7888.
23 X. Bao, Z. Qiang, W. Ling and J. Chang, Sep. Purif. Technol.,
51 G. A. Say˘gili, J. Mol. Liq., 2015, 211, 515. 2013, 117, 104.
52 L. Wang, J. Li, Y. Wang, L. Zhao and Q. Jiang, Chem. Eng. J.,
24 J. G. Parsons, M. L. Lopez, J. R. Peralta-Videa and 2012, 181–182, 72.
J. L. Gardea-Torresdey, Microchem. J., 2009, 91, 100.
53 L. Yang, Y. Zhang, X. Liu, X. Jiang, Z. Zhang, T. Zhang and
25 J. Dui, G. Zhu and S. Zhou, ACS Appl. Mater. Interfaces, 2013,
L. Zhang, Chem. Eng. J., 2014, 246, 88. 5, 10081.
54 R. Wu and J. Qu, J. Chem. Technol. Biotechnol., 2005, 80, 20.
26 I. Ibrahim, I. O. Ali, T. M. Salama, A. A. Bahgat and
55 S. Hashemian, Afr. J. Biotechnol., 2010, 9(50), 8667.
M. M. Mohamed, Appl. Catal., B, 2016, 181, 389.
56 G. A. Say˘gılı, J. Mol. Liq., 2015, 211, 515.
27 D. Chen, Y. Zhang and Z. Kang, Chem. Eng. J., 2013, 215 24. –216,
57 M. H. Beyki, H. Alijani and Y. Fazli, J. Mol. Liq., 2016, 216, 6. ercial 3.0 Unported Licence. 57: m 235.
58 T. A. Khan, I. Ali, V. Vati Singh and S. Sharma, J. Environ. om
28 W. Wang, Z. Ding, M. Cai, H. Jian, Z. Zeng, F. Li and J. P. Liu, Prot., 2009, 3, 11. 8 06: onC
Appl. Surf. Sci., 2015, 346, 348.
59 W. Konicki, D. Siber and U. Narkiewicz, Pol. J. Chem. N
29 Y. Ren, N. Li, J. Feng, T. Luan, Q. Wen, Z. Li and M. Zhang, J. Technol., 2017, 19(4), 65. ion-
Colloid Interface Sci., 2012, 367, 415.
60 J. Feng, Y. Hou, Y. Wang, X. Wang, H. Chen and L. Li, Sci.
30 X. Hou, J. Feng, X. Xu and M. Zhang, J. Alloys Compd., 2010, China: Chem., 2016, 59, 1033. ttribut A 491, 258.
61 T. Soltani and M. H. Entezari, Chem. Eng. J., 2013, 223, 145. ons
31 M. P. Reddy, A. M. A. Mohamed, M. V. Ramana, X. B. Zhou
62 W. Yin, S. Hao and H. Cao, RSC Adv., 2017, 7, 4062. m
and Q. Huang, J. Magn. Magn. Mater., 2015, 395, 185.
63 M. Mehrali, E. Sadeghinezhad, A. R. Akhiani, S. T. Latibari, om C
32 X. Hou, J. Feng, Y. Ren, Z. Fan and M. Zhang, Colloids Surf.,
H. S. C. Metselaar, A. S. Kherbeet and M. Mehrali, Powder A, 2010, 363, 1. Technol., 2017, 308, 149.
ry 2018. Downloaded on 26/02/201 reative
33 M. Augustin and T. Balu, Mater. Today, 2015, 2, 923.
64 S. Kanagesan, S. B. A. Aziz, M. Hashim, I. Ismail, ua C r a
34 C. Pereira, A. M. Pereira, C. Fernandes, M. Rocha, R. Mendes,
S. Tamilselvan, N. B. B. M. Alitheen, M. K. Swamy and ebr M. P. Fern´
andez-Garc´ıa, A. Guedes, P. B. Tavares,
B. P. C. Rao, Molecules, 2016, 21, 312. ed unde J.-M. Gren`eche, J. P. Ara´
ujo and C. Freire, Chem. Mater.,
65 P. Iranmanesh, S. Saeednia, M. Mehran and S. Rashidi d on 12 F 2012, 24, 1496.
Dafeh, J. Magn. Magn. Mater., 2017, 425, 31. icens ishe
35 M. J. Akhta and M. Younas, Solid State Sci., 2012, 14, 1536.
66 D. Zhao, C. Chen, Y. Wang, W. Ma, J. Zhao, T. Rajh and s l ubl
36 N. S. Gajbhiye and G. Balaji, Thermochim. Acta, 2002, 385,
L. Aang, Environ. Sci. Technol., 2008, 42, 308. rticle i 143–151.
67 Q. He, J. Shi, X. Cui, J. Zhao, Y. Chen and J. Zhou, J. Mater. s a rticle. P hi
37 J. Wang, T. Deng, Y. Lin, C. Yang and W. Zhan, J. Alloys Chem., 2009, 19, 3395. T Compd., 2008, 450, 532.
68 R. M. Dukali, I. M. Radovi´
c, D. B. Stojanovi´c, D. M. ˇSevi´c, ccess A
38 M. Vadivel, R. R. Babu, K. Sethuraman, K. Ramamurthi and
V. J. Radojevi´c, D. M. Joci´
c and R. R. Aleksi´c, J. Serb. Chem. n A
M. Arivanandhan, J. Magn. Magn. Mater., 2014, 362, 122. Soc., 2014, 79(7), 867. pe O
39 Y. Xiao, H. Liang, W. Chen and Z. Wang, Appl. Surf. Sci.,
69 J. Fu, Q. Xin, X. Wu, Z. Chen, Y. Yan, S. Liu, M. Wang and 2013, 285, 498.
Q. Xu, J. Colloid Interface Sci., 2016, 461, 292.
40 X. Fang, J. Xiao, S. Yang, H. He and C. Sun, Appl. Catal., B,
70 Q. Tang, L. Jiang, J. Liu, S. Wang and G. Sun, ACS Catal., 2015, 162, 544. 2014, 4, 457.
41 T. Huang, S. Mao, J. Yu, Z. Wen, G. Lu and J. Chen, RSC Adv.,
71 J. Chen, W. Wen, L. Kong, S. Tian, F. Ding and Y. Xiong, Ind. 2013, 3, 16657.
Eng. Chem. Res., 2014, 56, 6297.
42 A. Molea, V. Popescu, N. A. Rowson and A. M. Dinescu,
72 Y. Yao, Y. Cai, F. Lu, F. Wei, X. Wang and S. Wang, J. Hazard.
Powder Technol., 2014, 253, 22. Mater., 2014, 270, 61. 43 J. Jaramillo, B. A. Garz´
on and L. TiradoMej´ıa, J. Phys.: Conf.
73 Z. Zhang, Y. Wang, Q. Tan, Z. Zhong and F. Su, J. Colloid Ser., 2016, 687, 12.
Interface Sci., 2013, 398, 185.
44 Q. Hu, Y. Liu, X. Gu and Y. Zhao, Chemosphere, 2017, 181,
74 J. Zhang, T. Yao, C. Guan, N. Zhang, H. Zhang, X. Zhang and 328.
J. Wu, J. Colloid Interface Sci., 2017, 505, 130.
45 S. Zhang, H. Niu, Y. Cai, X. Zhao and Y. Shi, Chem. Eng. J.,
75 L. Chen, F. He, N. Zhao and R. Guo, Appl. Surf. Sci., 2017, 2010, 158, 599. 420, 669.
46 M. Iram, C. Guo, Y. Guan, A. Ishfaq and H. Liu, J. Hazard.
76 F.-T. You, G.-W. Yua, Y. Wang, Z.-J. Xing, X.-J. Liu and J. Li, Mater., 2010, 181, 1039.
Appl. Surf. Sci., 2017, 413, 387.
47 S. Wang, X. Zhang, L. Pan, F.-M. Zhao, J.-J. Zou, T. Zhang and
77 Y. J. Oh, J. J. Yoo, Y. I. Kim, J. K. Yoon, H. N. Yoon, J.-H. Kim
L. Wang, Appl. Catal., B, 2015, 64, 234.
and S. B. Park, Electrochim. Acta, 2014, 116, 118.
48 L. Wang, J. Li, Y. Wang, L. Zhao and Q. Jiang, Chem. Eng. J.,
78 T. Serizawa, H. Takeshita and M. Akashi, Langmuir, 1998, 14, 2012, 181–182, 72. 4088.
49 Y.-S. Ho, J. Hazad. Mater., 2006, 136, 681.
79 S. Banerjee and M. C. Chattopadhyaya, Arabian J. Chem., 2017, 10, S1629.
6718 | RSC Adv., 2018, 8, 6709–6718
This journal is © The Royal Society of Chemistry 2018
