Sách "Storytelling with Data: Let's Practice!" môn Khoa học dữ liệu | Trường Đại học Khoa học tự nhiên, Đại học Quốc gia Thành phố Hồ Chí Minh
Sách "Storytelling with Data: Let's Practice!" môn Khoa học dữ liệu | Trường Đại học Khoa học tự nhiên, Đại học Quốc gia Thành phố Hồ Chí Minh. Tài liệu được sưu tầm giúp bạn tham khảo, ôn tập và đạt kết quả cao. Mời bạn đọc đón xem.
Môn: Khoa học dữ liệu (HCMUS) 12 tài liệu
Trường: Trường Đại học Khoa học tự nhiên, Đại học Quốc gia Thành phố Hồ Chí Minh 1.1 K tài liệu
Tác giả:


Preview text:
cole nussbaumer knaflic storytelling with data storytelling with data Cover image: Catherine Madden
Cover design: Flight Design Co.
Copyright © 2020 by Cole Nussbaumer Knaflic. All rights reserved.
Published by John Wiley & Sons, Inc., Hoboken, New Jersey.
Published simultaneously in Canada.
No part of this publication may be reproduced, stored in a retrieval system, or transmitted in any
form or by any means, electronic, mechanical, photocopying, recording, scanning, or otherwise,
except as permitted under Section 107 or 108 of the 1976 United States Copyright Act, without
either the prior written permission of the Publisher, or authorization through payment of the ap-
propriate per-copy fee to the Copyright Clearance Center, Inc., 222 Rosewood Drive, Danvers,
MA 01923, (978) 750-8400, fax (978) 646-8600, or on the Web at www.copyright.com. Requests to
the Publisher for permission should be addressed to the Permissions Department, John Wiley &
Sons, Inc., 111 River Street, Hoboken, NJ 07030, (201) 748-6011, fax (201) 748-6008, or online at www.wiley.com/go/permissions.
Limit of Liability/Disclaimer of Warranty: While the publisher and author have used their best ef-
forts in preparing this book, they make no representations or warranties with respect to the accu-
racy or completeness of the contents of this book and specifically disclaim any implied warranties
of merchantability or fitness for a particular purpose. No warranty may be created or extended
by sales representatives or written sales materials. The advice and strategies contained herein
may not be suitable for your situation. You should consult with a professional where appropriate.
Neither the publisher nor author shall be liable for any loss of profit or any other commercial
damages, including but not limited to special, incidental, consequential, or other damages.
For general information on our other products and services or for technical support, please con-
tact our Customer Care Department within the United States at (800) 762-2974, outside the Unit-
ed States at (317) 572-3993, or fax (317) 572-4002.
Wiley publishes in a variety of print and electronic formats and by print-on-demand. Some
material included with standard print versions of this book may not be included in e-books or
in print-on-demand. If this book refers to media such as a CD or DVD that is not included in
the version you purchased, you may download this material at http://booksupport.wiley.com.
For more information about Wiley products, visit www.wiley.com. ISBN 978-1-119-62149-2 (paper) ISBN 978-1-119-62150-8 (ePub) ISBN 978-1-1196-2158-4 (ePDF)
Printed in the United States of America. 10 9 8 7 6 5 4 3 2 1 storytelling with data cole nussbaumer knaflic contents acknowledgments vii about the author ix introduction xi
chapter 1 understand the context 1
chapter 2 choose an effective visual 51
chapter 3 identify & eliminate clutter 107 chapter 4 focus attention 147
chapter 5 think like a designer 191 chapter 6 tell a story 235
chapter 7 practice more with Cole 285
chapter 8 practice more on your own 355
chapter 9 practice more at work 375 chapter 10 closing words 403 index 407 v acknowledgments
Thanks to everyone who helped this book come to be… 2018 2019 A M J J A S O N D J F M A M J J A S O
Simon Beaumont, Lisa Carlson, Amy Cesal, Robert Crocker,
Steven Franconeri, Megan Holstine, and Steve Wexler for your
draft manuscript review and thoughtful feedback.
Kim Schefler and Jasmine Kaufman for your sage guidance.
Catherine Madden and Matt Meikle for your creativity and
thought partnership. We've made a beautiful book!
Marika Rohn, my dear friend and editor extraordinaire: you've
helped the words in my head make sense on paper!
Jody Riendeau for creating order, taking things off my plate,
and bringing an awesome sense of levity to all that we do.
Elizabeth Ricks for your dedication and fantastic work sharing
SWD lessons with the world. Congrats also on baby Henry!
Avery, Dorian, and Eloise Knaflic, my three beautiful children:
you inspire me. You can be anything you want in life.
Randy Knaflic: you are my support, my voice of reason, my
confidant, my everything. You hold my heart.
Thanks also to Bill Falloon, Mike Henton, Carly Hounsome, Steven Kyritz, Kimberly Monroe-Hill, Purvi Patel, Jean-Karl Martin, Amy Laundicano,
Steve Csipke, RJ Andrews, Mike Cisneros, Alex Velez, Beatriz Tapia, Brenda Chi-Moran, and the team at Quad Graphics. Gratitude goes to all of
our clients and everyone reading these words now (that's you!). Thanks for being on this amazing journey with me. Happy practicing! vii about the author
Cole Nussbaumer Knaflic tells stories with data. She is the founder and CEO of
storytelling with data (SWD) and author of the best-selling book, storytelling with
data: a data visualization guide for business professionals (Wiley, 2015), which has
been translated into a dozen languages, is used as a textbook by more than 100
universities, and serves as the course book for tens of thousands of SWD work-
shop participants. For nearly a decade, Cole and her team have delivered knock-
out interactive learning sessions highly sought after by data-minded individuals,
companies, and philanthropic organizations all over the world. They also help
people create graphs that make sense and weave them into compelling stories
through the popular SWD blog, podcast, and monthly challenge.
Prior to SWD, Cole’s unique talent was honed through analytical roles in banking,
private equity, and as a manager on the Google People Analytics team. At Goo-
gle, she used a data-driven approach to inform innovative people programs and
management practices and traveled to Google offices throughout the US and Eu-
rope to teach the course she developed on data visualization. Cole has acted as
an adjunct faculty member at the Maryland Institute College of Art (MICA), where
she taught Introduction to Information Visualization, and regularly guest lectures
at prominent universities in the US and beyond.
Cole has a BS in Applied Math and an MBA from the University of Washington.
When she isn’t ridding the world of ineffective graphs, Cole is undertaking the
adventures of parenting three young children with her husband at home in the Midwest and on travels abroad. ix introduction
I often receive emails from people who have read my first book, storytelling with
data, or attended one of our workshops by the same name. There are notes of en-
couragement, support for the work we’re doing, and plenty of questions and re-
quests. I especially love hearing the success stories: reports of having influenced a
key business decision, spurred an overdue budget conversation, or prompted an
action that positively impacted an organization’s bottom line. The most inspiring
accounts are those of personal growth and recognition. One grateful reader ap-
plied storytelling with data principles during an interview, helping him land a new
job. All of this success is the result of people from different industries, functions,
and roles committing time to improve their ability to communicate with data.
I also hear regularly from people who want more. They’ve read the book and
understand the potential impact of telling stories with data, but struggle with the
practical application to their own work. They have additional questions or feel
they are facing nuanced situations that are keeping them from having the desired
impact. It’s clear that people crave more guidance and practice to help fully de-
velop their data storytelling skills.
Others reach out who are—or would like to be—teaching the lessons outlined in
storytelling with data. In many cases, they are university instructors (it’s amazing to
think that storytelling with data is used as a textbook at more than 100 universities
around the world!) or they are a part of a learning and development function with-
in an organization, interested in building an in-house course or training program.
There are also leaders, managers, and individual contributors who want to upskill
their teams or provide good coaching and feedback to others.
This book addresses all of these needs for individuals, teachers, and leaders. By
sharing invaluable insight through many practical examples, guided practice, and
open-ended exercises, I will help build your confidence and credibility when it
comes to applying and teaching others to apply the storytelling with data lessons. xi xii introduction
How this book is organized & what to expect
Each chapter starts with a brief recap of the key lessons that are covered in story-
telling with data. This is followed by:
practice with Cole: exercises based on real-world examples posed for you to con-
sider and solve, accompanied by detailed step-by-step illustration and explanation
practice on your own: more exercises and thought-provoking questions for you to
work through individually without prescribed solutions
practice at work: thoughtful guidance and hands-on exercises for applying the
lessons learned on the job, including practical instruction on when and how to
solicit useful feedback and iterate to refine your work from good to great
Much of the content you’ll encounter here is inspired by our storytelling with
data workshops. Because these sessions span many industries, so do the exam-
ples upon which I’ll draw. We’ll navigate between different topics—from digital
marketing to pet adoption to sales training—giving you a rich and varied set of
situations to learn from as you hone your data storytelling skills.
Warning: this is not a traditional book that you sit and read. To get the most out
of it, you’ll want to make it a fully interactive experience. I encourage you to
highlight, add bookmarks, and take notes in the margins. Expect to be flipping
between pages and examples. Draw, discuss with others, and practice in your
tools. This book should be beat up by the time you’re done with it: that will be
one indication that you’ve utilized it to the fullest extent!
How to use this book in conjunction with the original
SWD: let’s practice! works as a great companion guide to storytelling with data:
a data visualization guide for business professionals (Wiley, 2015; henceforth re-
ferred to as SWD). It will not replace the in-depth lessons taught there, but rather
augment them with additional dialogue, many more examples, and a focus on hands-on practice.
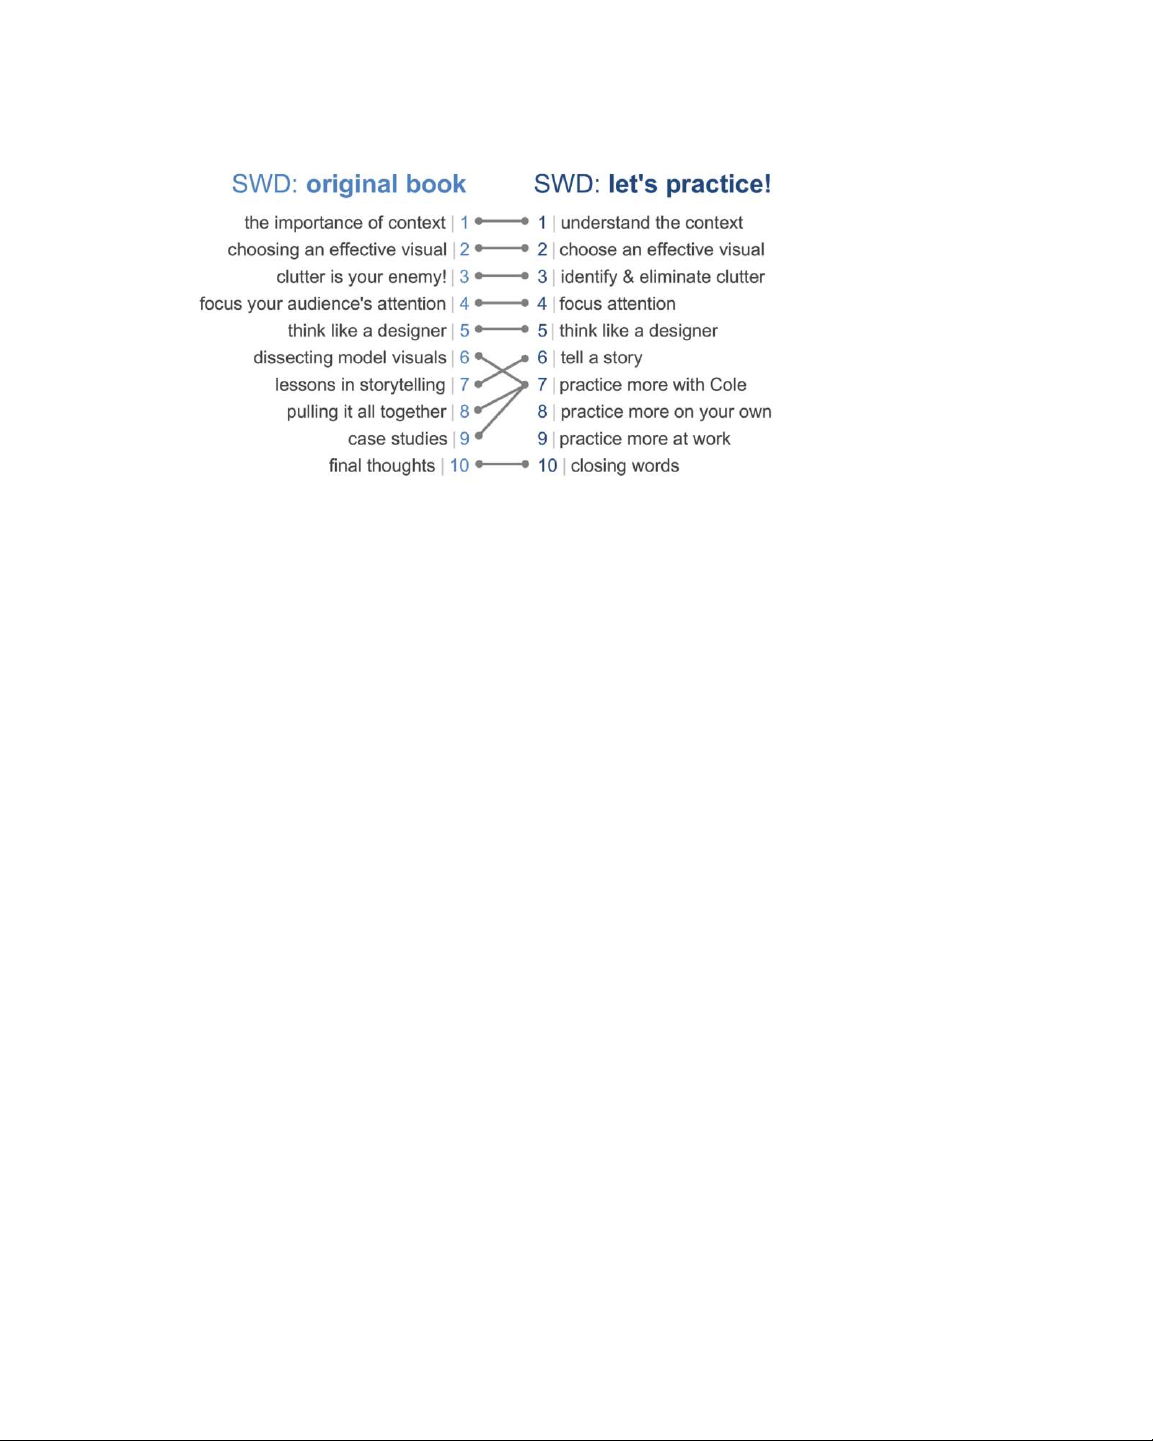
This book generally follows the same chapter structure as SWD with a couple of
differences, as shown in Figure 0.1. Chapters 7, 8, and 9 are comprehensive ex-
ercises that offer additional guidance and practice applying the lessons covered
throughout SWD and here. xiii how to use this book
FIGURE 0.1 How SWD chapters correspond to this book
If you’ve picked up both SWD and SWD: let’s practice!, you can use them in a
couple of ways. You can read SWD once from start to finish to understand the
big picture before digging into specifics. From there, you can determine which
lessons you’d like to practice and can dive into the relevant sections within this
book. Alternatively, you can peruse SWD one chapter at a time, then turn here to
practice what you’ve read through hands-on exercises.
If you’ve already read SWD, feel free to jump right in as you will be familiar with these topics.
And if you’ve only bought this book, there is enough context within to give you
the basics. You can always pick up a copy of SWD or check out the many resourc-
es at storytellingwithdata.com for supplemental guidance. Do you want to learn or teach?
SWD: let’s practice! was written with two different audiences in mind, united by
a common goal—to communicate more effectively with data. Broadly, these two distinct groups are:
1. Those wanting to learn how to communicate more effectively with data, and
2. Those wanting to provide feedback, coach, or teach others how to commu-
nicate more effectively with data.
While the content is relevant for both groups, there will be subtle differences
when it comes to getting the most out of it. Depending on your goal, the follow-
ing strategies will maximize efficiency. xiv introduction
I want to learn to communicate more effectively with data
Because some later content builds upon or refers back to earlier content or exer-
cises, begin with Chapter 1 and work through in numerical order. After that, you’ll
likely find yourself revisiting sections of interest and focusing your practice based
on your specific needs and goals.
Start by reviewing the lesson recap for a given chapter. If you encounter anything
that isn’t familiar and you have access to SWD, turn back to the corresponding
chapter for additional context.
After that, move straight into the practice with Cole exercises. First, work through
each on your own—don’t just jump to the solution (you’re only cheating yourself!).
If you’re using this book with others, many of these activities lend themselves well
to group discussion. The exercises in this section don’t necessarily need to be
worked through in order, though they do occasionally build upon prior exercises.
Once you’ve spent time on the given exercise (not just in your head: I strongly
encourage you to write, draw, and use your tools), read through the provided solu-
tion. Observe where there are similarities and differences between that and your
response. Be aware that there are very few situations where there is a single “right”
answer. Some approaches are better than others, but there are usually numerous
ways to solve a given problem. My solutions illustrate just one method that applies
the lessons covered in SWD. Do read through all of the solutions, as many points of
advice, tips, and nuances will arise that you will find helpful and insightful.
After completing the practice with Cole exercises, turn to the practice on your
own section for more. These problems are similar to those in the first section,
except that they don’t include any predetermined solutions. If you are working
in a group, have individuals first tackle a given exercise separately, then come
together to present and discuss. Invariably, different people approach exercises in
distinct ways, so you can learn a good deal through this sharing process. Confer-
ring with others is also great practice for talking through your design choices and
decisions, which can further clarify thinking and help improve future application.
Whether completing on your own or as part of a group, get feedback on your
recommended approach. This will help you understand if what you propose is
working, as well as where you can iterate to further improve effectiveness.
If, at any time, you find yourself with a current project that would benefit from ap-
plying the lessons outlined in a specific chapter, flip straight to the practice at work
exercise section within that chapter. These contain guided practice that can be ap-
plied directly to real-world work situations. The more you practice implementing the
various lessons in a work setting, the more they will become second nature.
Each chapter ends with discussion questions related to the lessons. Talk through these
with a partner or perhaps even use as the basis of a larger book club conversation. do you want to learn or teach? xv
While the exercise sections in each chapter focus primarily on applying the given
lesson, Chapters 7, 8, and 9 offer more comprehensive examples and exercises
for applying the entire storytelling with data process. Chapter 7 (“practice more
with Cole”) contains full-blown case studies presented for you first to solve, fol-
lowed by my thought process for tackling and completing. Chapter 8 (“practice
more on your own”) has additional case studies and robust exercises to practice
the process without prescribed solutions. Chapter 9 (“practice more at work”) has
tips on how to apply the storytelling with data process at work, guides to facilitate
group learning, and assessment rubrics that you can use to evaluate your own
work and seek feedback from others.
As part of your learning, it’s also imperative that you set specific goals. Commu-
nicate these to a friend, colleague, or manager. See Chapter 9 for more on this.
Next, let’s talk about how those interested in teaching others to effectively tell
stories with data can use this book.
I want to provide feedback, coach, or teach others
You might be a manager or leader who wants to give good feedback on a graph
or presentation from your team. Or perhaps you have a role in learning and de-
velopment and are building training programs around how to communicate effec-
tively with data. You may be a university instructor teaching students this import-
ant skill. In all of these scenarios, the chapter recap will provide an overview of the
given lesson. After that, you will likely find the most value in the second and third
exercise sections: practice on your own and practice at work. Each chapter ends
with discussion questions that can be assigned, incorporated into tests, or used
as the basis of group conversations.
The practice on your own section within each chapter contains targeted exercises
helping those undertaking them practice the lessons outlined in the respective
chapter and relevant section of SWD. These can be used as the basis of hands-on
exercises in a classroom setting or assigned as homework. Some will also lend
themselves well for use as group projects. These examples are provided without
prescribed solutions. The problems in these sections can also work as models:
consider where you could substitute data or visuals to create unique exercises.
Practice at work’s guided exercises can be used directly in a work setting as part
of an ongoing program for professionals. They can be assigned, completed, and
discussed in a group or classroom setting. Managers looking to develop their
team’s skills may ask them to focus on specific exercises through their work or
projects, or use with individuals as part of a goal-setting or career development
process. For those teaching, Chapter 9 has additional practice at work exercises,
including facilitator guides and assessment rubrics. xvi introduction A quick note on tools
Many tools are available for visualizing data. You may use spreadsheet applica-
tions like Excel or Google Sheets. Perhaps you are familiar with chart creators such
as Datawrapper, Flourish, or Infogram or data visualization software like Tableau
or PowerBI. Maybe you write code in R or Python or leverage Javascript libraries
like D3.js. Regardless of your tool of choice, pick one or a set of tools and get
to know them as best you can so the instrument itself doesn’t become a limiting
factor for effectively communicating with data. No tool is inherently good or evil—
pretty much any can be used well or not so well.
When it comes to undertaking the exercises in this book, you are encouraged to
use whatever means for visualizing the data you have at your disposal. These may
be tools you use currently, or possibly one or more that you’d like to learn. The
visuals that illustrate the practice with Cole solutions were all created in Microsoft
Excel. That said, this is certainly not your only choice and I welcome you to use
other tools. We are also adding solutions built in other tools to our online library for you to explore.
On the topic of tools, there are a couple I highly recommend having on hand
while reading this book: a pen or pencil and paper. You may consider dedicating
a notebook to use as you work your way through the various exercises. Many
direct you to write and sketch. There are important benefits to low-tech physical
creation and iteration that we’ll explore and practice, which can make the process
of working in your technical tools more efficient. Where to get the data
Downloads for the data throughout this book and for all of the visuals shown in
the solutions for the practice with Cole exercises can be found at storytellingwith-
data.com/letspractice/downloads. Let’s get started
There has never been a time in history where so many people have had access
to so much data. Yet, our ability to tell stories with our graphs and visualizations
has not kept pace. Organizations and individuals that want to move ahead must
recognize that these skills aren’t inherent and invest in their development. With a
thoughtful approach, we can all tell inspiring and influential stories with our data.
I’m excited to help you take your data storytelling to the next level. Let’s practice!
Tài liệu liên quan:
-

Trắc nghiệm môn Nhập môn khoa học dữ liệu | Trường Đại học Khoa học tự nhiên, Đại học Quốc gia Thành phố Hồ Chí Minh
44 22 -

Tài liệu Vật lí đại cương Cơ - Nhiệt - Khoa học dữ liệu | Trường Đại học Khoa học Tự nhiên, Đại học Quốc gia Thành phố Hồ Chí Minh
410 205 -
Css cheat sheet in web development - Khoa học dữ liệu | Trường Đại học Khoa học Tự nhiên, Đại học Quốc gia Thành phố Hồ Chí Minh
317 159 -
Đại số tuyến tính - Khoa học dữ liệu | Trường Đại học Khoa học Tự nhiên, Đại học Quốc gia Thành phố Hồ Chí Minh
273 137