Solution for assignment of chapter 5 | Môn Engineering Economy - Trường Đại học Quốc tế, Đại học Quốc gia Thành phố Hồ Chí Minh
Solution for assignment of chapter 5 Môn Engineering Economy. Tài liệu được sưu tầm gồm 11 trang, giúp bạn ôn tập tốt hơn. Mời các bạn đón xem.
Môn: Engineering Economy 10 tài liệu
Trường: Trường Đại học Quốc tế, Đại học Quốc gia Thành phố Hồ Chí Minh 2 K tài liệu
Tác giả:

Preview text:
lOMoAR cPSD| 58583460 Engineering Economy
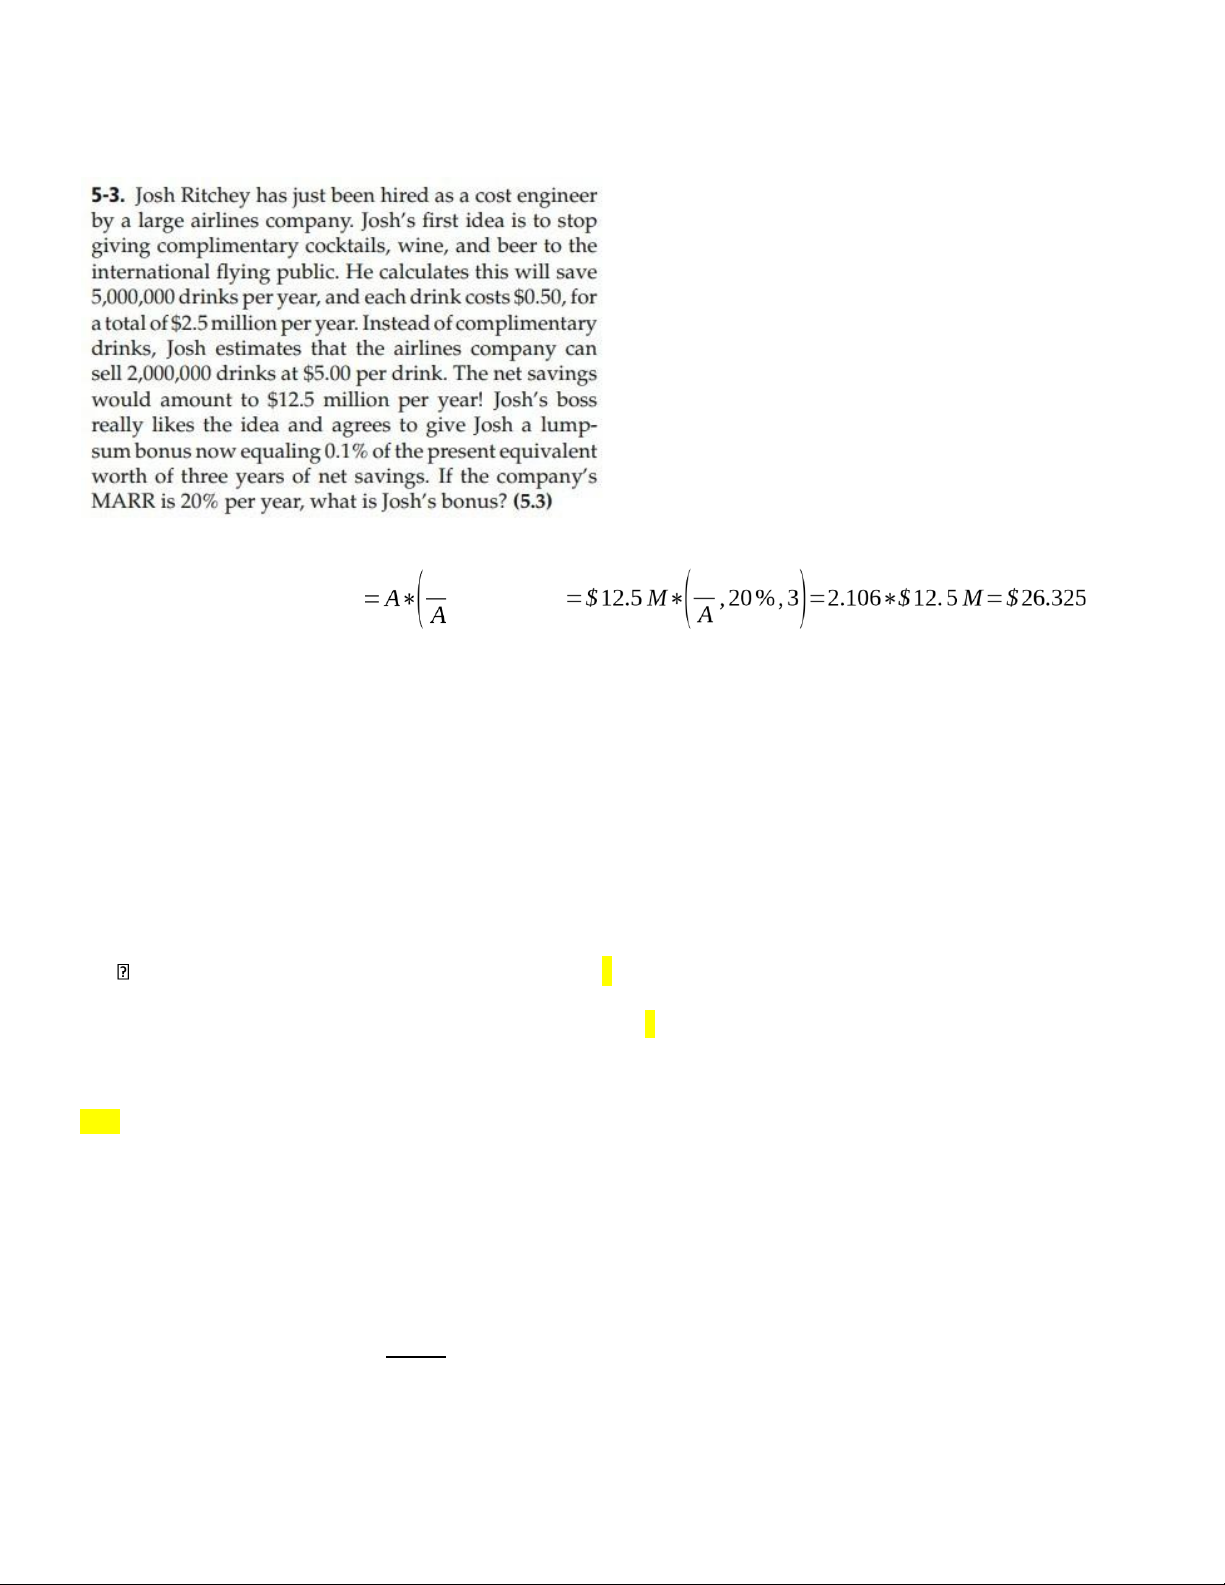
INDIVIDUAL ASSIGNMENT – CHAP 05 P P
Total present equivalent: PW, MARR,N)M
Josh’s total bonus ¿0.1%∗PW=0.1%∗$26.325=$26,325 5-11 N = 30 years r = 1.5%/ quater = 6%/ year Z = C = $10000
Vn = $10,000 (P/F, 6%, 30) + $600 (P/A, 6%, 30) = ?
If i = 7%, Vn = $10,000 (P/F, 7%, 30) + $600 (P/A, 7%, 30) = ? 5-16 i=10%/ year A = $1500/year F5 =$10000 in 5 years CW $1500
Present money by A1=$1500: P0= 0.1 lOMoAR cPSD| 58583460 Engineering Economy
The money in the end of first year by A5: A1=$10000(A/F, 10%, 5) =? $1500 A1 CW(10%)= + =? 0.1 0.1
b. Find the value for N for which A(P/A,10%,N) = CW (10%)
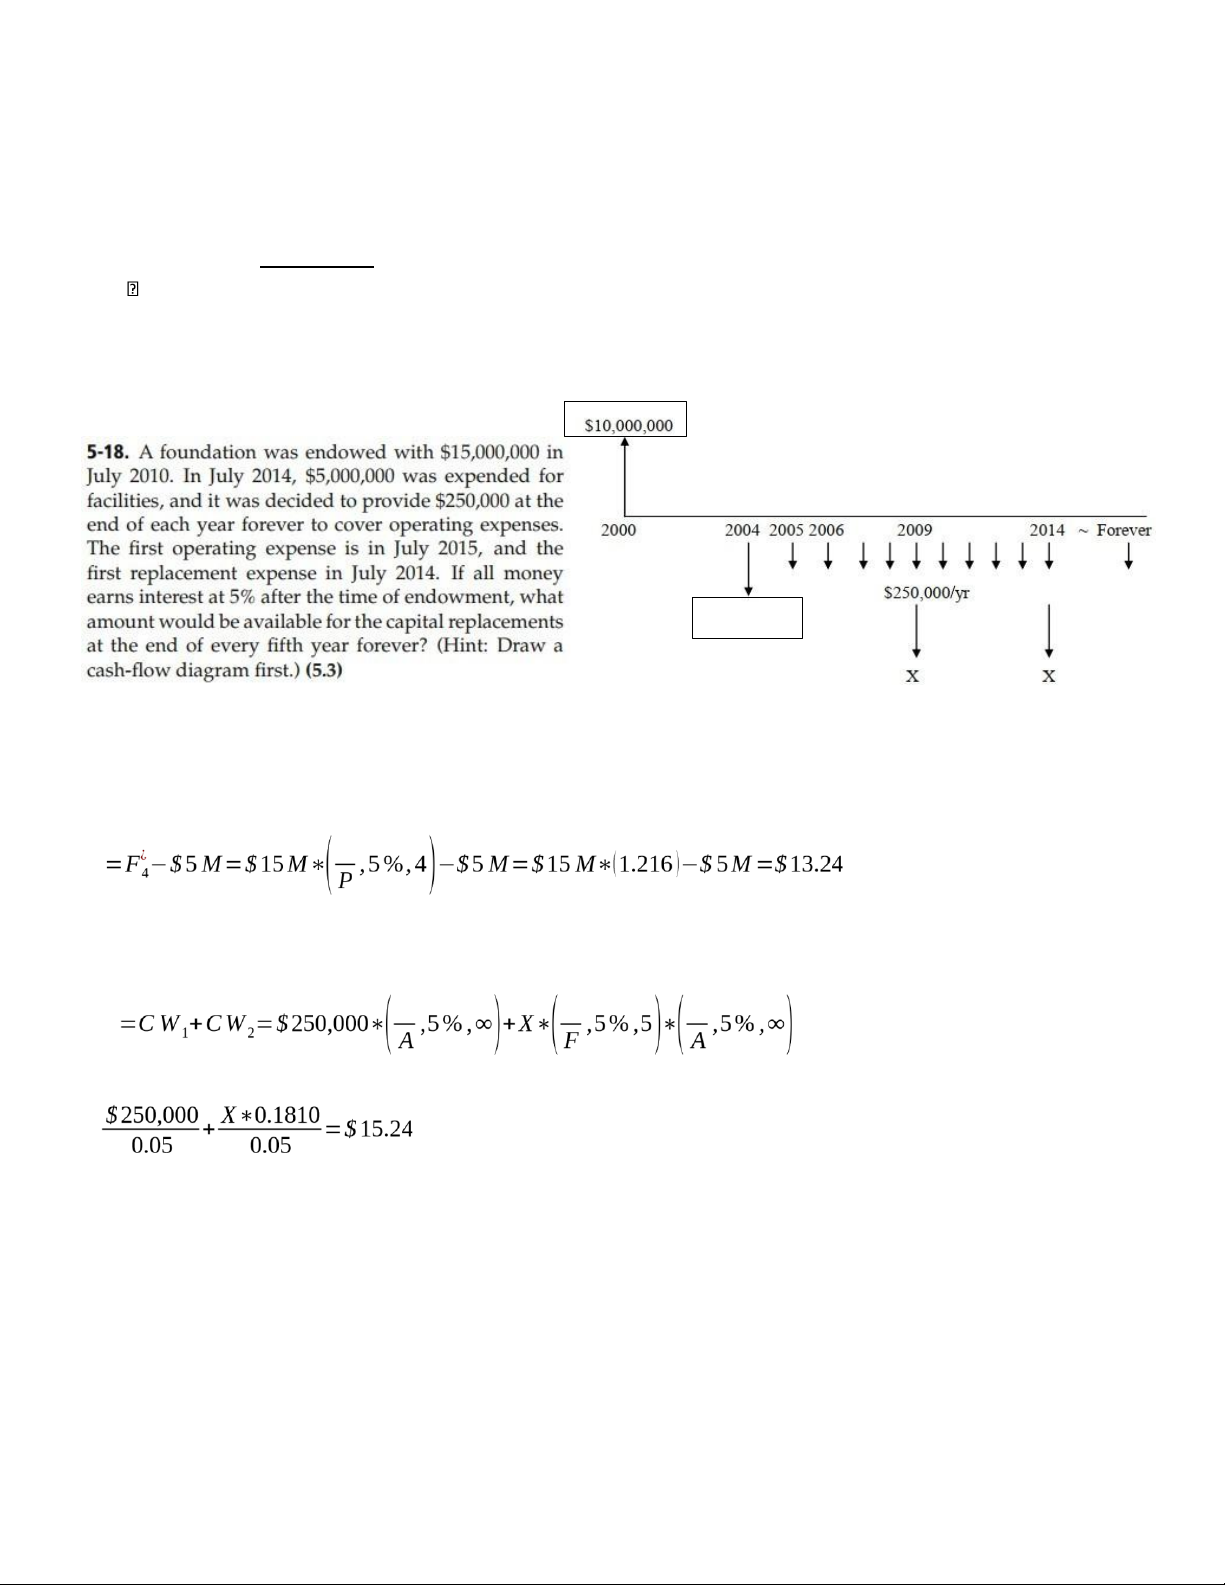
From Table C-13, N = 80 years $15,000,000 $5,000,000 Cashflow sai:
Total equivalent money in 2014: F P4M The capitalized worth: P A P CW →
M→ X=$ 2,828,729.282 lOMoAR cPSD| 58583460 Engineering Economy
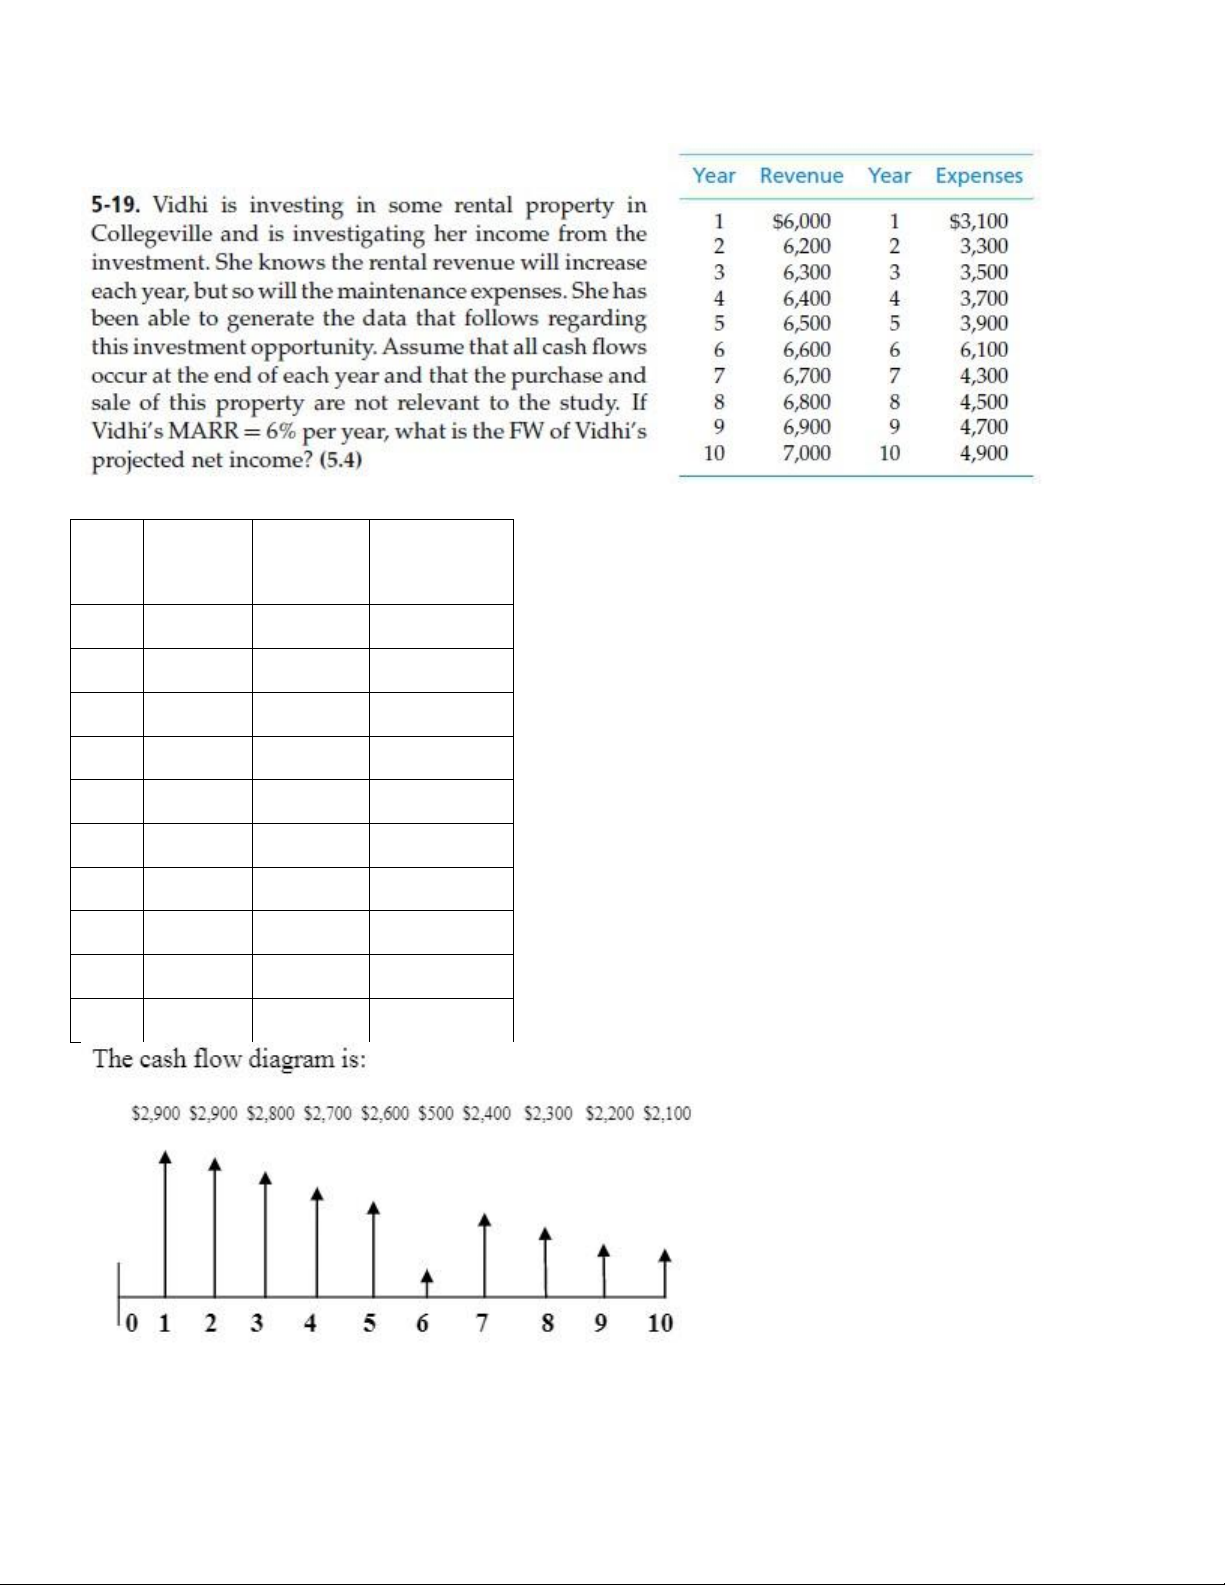
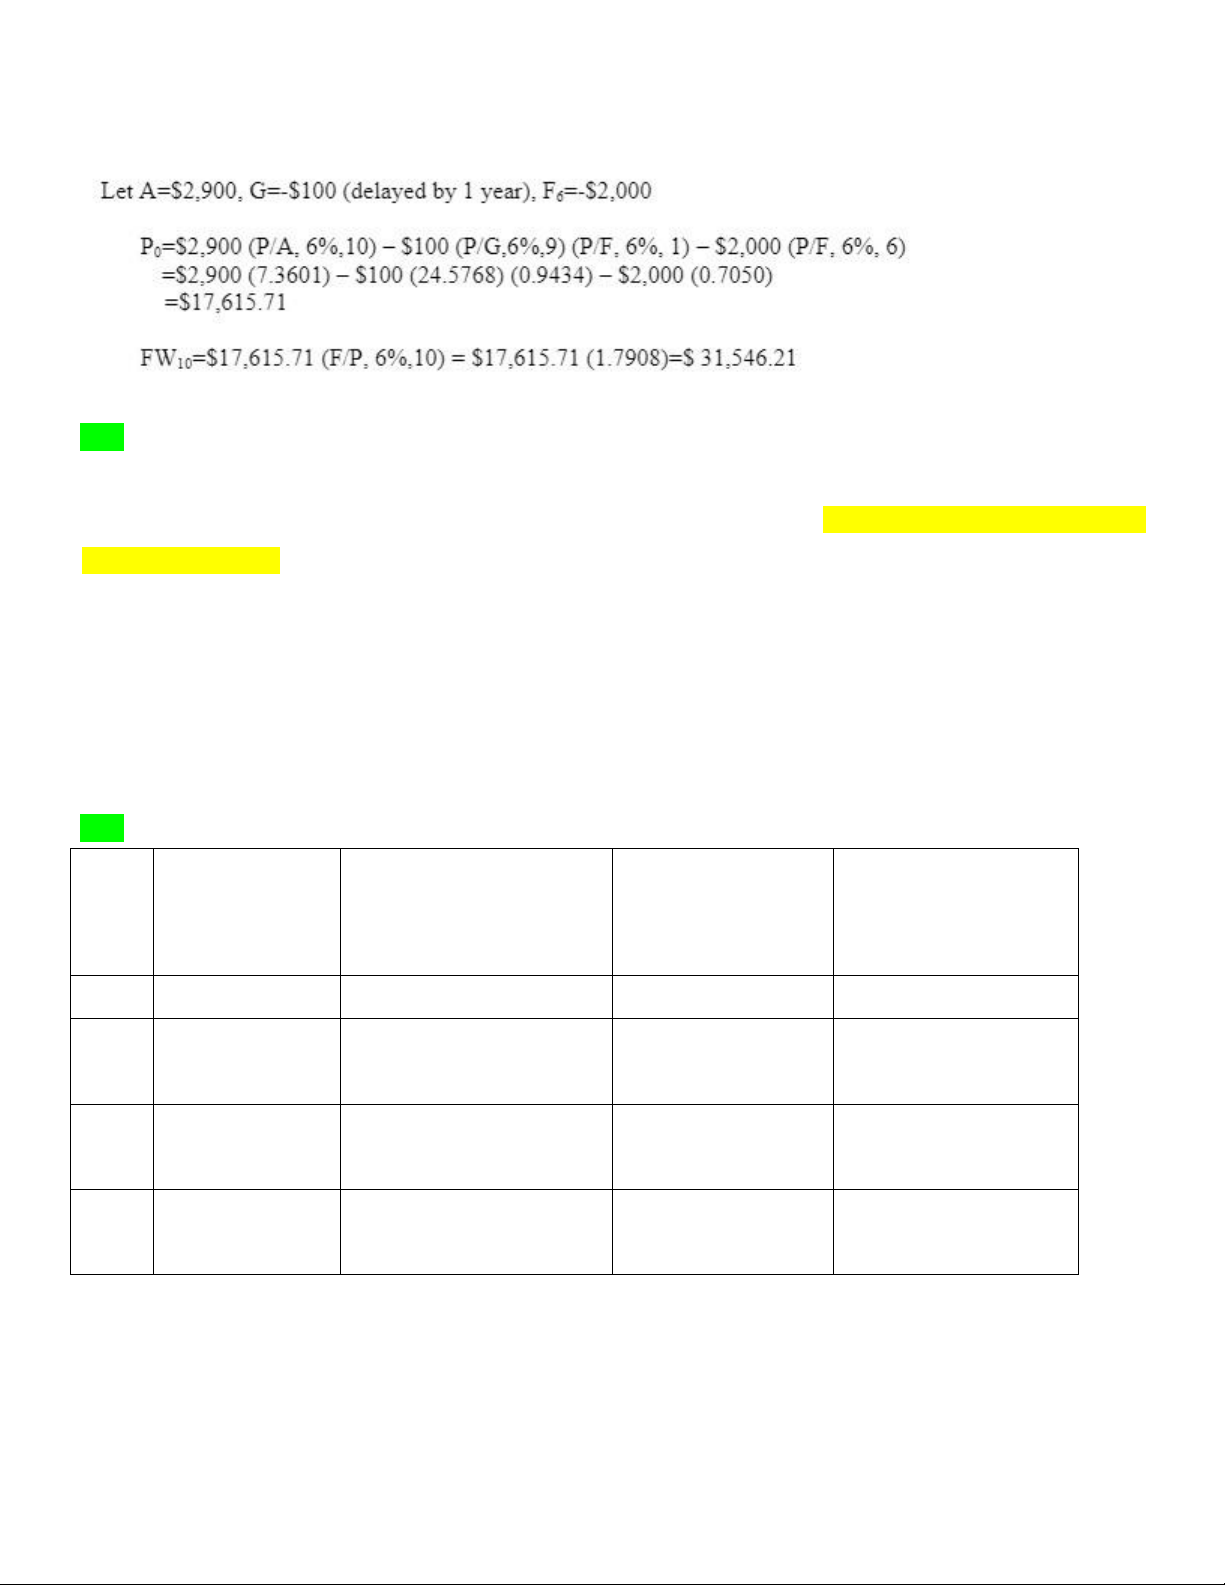
Year Revenue Expense Net Income s 1 6000 3100 2900 2 6200 3300 2900 3 6300 3500 2800 4 6400 3700 2700 5 6500 3900 2600 6 6600 6100 500 7 6700 4300 2400 8 6800 4500 2300 9 6900 4700 2200 10 7000 4900 2100 lOMoAR cPSD| 58583460 Engineering Economy 5-22
What are the PW and FW of a 20-year geometric cash-flow progression increasing at 2% per year if the
first year amount is $1,020 and the interest rate is 10% per year? (5.4) – Nên dùng gradient tính PW khi
biết A và G, => FW
PW = [A – A(P/F,10%,20)(F/P,2%,20)] / (10%-2%) = [1020 – 1020(0.1486)(1.459)]/(0.08)
= (1020 – 225.220)/0.08 = $9934.75
FW = PW(F/P, 10%, 20) = 9934.75*6.728 = $66840.998 5-23 Year Investment of Opportunity Cost of Loss in Value of Capital Recovery Beginning of Interest (i=15%) Asset During Year Amount for Year Year 1 10,000 10,000 (0.15) = 1,500 3,000 1,500 + 3,000 = 4,500 2
10,000 – 3,000 = 7,000 (0.15) = 1,050 2,000 1,050 + 2,000 = 3,050 7,000 3
7,000 – 2,000 = 5,000 (0.15) = 750 2,000 750 + 2,000 = 2,750 5,000 4
5,000 – 2,000 = 3,000 (0.15) = 450 1,000 * 450 + 1,000 = 1,450 3,000
P0 = $4,500 (P/F,15%,1) + $3,050 (P/F,15%,2) + $2,750 (P/F,15%,3) +$1,450 (P/F, 15%, 4)
= $4,500 (0.8696) + $3,050 (0.7561) + $2,750 (0.6575) + $1,450 (0.5718) = $ 8,856.54 A
= $8,856.54 (A/P,15%,4) = $8,856.49 (0.3503) = $3,102.45 lOMoAR cPSD| 58583460 Engineering Economy
Following equation (5-5) to check:
CR(i%) = I (A/P, i%, N) − S (A/F, i%, N) = $10,000 (A/P,15%,4) − $2,000 (A/F,15%,4) = $10,000 (0.3503) − $2,000 (0.2003) = $3,102.12 5-34
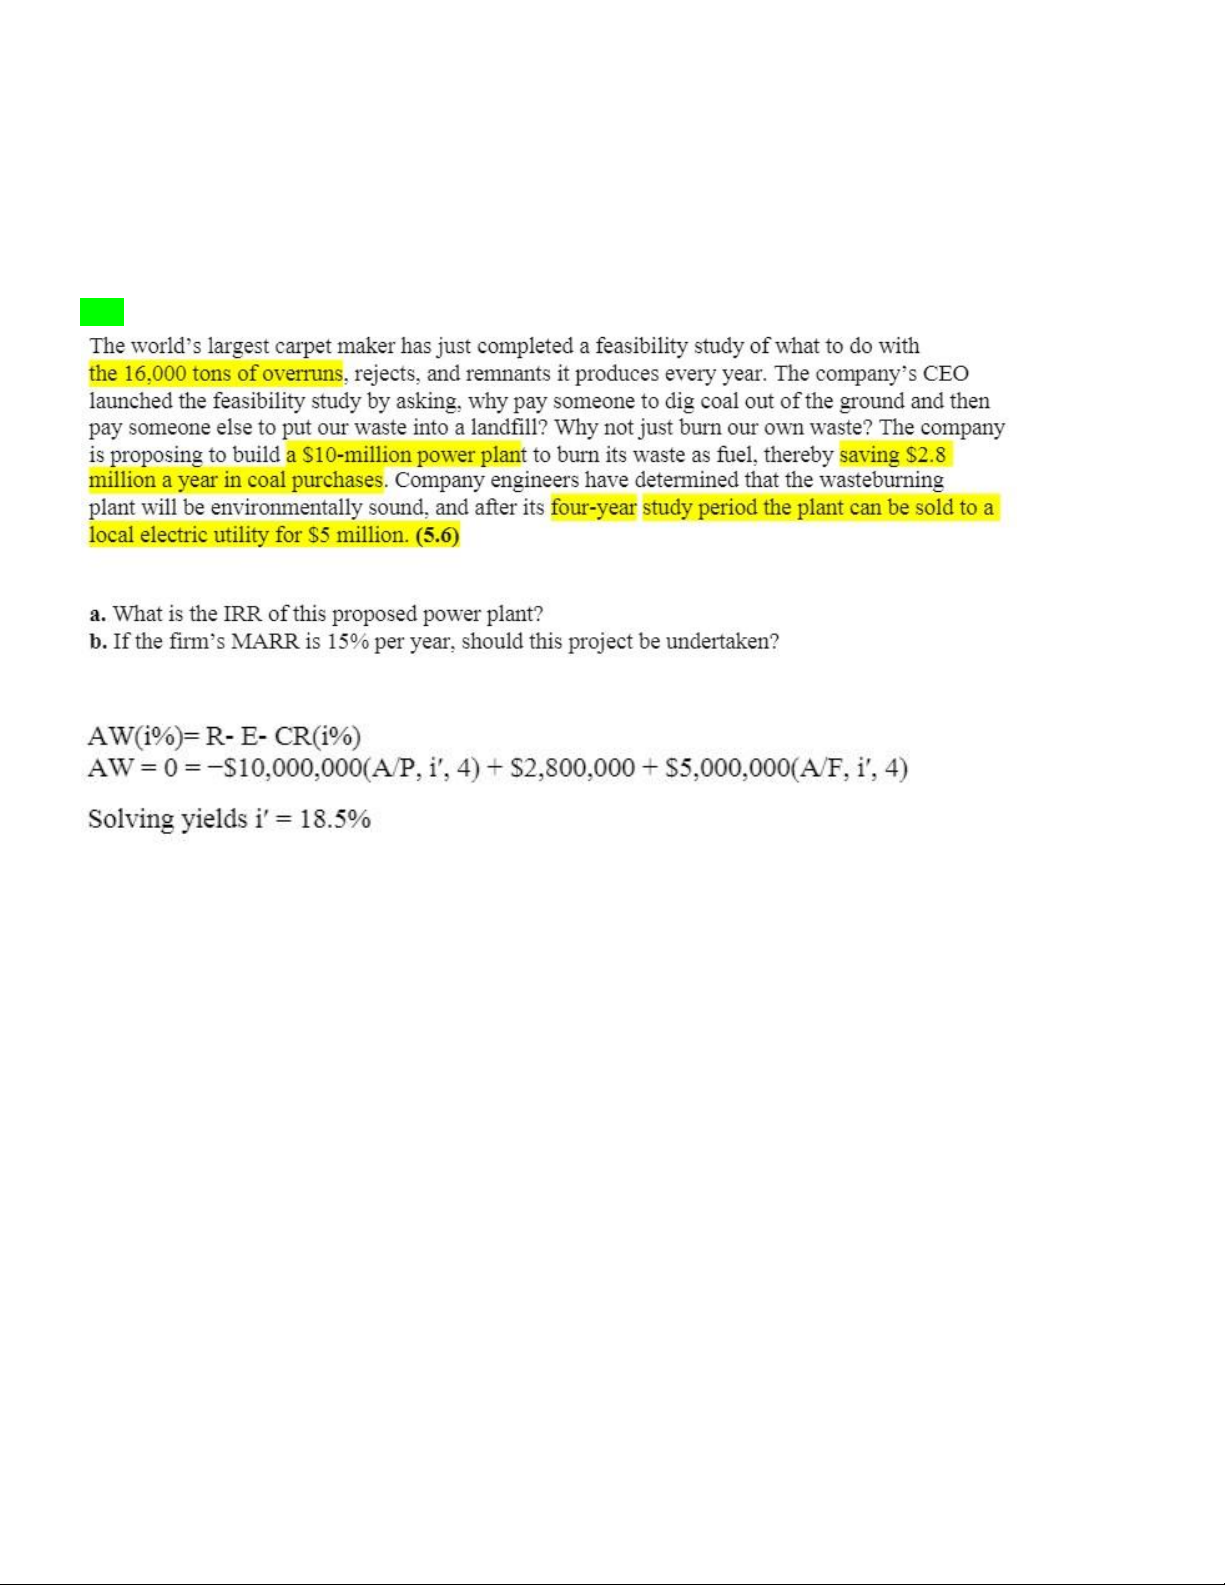
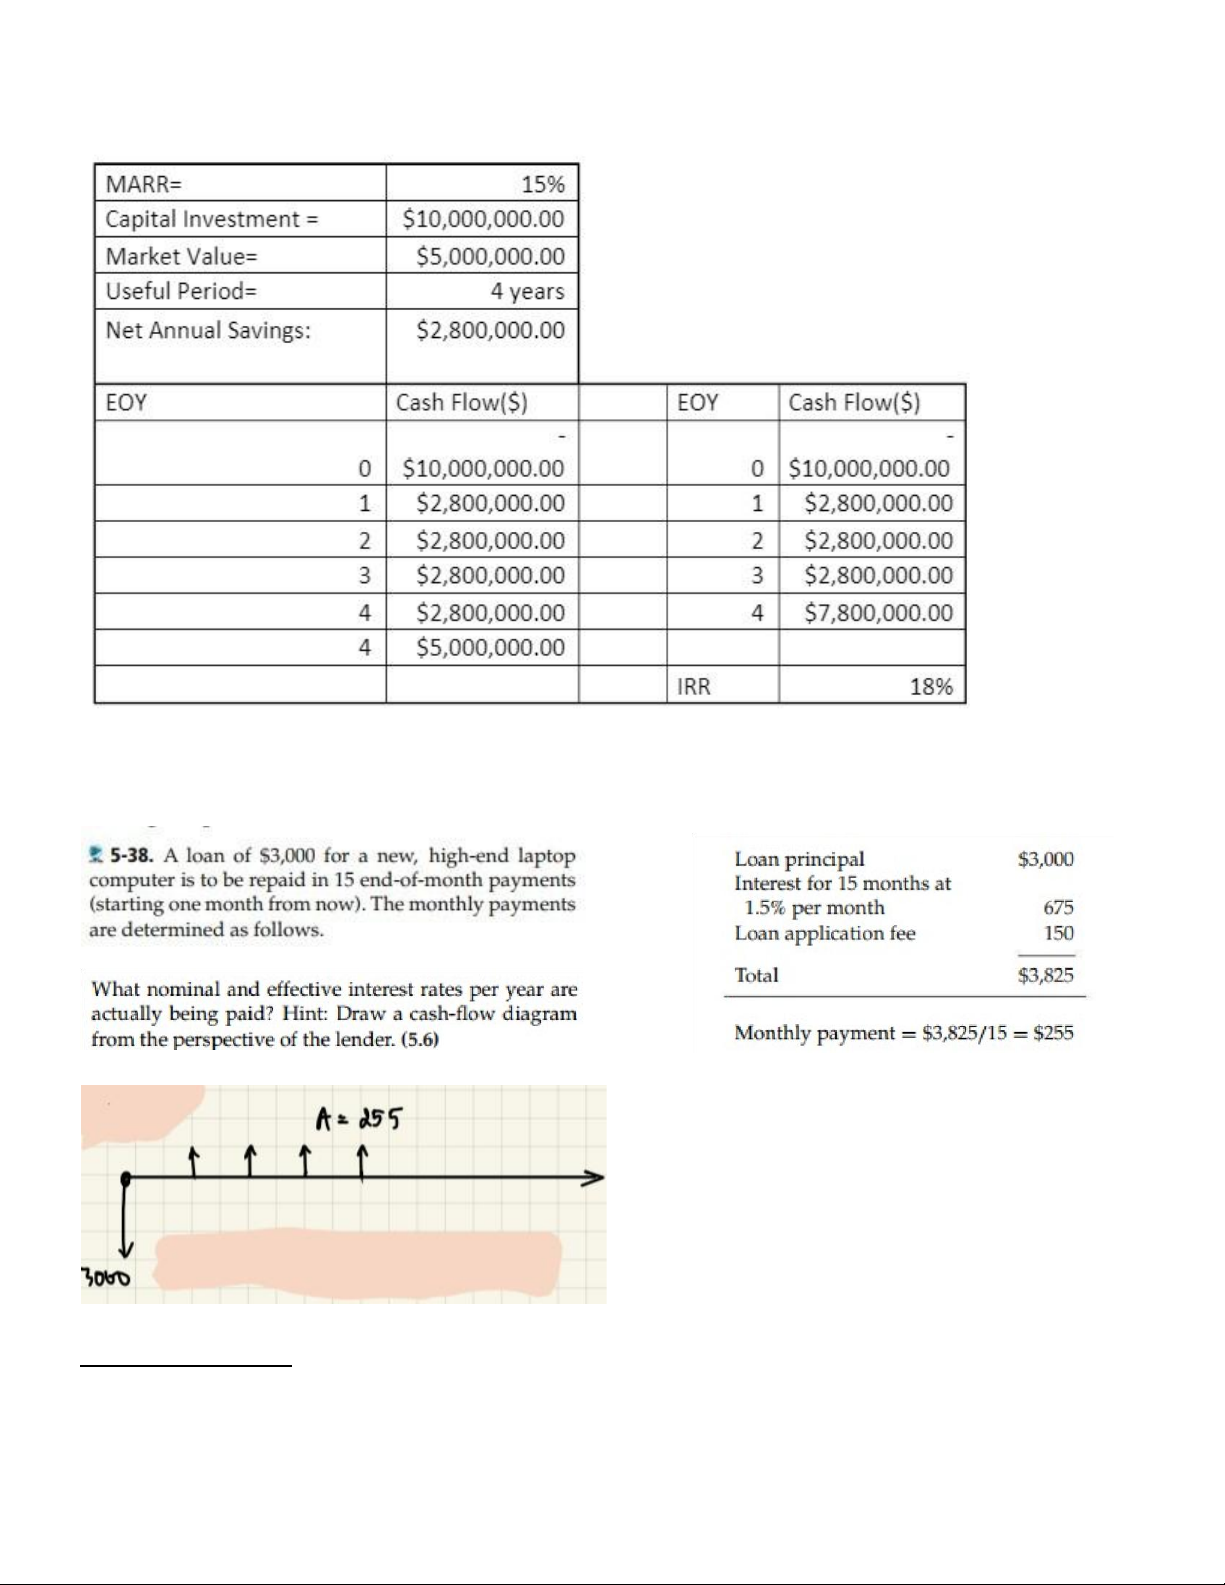
a/ Option 1: through annual worth method + linear interpolation
Option 2: Through Excel Method lOMoAR cPSD| 58583460 Engineering Economy
b) Yes, IRR (18%) > MARR (15%). The plant project is acceptable 5-38 Method 1: Calculator: 15 lOMoAR cPSD| 58583460 Engineering Economy ∗(
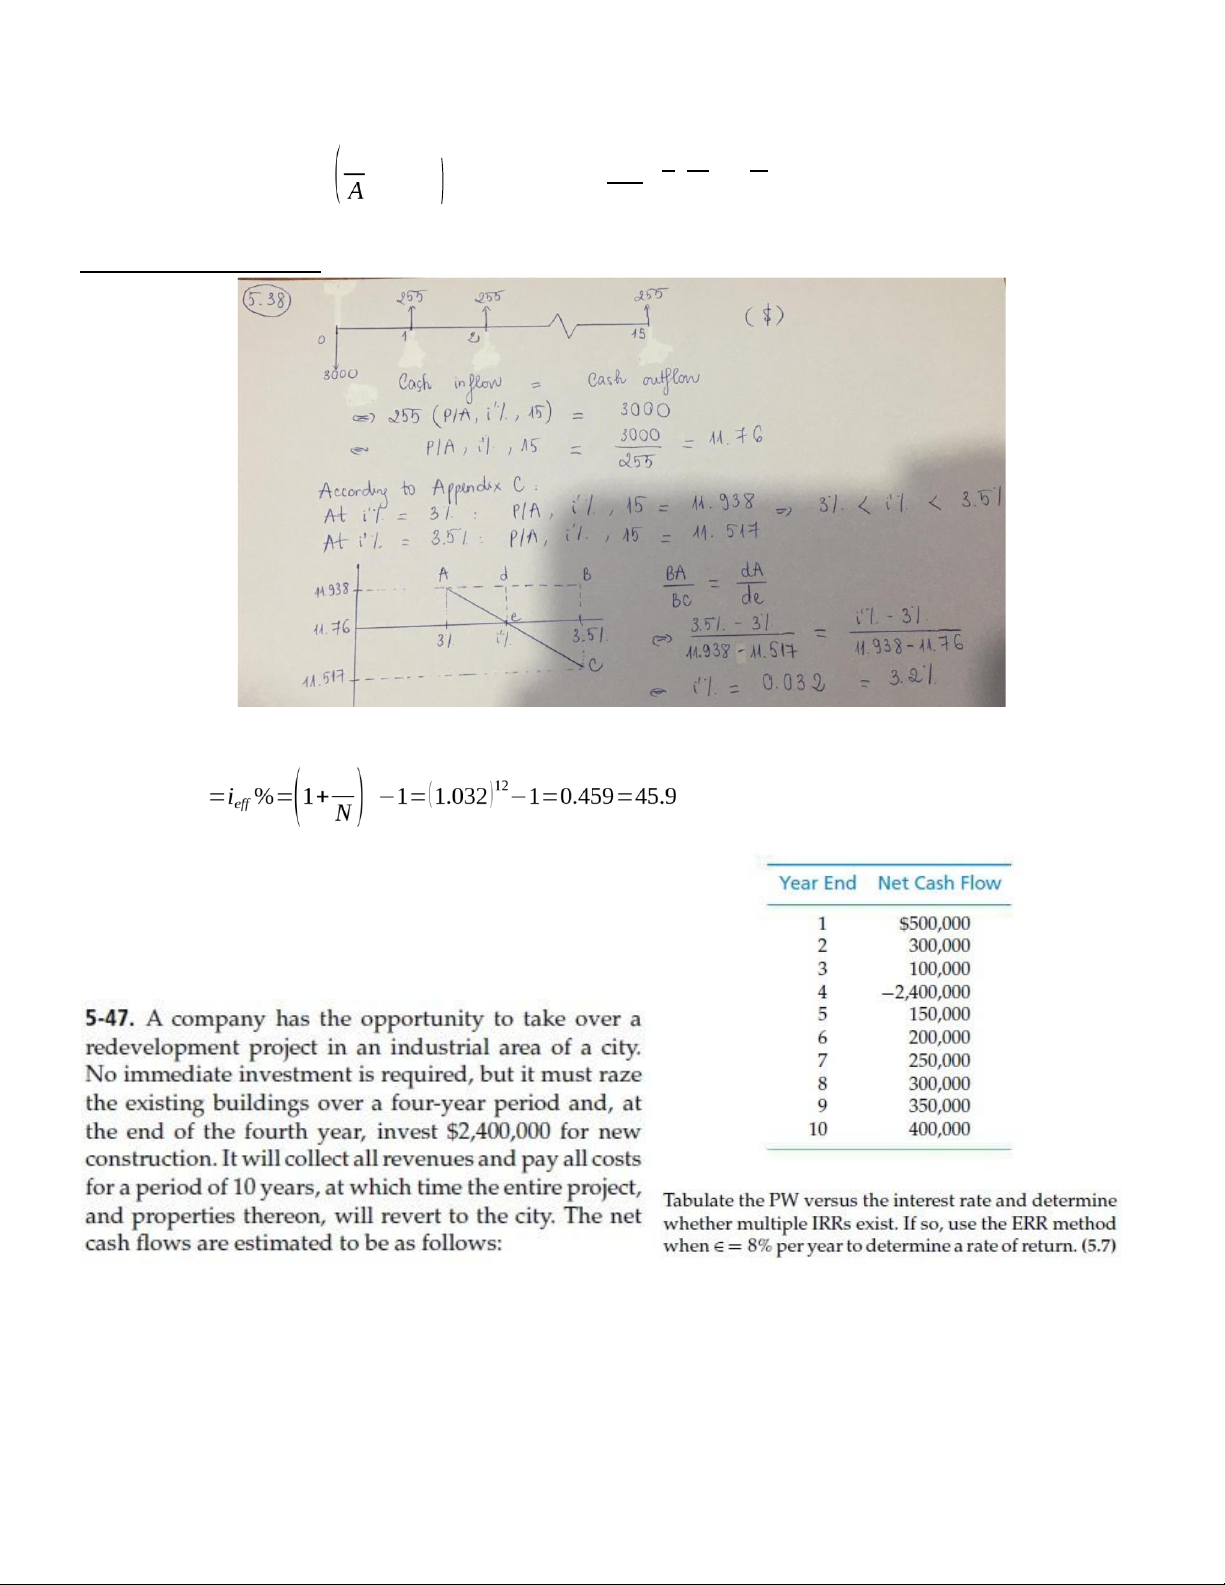
We have: $3,000=$255∗
P ,i%, N=$ 255 1+i%) −1 15 →i=3.2% i%∗(1+i%) Method 2: Interpolation:
Nominalannualrate=r%=12∗i%=38.4 % r N Effecttiverate % per year
Option 1: Present Worth (PW) method + Linear Interpolation: lOMoAR cPSD| 58583460 Engineering Economy
Option 2: Through Excel Spreadsheet
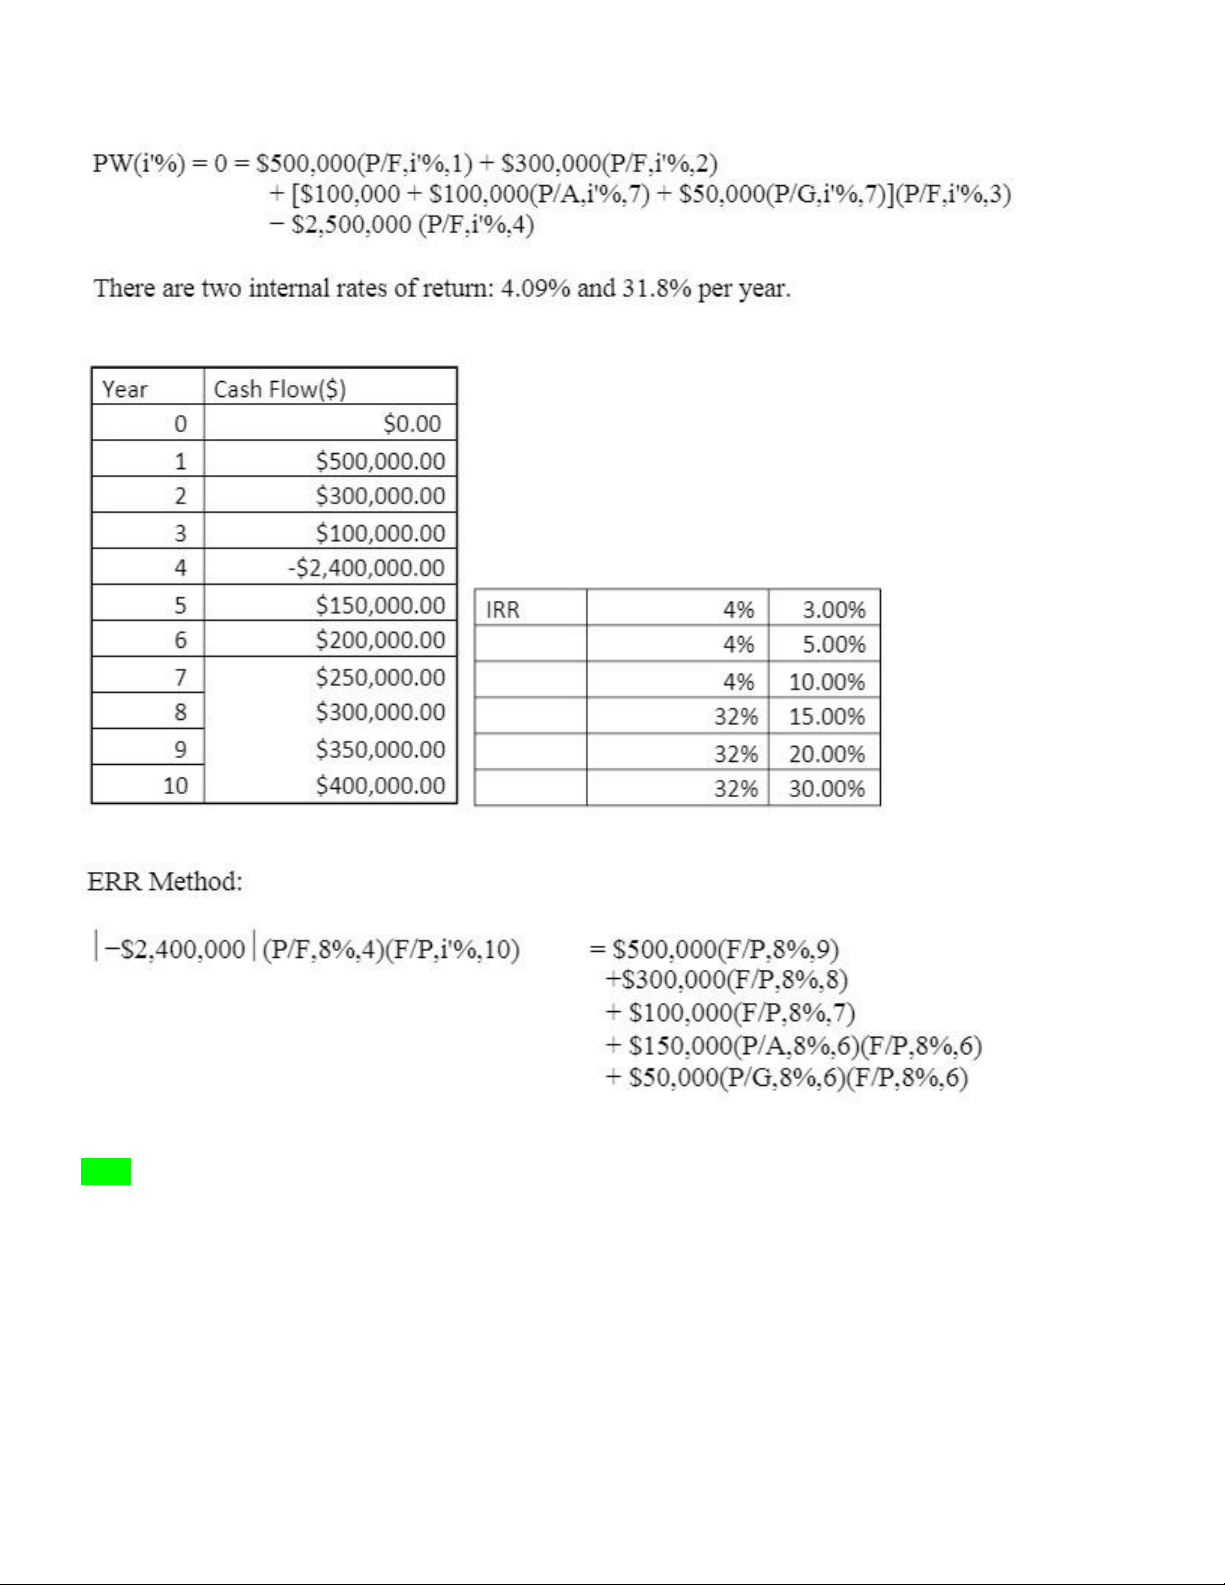
The Two IRR are 4% and 32% and this occur due to changes of sign in the net cash flow
=> the external rate of return i’ is 7.6% per year. 5-51. lOMoAR cPSD| 58583460 Engineering Economy Solution:
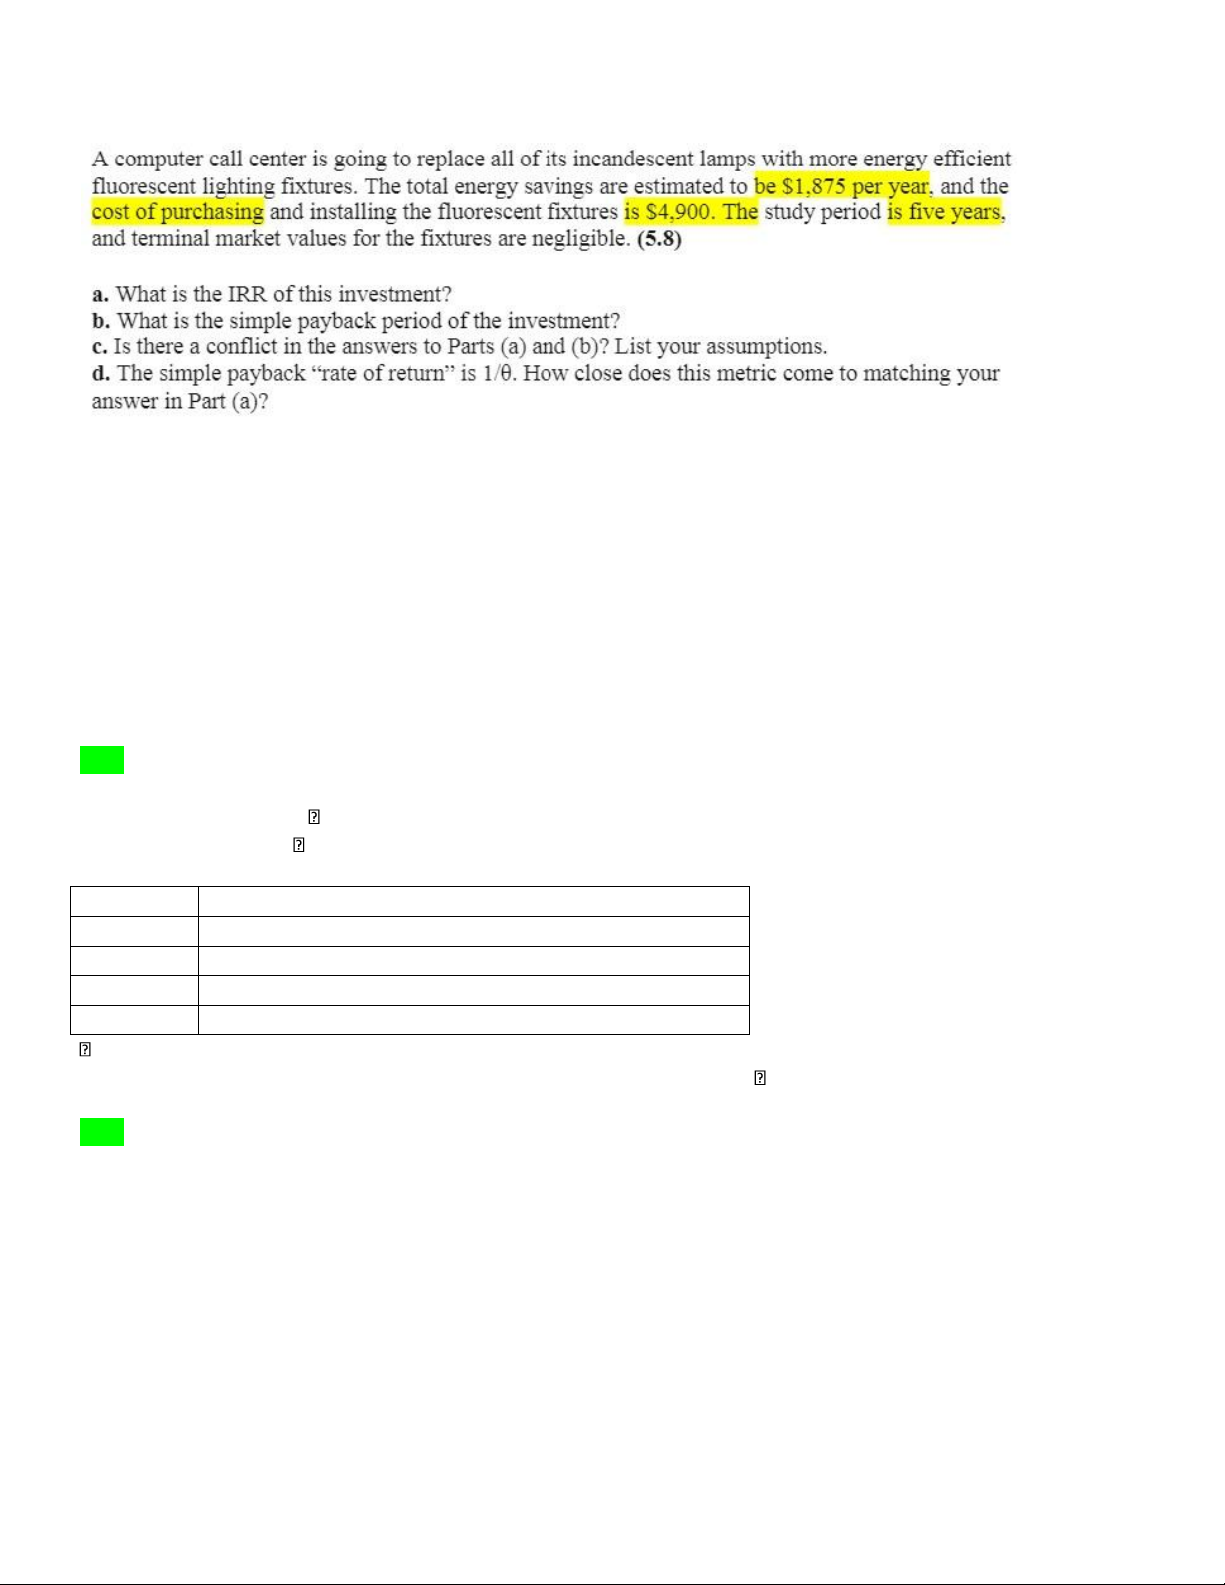
a) 0 = −$4,900 + $1,875(P/A, i′, 5) => i′ = 26.4%
b) θ = $4,900 / $1,875 = 3 years (to the integer year)
c) The IRR will signal an acceptable (profitable) project if the MARR is less than 26.4% and the value
of θ may indicate a poor project in terms of liquidity.
d) 1/ θ = 33.3%. This is the payback rate of return, and it over-estimates the actual IRR 5-53
PW(i'%) = 0 = −$100,000 + $20,000 (P/A,i'%,5) + $10,000 (P/G,i'%,5) + $10,000 (P/F,i'%,5)
PW(20%) = $12,891 > 0, i'% > 20%
PW(25%) = −$897 < 0, i'% < 25%
By linear interpolation, i'% = IRR = 24.7% EOY Cumulative Cash Flow 1 -100,000 + 20,000 = -80,000 2 -80,000 + 30,000 = -50,000 3 -50,000 + 40,000 = -10,000 4
-10,000 + 50,000 = 40,000 > 0 = 4 years
Although this project is profitable (IRR > MARR), it is not acceptable since = 4 years is greater than the maximum
allowable simple payback period of 3 years. 5-60 a.
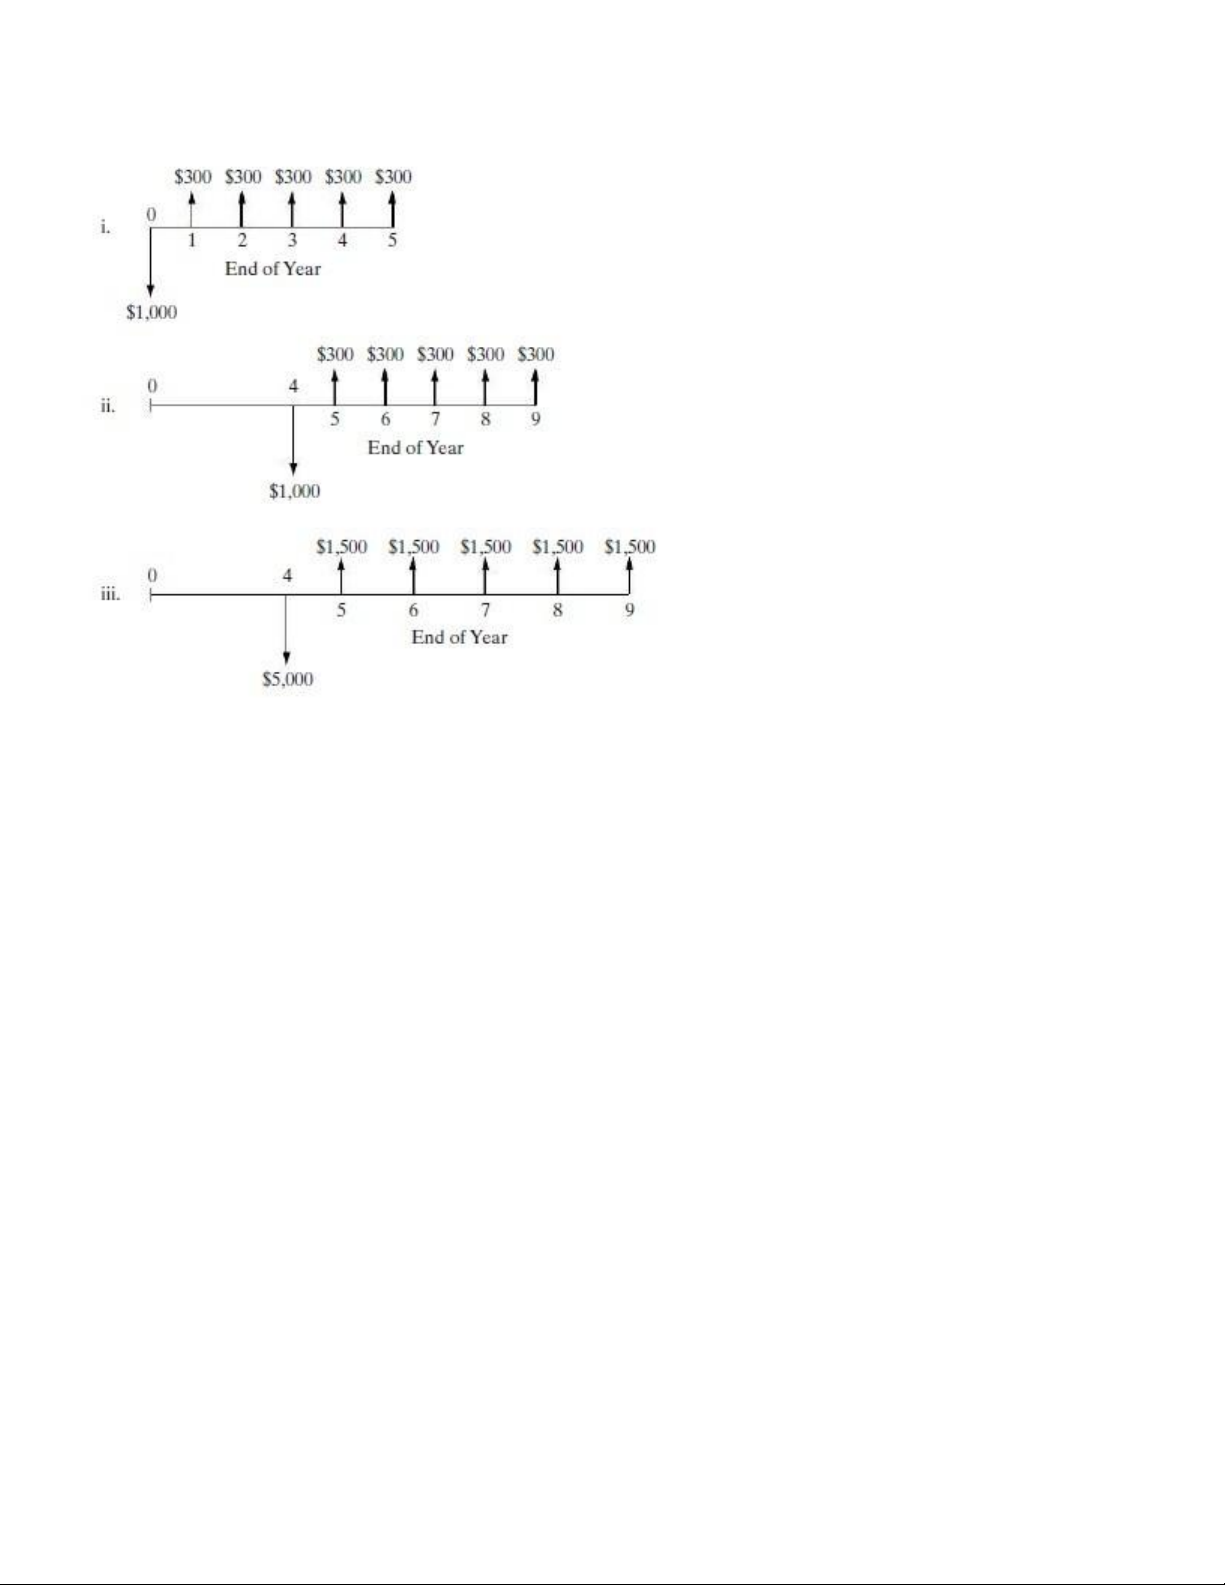
Calculate the IRR for each of the three cash-flow diagrams that follow. Use EOY zero for (i) and EOY
four for (ii) and (iii) as the reference points in time. What can you conclude about “reference year shift” and “proportionality”
issues of the IRR method? lOMoAR cPSD| 58583460 Engineering Economy b.
Calculate the PW at MARR = 10% per year at EOY zero for (i) and (ii) and EOY four for (ii) and (iii).
How do the IRR and PW methods compare?
a) Cash flow diagram (i)
PW = 0 = -1000 + 300(P/A, I’%, 5) I’ = 15% => PW = $5.66
I’ = 16% => PW = $ - 17.8
We have 15% < I’ < 16% so we get (16% - 15%)/ [5.66 – (-17.8)] = (I’% - 15%)/ 5.66 => I’% = 15.3% Cash flow diagram (ii)
PW = 0 = -1000 + 300(P/A, I’’%, 5)
I’’ = 15% => PW = $5.66
I’’ = 16% => PW = $ - 17.8
We have 15% < I’’ < 16% so we get (16% - 15%)/ [5.66 – (-17.8)] = (I’’% - 15%)/ 5.66 => I’’% = 15.3%
Cash flow diagram (iii)
PW = 0 = -5000 + 1500(P/A, I’’’%, 5)
I’’’ = 15% => PW = $28.23
I’’’ = 16% => PW = $ - 88.56
We have 15% < I’’’ < 16% so we get (16% - 15%)/ [28.23 – (-88.56)] = (I’’’% - 15%)/ 528.23 => I’’’% = 15.3% lOMoAR cPSD| 58583460 Engineering Economy
Hence, IRR = I’% = I’’% = I’’’% = 15.3% b) MARR = 10%
(i) PW0 (10%) = -1000 + 300(P/A,10%,5) = -1000 + (300*3.791) = $137.3
(ii) PW0 (10%) = -1000(P/F,10%,4) + 300(P/A,10%,5)(P/F,10%,4)
= -1000(0.6830) + (300*3.791*0.6830) = $93.78
(ii) PW4 (10%) = -1000 + 300(P/A, 10%, 5) = -1000 + (300*3.791) = $137.3
(iii) PW4 (10%) = -5000 + 1500(P/A, 10%, 5) = -5000 + (1500*3.791) = $686.5
So we select (iii) at EOY = 4 to maximize PW(10%)
PW (15.3%) = 0 for all three cases
Tài liệu liên quan:
-
Assignment Môn Engineering Economy | Trường Đại học Quốc tế, Đại học Quốc gia Thành phố Hồ Chí Minh
89 45 -
Group work instruction Môn Engineering Economy | Trường Đại học Quốc tế, Đại học Quốc gia Thành phố Hồ Chí Minh
115 58 -
Solutions: Problem Analysis & Recommendations | Môn Engineering Economy - Trường Đại học Quốc tế, Đại học Quốc gia Thành phố Hồ Chí Minh
94 47 -
Summary Môn Engineering Economy | Trường Đại học Quốc tế, Đại học Quốc gia Thành phố Hồ Chí Minh
124 62 -
Midterm examination Sample test and solution | Môn Engineering Economy - Trường Đại học Quốc tế, Đại học Quốc gia Thành phố Hồ Chí Minh
109 55