Tài liệu ghi chép chương 1- chương 8 | Môn kinh tế học
What causes inflation? When a government creates large quantities of the nation's money, the value of the money falls. In Germany in the early 1920s, when prices were on average tripling every month, the quantity of money was also tripling every month. Although less dramatic, the economic history of the United States points to a similar conclusion. Tài liệu giúp bạn tham khảo, ôn tập và đạt kết quả cao. Mời bạn đọc đón xem !
Môn: kinh tế học ( UEH ) 16 tài liệu
Trường: Đại học Kinh tế Thành phố Hồ Chí Minh 3.1 K tài liệu
Tác giả:


Preview text:
lOMoAR cPSD| 47305584
Vở ghi chép môn Kinh tế học chương 1 đến chương 8 Nguyễn Văn Long- Lớp quản trị kinh doanh LKQT 20012102 PART I. MICROECONOMICS
1 Microeconomics and basic economic problems of enterprises
1.1 What is Economics? The ten basic tenets of economics. The division of economics
a) What is Economics?
Economics is the study of how humans make decisions in the face of scarcity. These can be
individual decisions, family decisions, business decisions or societal decisions.
Scarcity means that human wants for goods, services and resources exceed what is available.
Resources, such as labor, tools, land, and raw materials are necessary to produce the goods and
services we want but they exist in limited supply. Of course, the ultimate scarce resource is
timeeveryone, rich or poor, has just 24 expendable hours in the day to earn income to acquire
goods and services, for leisure time, or for sleep. At any point in time, there is only a finite
amount of resources available. Think about it this way: In 2015 the labor force in the United
States contained over 158 million workers, according to the U.S. Bureau of Labor Statistics. The
total land area was 3,794,101 square miles. While these are certainly large numbers, they are
not infinite. Because these resources are limited, so are the numbers of goods and services we
produce with them. Combine this with the fact that human wants seem to be virtually infinite,
and you can see why scarcity is a problem.
b) The ten basic tenets of economics.
Principle #1: People face tradeoffs
The first lesson about making decisions is summarized in the adage "There is no such thing as a
free lunch." To get one thing that we like, we usually have to give up another thing that we like.
Making decisions requires trading off one goal against another.
Principle #2: The cost of something is what you give up to get it
Because people face tradeoffs, making decisions requires comparing the costs and benefits of
alternative courses of action. In many cases, however, the cost of some action is not obvious.
Principle #3: 'Rational people think at the margin
Decisions in life are rarely black and white but usually involve shades of gray. When it's time for
dinner, the decision you face is not between fasting or eating like a pig, but whether to take that
extra spoonful of mashed potatoes. When exams roll around, your decision is not between
blowing them off or studying 24 hours a day, but whether to spend an extra hour reviewing your notes instead of watching TV.
Economists use the term marginal changes to describe small incremental adjustments to an
existing plan of action. Keep in mind that "margin” means "edge," so marginal changes are
adjustments around the edges of what you are doing. lOMoAR cPSD| 47305584
In many situations, people make the best decisions by thinking at the margin. Suppose, for
instance, that you asked a friend for advice about how many years to stay in school. If he were to
compare for you the lifestyle of a person with a Ph.D. to that of a grade school dropout, you
might complain that this comparison is not helpful for your decision. You have some education
already and most likely are deciding whether to spend an extra year or two in school. To make
this decision, you need to know the additional benefits that an extra year in school would offer
(higher wages throughout life and the sheer joy of learning) and the additional costs that you
would incur tuition and the forgone wages while you're in school). By comparing these marginal
benefits and marginal costs, you can evaluate whether the extra year is worthwhile.
Principle #4: People respond to incentives
Because people make decisions by comparing costs and benefits, their their behavior may
change when the costs or benefits change. That is, people respond to incentives. When the price
of an apple rises, for instance, people decide to eat more pears and fewer apples, because the
cost of buying an apple is higher. At the same time, apple orchards decide to hire more workers
and harvest more apples, because the benefit of selling an apple is also higher. As we will see,
the effect of price on the behavior of buyers and sellers in a market in this case, the market for
apples-is crucial for understanding how the economy works.
Principle #5: Trade can make everyone better off
Mankiw's fifth principle is: Trade Can Make Everyone Better Off. He says that that my family
competes with other families for jobs, and when we shop, we compete with others to find the
best prices. But if we cut ourselves off from the market, we would have to grow our own food,
make our own clothes, and build our own houses. “Trade allows each person to specialize at
what he or she does best, whether it's farming, sewing, or home building." In the same way,
nations can specialize in what they do best. In both cases, people get a wider range of choices at lower prices.
Japanese are supposed to be one of America's competitors in the world economy for American
and Japanese firms do produce many of the same goods. Ford and Toyota compete for the same
customers in the market for automobiles. Compaq and Toshiba compete for the same customers
in the market for personal computers.
Yet it is easy to be misled when thinking about competition among countries. Trade between the
United States and Japan is not like a sports contest, where one side wins and the other side
loses. In fact, the opposite is true: Trade between two countries can make each country better
off because both the countries must improve their products' qualities, which make the products become better
Principle #6: Markets are usually a good way to organize
The invisible hand usually leads markets to allocate resources efficiently. Nonetheless, for
various reasons, the invisible hand sometimes does not work. Economists use the term market
failure to refer to a situation in which the market on its own fails to allocate resources efficiently.
One possible cause of market failure is an externality. An externality is economic activity lOMoAR cPSD| 47305584
The collapse of communism in the Soviet Union and Eastern Europe may be the most important
change in the world during the past half century. Communist countries worked on the premise
that central planners in the government were in the best position to guide economic activity.
These planners decided what goods and services were produced, how much was produced, and
who produced and consumed these goods and services. The theory behind central planning was
that only the government could organize economic activity in a way that promoted economic
well-being for the country as a whole.
Today, most countries that once had centrally planned economies have abandoned this system
and are trying to develop market economies. In a market economy, the decisions of a central
planner are replaced by the decisions of millions of firms and households. Firms decide whom to
hire and what to make. Households decide which firms to work for and what to buy with their
incomes. These firms and households interact in the marketplace, where prices and self-interest guide their decisions.
Principle #7: Governments can sometimes improve market outcomes
Although markets are usually a good way to organize economic activity, this rule has some
important exceptions. There are two broad reasons for a government to intervene in the
economy: to promote efficiency and to promote equity. That is, most policies aim either to
enlarge the economic pie or to change how the pie is divided. the impact of one person's actions
on the well-being of a bystander. The classic example of an external cost is pollution. If a
chemical factory does not bear the entire cost of the smoke it emits, it will likely emit too much.
Here, the government can raise economic wellbeing through environmental regulation. The
classic example of an external benefit is the creation of knowledge. When a scientist makes an
important discovery, he produces a valuable resource that other people can use. In this case, the
government can raise economic well-being by subsidizing basic research, as in fact it does.
Principle #8: A country's standard of living depends on its ability to produce goods and services
In 1997 the average American had an income of about $29,000. In the same year, the average
Mexican earned $8,000, and the average Nigerian earned $900. Not surprisingly, this large
variation in average income is reflected in various measures of the quality of life. Citizens of
high-income countries have more TV sets, more cars, better nutrition and better health care
than citizens of low-income countries.
What explains these large differences in living standards among countries and over time? The
answer is surprisingly simple. Almost all variation in living standards is attributable to differences
in countries' productivity--that is, the number of goods and services produced from each hour of
a worker's time. In nations where workers can produce a large quantity of goods and services
per unit of time, most people enjoy a high standard of living; in nations where workers are less
productive, most people must endure a more meager existence. Similarly, the growth rate of a
nation's productivity determines the growth rate of its average income.
Principle #9: Prices rise when the government prints too
Weimar Republic in Germany in the early 1920s. In Germany in January 1921, a daily newspaper
cost 0.30 marks. Less than two years later, in November 1922, the same newspaper cost lOMoAR cPSD| 47305584
70,000,000 marks. All other prices in the economy rose by similar amounts. This episode is one
of historx's most spectacular examples of inflation, an increase in the overall level of prices in the economy.
What causes inflation? When a government creates large quantities of the nation's money, the
value of the money falls. In Germany in the early 1920s, when prices were on average tripling
every month, the quantity of money was also tripling every month. Although less dramatic, the
economic history of the United States points to a similar conclusion: The high inflation of the
1920s was associated with rapid growth in the quantity of money, and the low inflation of the
1990s, was associated with slow growth in the quantity of money.
Principle #10: Society faces a short-run tradeoff between inflation and unemployment
If inflation is so easy to explain, why do policymakers sometimes have trouble ridding the
economy of it? One reason is that reducing inflation is often thought to cause a temporary rise
in unemployment. The curve that illustrates this tradeoff between inflation and unemployment
is called the Phillips curve, after the economist who first examined this relationship.
c) The division of economics
In economics, the micro decisions of individual businesses are influenced by whether the macro
economy is healthy. For example, firms will be more likely to hire workers if the overall economy
is growing. In turn, macro economy's performance ultimately depends on the microeconomic
decisions that individual households and businesses make Questions in microeconomics
What determines households and individuals spend their budgets? What combination of goods
and services will best fit their needs and wants, given the budget they have to spend? How do
people decide whether to work, and if so, whether to work full time or part time? How do
people decide how much to save for the future, or whether they should borrow to spend beyond their current means?
What determines the products, and how many of each, a firm will produce and sell? What
determines the prices a firm will charge? What determines how a firm will produce its products?
What determines how many workers it will hire? How will a firm finance its business? When will
a firm decide to expand, downsize, or even close?
In the microeconomics part of this book, we will learn about the theory of consumer
behavior, the theory of the firm, how markets for labor and other resources work, and how
markets sometimes fail to work properly. Questions in Macroeconomics
What determines the level of economic activity in a society? In other words, what determines
how many goods and services a nation actually produces? What determines how many jobs are
available in an economy? What determines a nation's standard of living? What causes the
economy to speed up or slow down? What causes firms to hire more workers or to lay them off?
Finally, what causes the economy to grow over the long term?
We can determine an economy's macroeconomic health by examining a number of goals:
growth in the standard of living, low unemployment, and low inflation, to name the most
important. How can we use government macroeconomic policy to pursue these goals? A
nation's central bank conducts monetary policy, which involves policies that affect bank lending, lOMoAR cPSD| 47305584
interest rates, and financial capital markets. For the United States, this is the Federal Reserve. A
nation's legislative body determines fiscal policy, which involves government spending and taxes.
For the United States, this is the Congress and the executive branch, which originates the federal budget.
These are the government's main tools. Americans tend to expect that government can fix
whatever economic problems we encounter, but to what extent is that expectation realistic? 1.2
Economics and fundamental issues of business Some fundamental concepts are:
maximization, equilibrium, and efficiency a) Maximization
Economists usually assume that each economic actor maximizes something: consumers
maximize utility (i.e., happiness or satisfaction); firms maximize profits, politicians maximize
votes, bureaucracies (civil service, administration) maximize revenues, charities maximize social welfare, and so forth.
Economists often say that models assuming maximizing behavior work because most people are
rational, and rationality requires maximization. Different people want different things, such as
wealth, power, fame, love, happiness, and so on. The alternatives faced by an economic
decision-maker give her different amounts of what she wants. One conception of rationality
holds that a rational actor can rank alternatives according to the extent that they give her what
she wants. In practice, the alternatives available to the actor are constrained (forced and
unnatural). For example, a rational consumer can rank alternative bundles of consumer goods,
and the consumer's budget constrains her choice among them. A rational consumer should
choose the best alternative that the constraints allow. Another common way of understanding
this conception of rational behavior is to recognize that consumers choose alternatives that are
well-suited to achieving their ends.
Choosing the best alternative that the constraints allow can be described mathematically as
maximizing. To see why, consider that the real numbers can be ranked from small to large, just
as the rational consumer ranks alternatives according to the extent that they give her what she wants.
Consequently, better alternatives can be associated with larger numbers. Economists call this
association a "utility function," about which we shall say more in the following sections.
Furthermore, the constraint on choice can usually be expressed mathematically as a "feasibility
constraint." Choosing the best alternative that the constraints allow corresponds to maximizing
the utility function subject to the feasibility constraint. So, the consumer who goes shopping is
said to maximize utility subject to her budget constraint. b) Equilibrium
Turning to the second fundamental concept, there is no habit of thought so deeply ingrained
(firmly fixed or established) among economists as the urge to characterize each social
phenomenon as an equilibrium in the interaction of maximizing actors.
An equilibrium is a pattern of interaction that persists unless disturbed by outside forces.
Economists usually assume that interactions tend towards an equilibrium, regardless of whether
they occur in markets, elections, clubs, games, teams, corporations, or marriages. lOMoAR cPSD| 47305584
There is a vital connection between maximization and equilibrium in microeconomic theory. We
characterize the behavior of every individual or group as maximizing something. Maximizing
behavior tends to push these individuals and groups towards a point of rest, an equilibrium.
They certainly do not intend for an equilibrium to result; instead, they simply try to maximize
whatever it is that is of interest to them. Nonetheless, the interaction of maximizing agents
usually results in an equilibrium.
Nevertheless, equilibrium analysis makes sense. The simplest interaction to analyze is one that
does not change. Tracing out the entire path of change is far more difficult. c) Efficiency
Turning to the third fundamental concept, economists have several distinct definitions of
efficiency. A production process is said to be productively efficient if either of two conditions holds: i.
(1). It is not possible to produce the same amount of output using a lower-cost combination of inputs, or ii.
(2). It is not possible to produce more output using the same combination of inputs. iii.
Consider a firm that uses labor and machinery to produce a consumer good called a
"widget." Suppose that the firm currently produces 100 widgets per week using 10
workers and 15 machines. The firm is productively efficient if iv.
(1). It is not possible to produce 100 widgets per week by using 10 workers and fewer
than 15 machines, or by using 15 machines and fewer than 10 workers, or v.
(2). It is not possible to produce more than 100 widgets per week from the combination
of 10 workers and 15 machines. vi.
The other kind of efficiency, called Pareto efficiency referred to as allocative efficiency
concerns the satisfaction of individual preferences. A particular situation is said to be
Pareto or allocative efficient if it is impossible to change it so as to make at least one
person better off in his own estimation) without making another person worse off
(again, in his own estimation).
Productive Efficiency and Allocative Efficiency. The study of economics does not presume to tell a
society what choice it should make along its production possibilities frontier. In a market-
oriented economy with a democratic government, the choice will involve a mixture of decisions
by individuals, firms, and government. However, economics can point out that some choices are
unambiguously better than others. This observation is based on the concept of efficiency. In
everyday usage, efficiency refers to lack of waste. An inefficient machine operates at high cost,
while an efficient machine operates at lower cost, because it is not wasting energy or materials.
An inefficient organization operates with long delays and high costs, while an efficient
organization meets schedules, is focused, and performs within budget.
Productive efficiency means that, given the available inputs and technology, it is impossible to
produce more of one good without decreasing the quantity that is produced of another good.
Allocative efficiency means that the particular combination of goods and services on the
production possibility curve that a society produces represents the combination that society
most desires. How to determine what a society desires can be a controversial question, and is
usually a discussion in political science, sociology, and philosophy classes as well as in
economics. At its most basic, allocative efficiency means producers supply the quantity of each lOMoAR cPSD| 47305584
product that consumers demand. Only one of the productively efficient choices will be the
allocative efficient choice for society as a whole.
2 Supply-demand and commodity prices 2.1 Demand of goods a) Demand
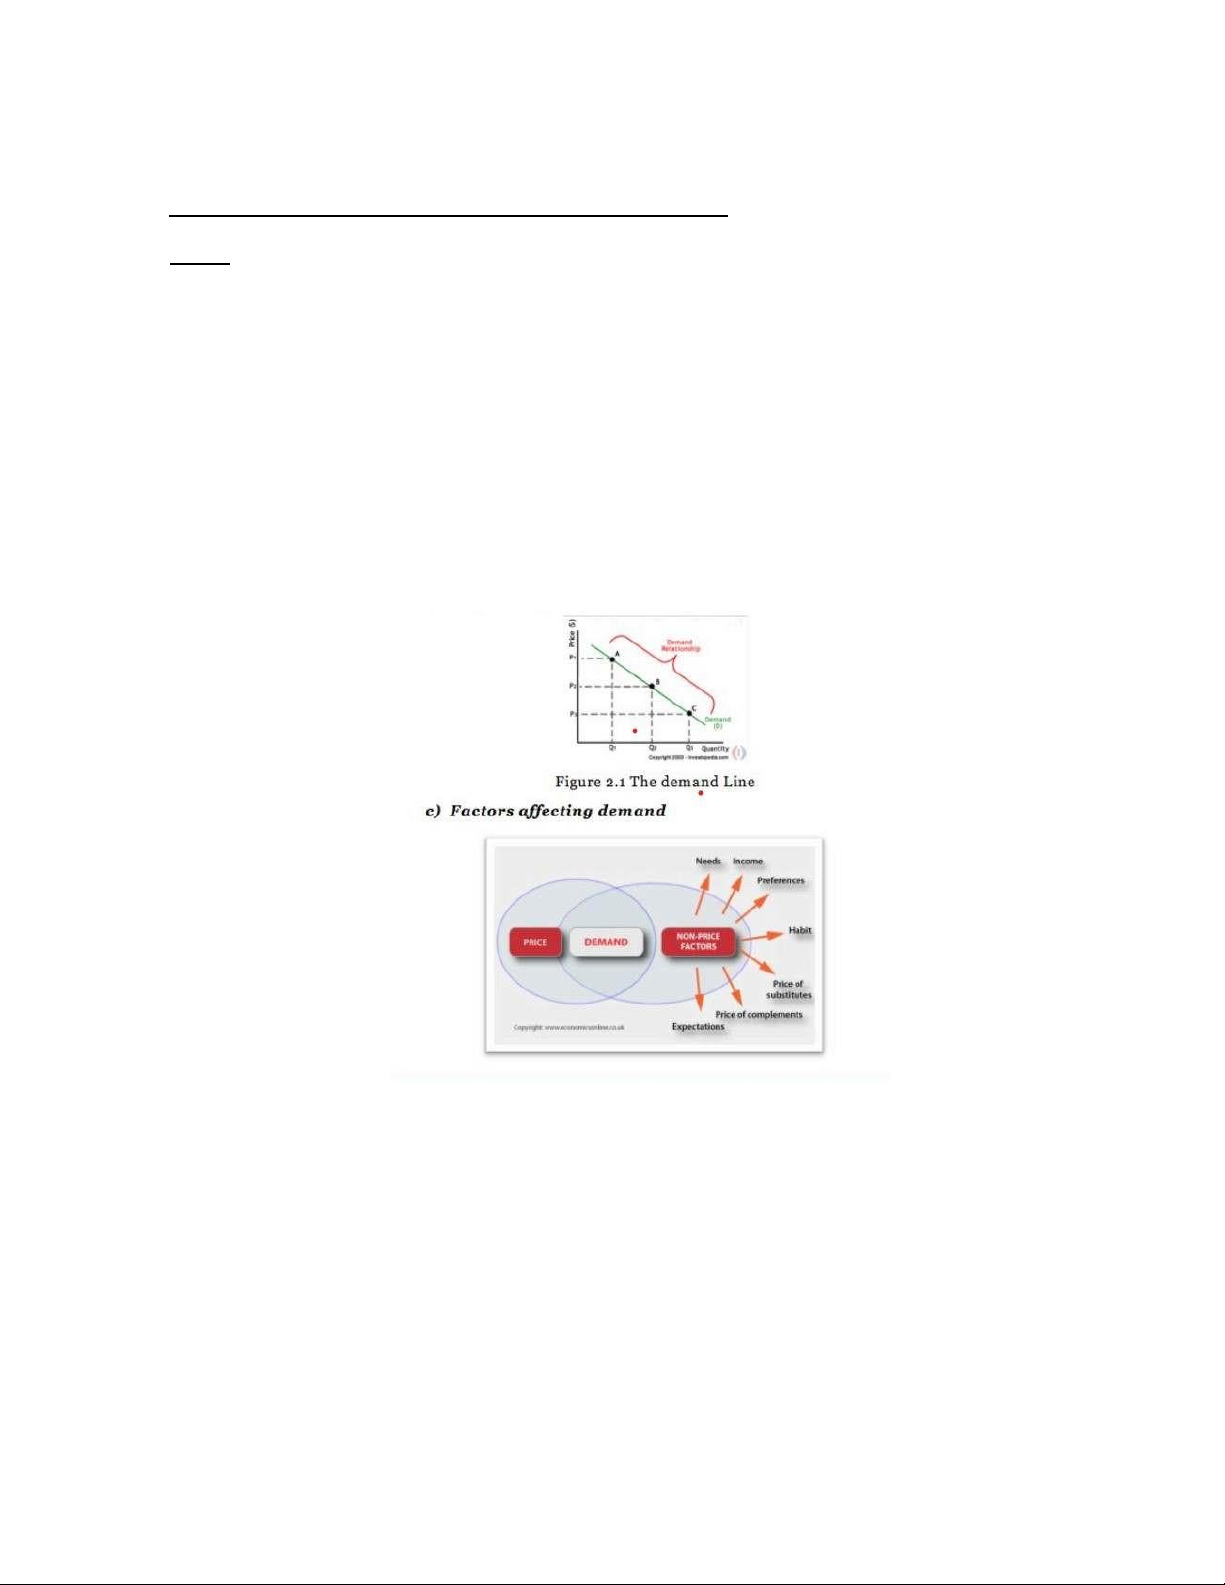
Demand refers to how much (quantity) of a product or service, that buyers are able to buy and
willing to buy at different prices during a certain time.
The quantity demanded is the amount of a product people are able and willing to buy at a
certain price; the relationship between price and quantity demanded is known as the demand
relationship. b) The law of demand
The law of demand states that, if all other factors remain equal, the higher the price of a good,
the less people will demand that good. In other words, the higher the price, the lower the quantity demanded.
Even though the focus in economics is on the relationship between the price of a product and
how much consumers are willing and able to buy, it is important to examine all of the factors
that affect the demand for a good or service.
These factors include: • Price of the Product
There is an inverse (negative) relationship between the price of a product and the amount of
that product consumers are willing and able to buy. Consumers want to buy more of a product
at a low price and less of a product at a high price. This inverse relationship between price and
the amount consumers are willing and able to buy is often referred to as The Law of Demand.
• The Consumer's Income lOMoAR cPSD| 47305584
The effect that income has on the amount of a product that consumers are willing and able to
buy depends on the type of good we're talking about. For most goods, there is a positive (direct)
relationship between a consumer's income and the amount of the good that one is willing and
able to buy. In other words, for these goods when income rises the demand for the product will
increase; when income falls, the demand for the product will decrease. We call these types of goods normal goods.
However, for some goods the effect of a change in income is the reverse. For example, think
about a low-quality (high fat-content) ground beef. You might buy this while you are a student,
because it is inexpensive relative to other types of meat. But if your income increases enough,
you might decide to stop buying this type of meat and instead buy leaner cuts of ground beef, or
even give up ground beef entirely in favor of beef tenderloin. If this were the case (that as your
income went up, you were willing to buy less high-fat ground beef), there would be an inverse
relationship between your income and your demand for this type of meat. We call this type of
good an inferior good. There are two important things to keep in mind about inferior goods.
They are not necessarily low-quality goods. The term inferior (as we use it in economics) just
means that there is an inverse relationship between one's income and the demand for that
good. Also, whether a good is normal or inferior may be different from person to person. A
product may be a normal good for you, but an inferior good for another person.
• The Price of Related Goods
As with income, the effect that this has on the amount that one is willing and able to buy
depends on the type of good we're talking about. Think about two goods that are typically
consumed together. For example, bagels and cream cheese. We call these types of goods
complements. If the price of a bagel goes up, the Law of Demand tells us that we will be
willing/able to buy fewer bagels. But if we want fewer bagels, we will also want to use less
cream cheese (since we typically use them together). Therefore, an increase in the price of
bagels means we want to purchase less cream cheese. We can summarize this by saying that
when two goods are complements, there is an inverse relationship between the price of one
good and the demand for the other good.
On the other hand, some goods are considered to be substitutes for one another: you don't
consume both of them together, but instead choose to consume one or the other. For example,
for some people Coke and Pepsi are substitutes (as with inferior goods, what is a substitute good
for one person may not be a substitute for another person). If the price of Coke increases, this
may make Pepsi relatively more attractive. The Law of Demand tells us that fewer people will
buy Coke; some of these people may decide to switch to Pepsi instead, therefore increasing the
amount of Pepsi that people are willing and able to buy. We summarize this by saying that when
two goods are substitutes, there is a positive relationship between the price of one good and the demand for the other good.
• The Preferences of Consumers
This is a less tangible item that still can have a big impact on demand. There are all kinds of
things that can change one's tastes or preferences that cause people to want to buy more or less
of a product. For example, if a celebrity endorses (support) a new product, this may increase the
demand for a product. On the other hand, if a new health study comes out saying something is lOMoAR cPSD| 47305584
bad for your health, this may decrease the demand for the product. Another example is that a
person may have a higher demand for an umbrella on a rainy day than on a sunny day.
• The Habit of Consumers
Habits are essentially shortcuts our brains create to reduce the amount of time-consuming
deliberation we have to do. While we can override habits, they are harder to overcome with
deliberate intention when we are tired, stressed, or distracted. Consumer habits impact how
they shop, what they buy, and how they use the products in their lives.
Brands can and should analyze their customers' routines. Because habits are often automatic or
nonconscious patterns, it's hard for consumers to articulate what is and is not habitual.
Researchers instead draw from academic research on habits and incorporate it into behavioral
segmentations to understand what is and isn't a habitual behavior. In addition, drawing on
academic knowledge of habits allows researchers to make recommendations and identify
opportunities to influence habit formation and maintenance.
• The Consumer's Expectations
It doesn't just matter what is currently going on - one's expectations for the future can also
affect how much of a product one is willing and able to buy. For example, if you hear that Apple
will soon introduce a new iPod that has more memory and longer battery life, you and other
consumers) may decide to wait to buy an iPod until the new product comes out. When people
decide to wait, they are decreasing the current demand for iPods because of what they expect
to happen in the future. Similarly, if you expect the price of gasoline to go up tomorrow, you may
fill up your car with gas now. So, your demand for gas today increased because of what you
expect to happen tomorrow. This is similar to what happened after Huricane Katrina hit in the
fall of 2005. Rumors started that gas stations would run out of gas. As a result, many consumers
decided to fill up their cars (and gas cans), leading to long lines and a big increase in the demand
for gas. This was all based on the expectation of what would happen.
• The Number of Consumers in the Market
As more or fewer consumers enter the market this has a direct effect on the amount of a
product that consumers in general) are willing and able to buy. For example, a pizza shop located
near a University will have more demand and thus higher sales during the fall and spring
semesters. In the summers, when less students are taking classes, the demand for their product
will decrease because the number of consumers in the area has significantly decreased. 2.2 Supply of goods a) Supply
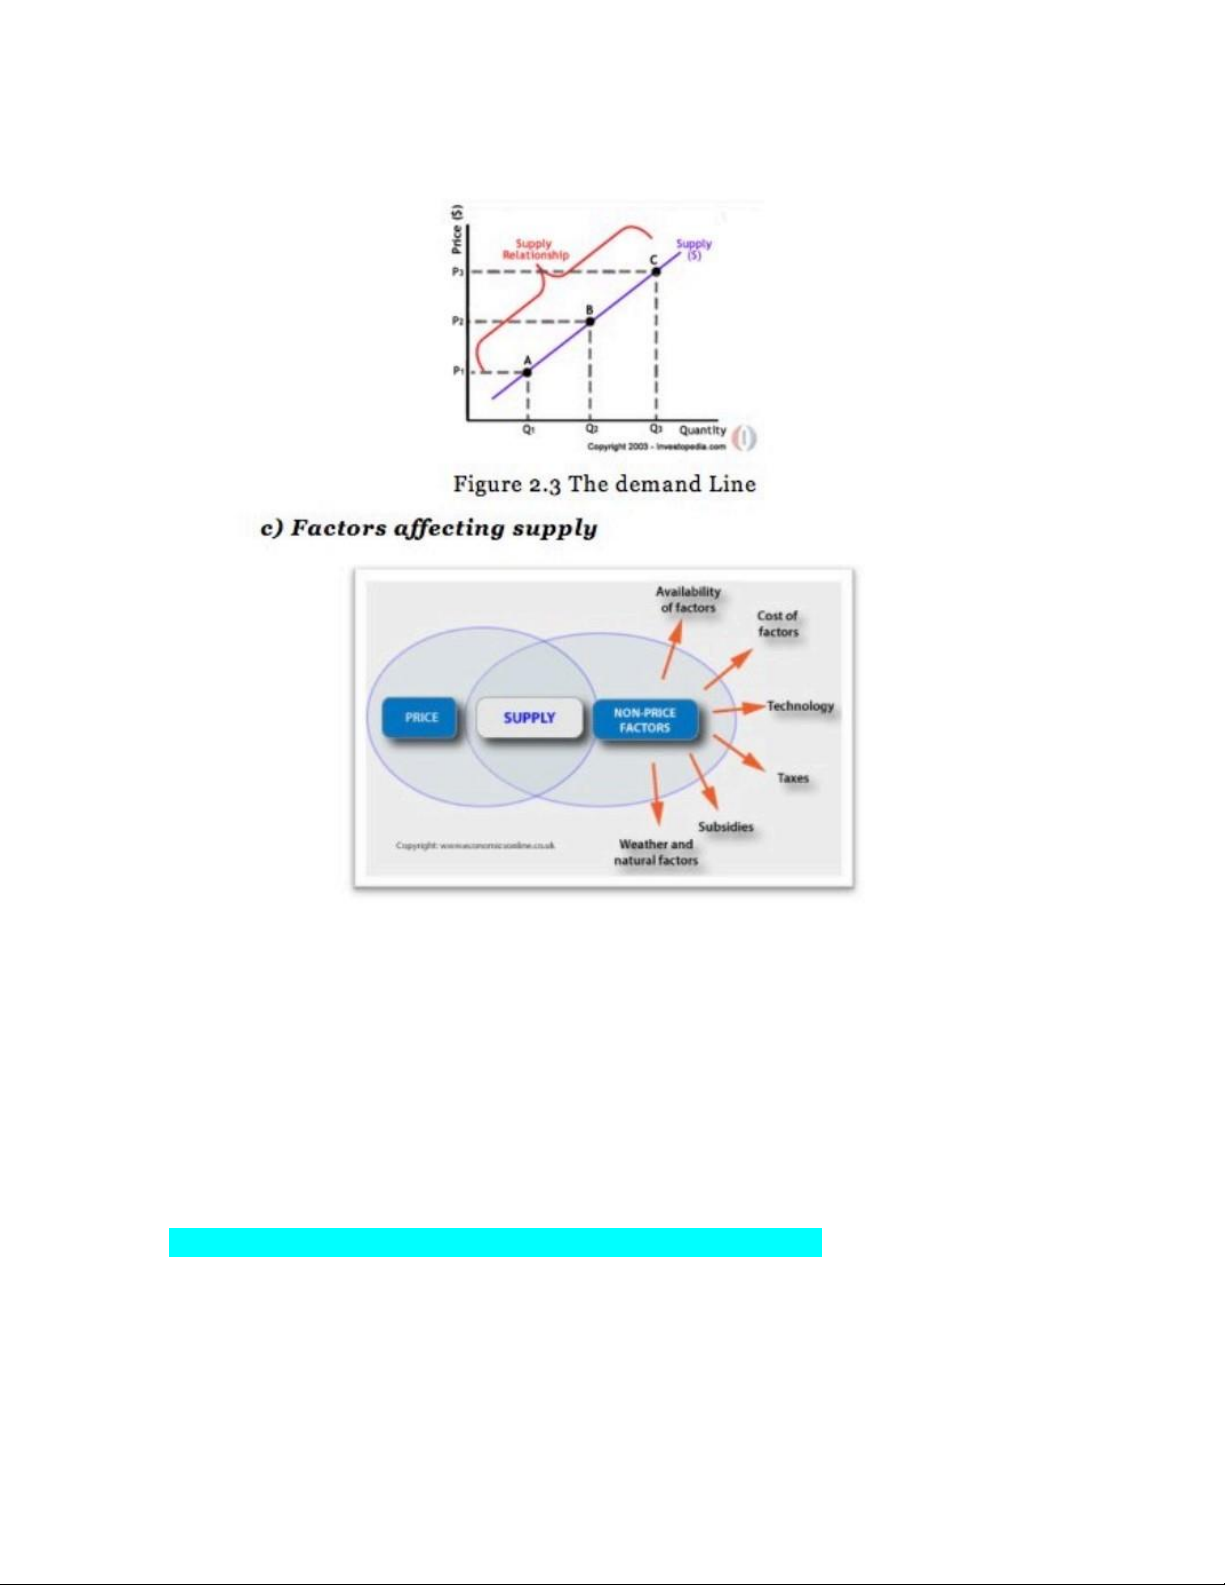
Supply represents how much the market can offer. The quantity supplied refers to the amount of
a certain good producers are able to and willing to supply when receiving a certain price. The
correlation between price and how much of a good or service is supplied to the market is known
as the supply relationship. Price, therefore, is a reflection of supply and demand. b) The Law of Supply
Like the law of demand, the law of supply demonstrates the quantities that will be sold at a
certain price. But unlike the law of demand, the supply relationship shows an upward slope. This lOMoAR cPSD| 47305584
means that the higher the price, the higher the quantity supplied. Producers supply more at a
higher price because selling a higher quantity at a higher price increases revenue.
Some of the important factors affecting the supply of a commodity are as follows:
There are several important factors that determine supply of a commodity. A change in any one
of these factors will result in a change in supply of the commodity.
• Price of the given Commodity:
The most important factor determining the supply of a commodity is its price. As a general rule,
price of a commodity and its supply are directly related. It means, as price increases, the
quantity supplied of the given commodity also rises and vice-versa. It happens because at higher
prices, there are greater chances of making profit. It induces the firm to offer more for sale in the market.
Supply (S) is a function of price (P) and can be expressed as: S = f(P). The direct relationship
between price and supply, known as 'Law of Supply'. The following determinants are termed as
other factors' or factors other than price'.
• Prices of other Goods:
As resources have alternative uses, the quantity supplied of a commodity depends not only on
its price, but also on the prices of other commodities. lOMoAR cPSD| 47305584
Increase in the prices of other goods makes them more profitable in comparison to the given
commodity. As a result, the firm shifts its limited resources from production of the given
commodity to production of other goods. For example, increase in the price of other good (say,
wheat) will induce the farmer to use land for cultivation of wheat in place of the given commodity (say, rice).
• Prices of Factors of Production (inputs):
When the amount payable to factors of production and cost of inputs increases, the cost of
production also increases. This decreases the profitability. As a result, seller reduces the supply
of the commodity. On the other hand, decrease in prices of factors of production or inputs,
increases the supply due to fall in cost of production and subsequent rise in profit margin.
To make ice-cream, firms need various inputs like cream, sugar, machine, labour, etc. When
price of one or more of these inputs rises, producing icecreams will become less profitable
and firms supply fewer ice creams.
• State of Technology:
Technological changes influence the supply of a commodity. Advanced and improved technology
reduces the cost of production, which raises the profit margin. It induces the seller to increase
the supply. However, technological degradation or complex and out-dated technology will
increase the cost of production and it will lead to decrease in supply.
. Government Policy (Taxation Policy):
Increase in taxes raises the cost of production and, thus, reduces the supply, due to lower profit
margin. On the other hand, tax concessions and subsidies increase the supply as they make it
more profitable for the firms to supply goods.
• Weather, natural factors
Weather conditions can make it hazardous and even impossible for delivery trucks to transport
products to distributors and retailers. Snow, ice and heavy rain can slow and stop transportation,
making products such as groceries unavailable when they are most needed. Delivery issues
often reinforce weather-related surges in demand as retailers are unable to restock their shelves
at precisely the times when consumers are likely to buy in quantity. This convergence of
difficulties is especially challenging with perishable staples, such as milk, eggs and fresh produce.
Besides all of above factors, Goals / Objectives of the firm can affect Supply. Generally, supply of
a commodity increases only at higher prices as it fulfills the objective of profit maximization.
However, with change in trend, some firms are willing to supply more even at those prices,
which do not maximize their profits. The objective of such firms is to capture extensive markets
and to enhance their status and prestige. 2.3 Supply-demand equilibrium a) Equilibrium
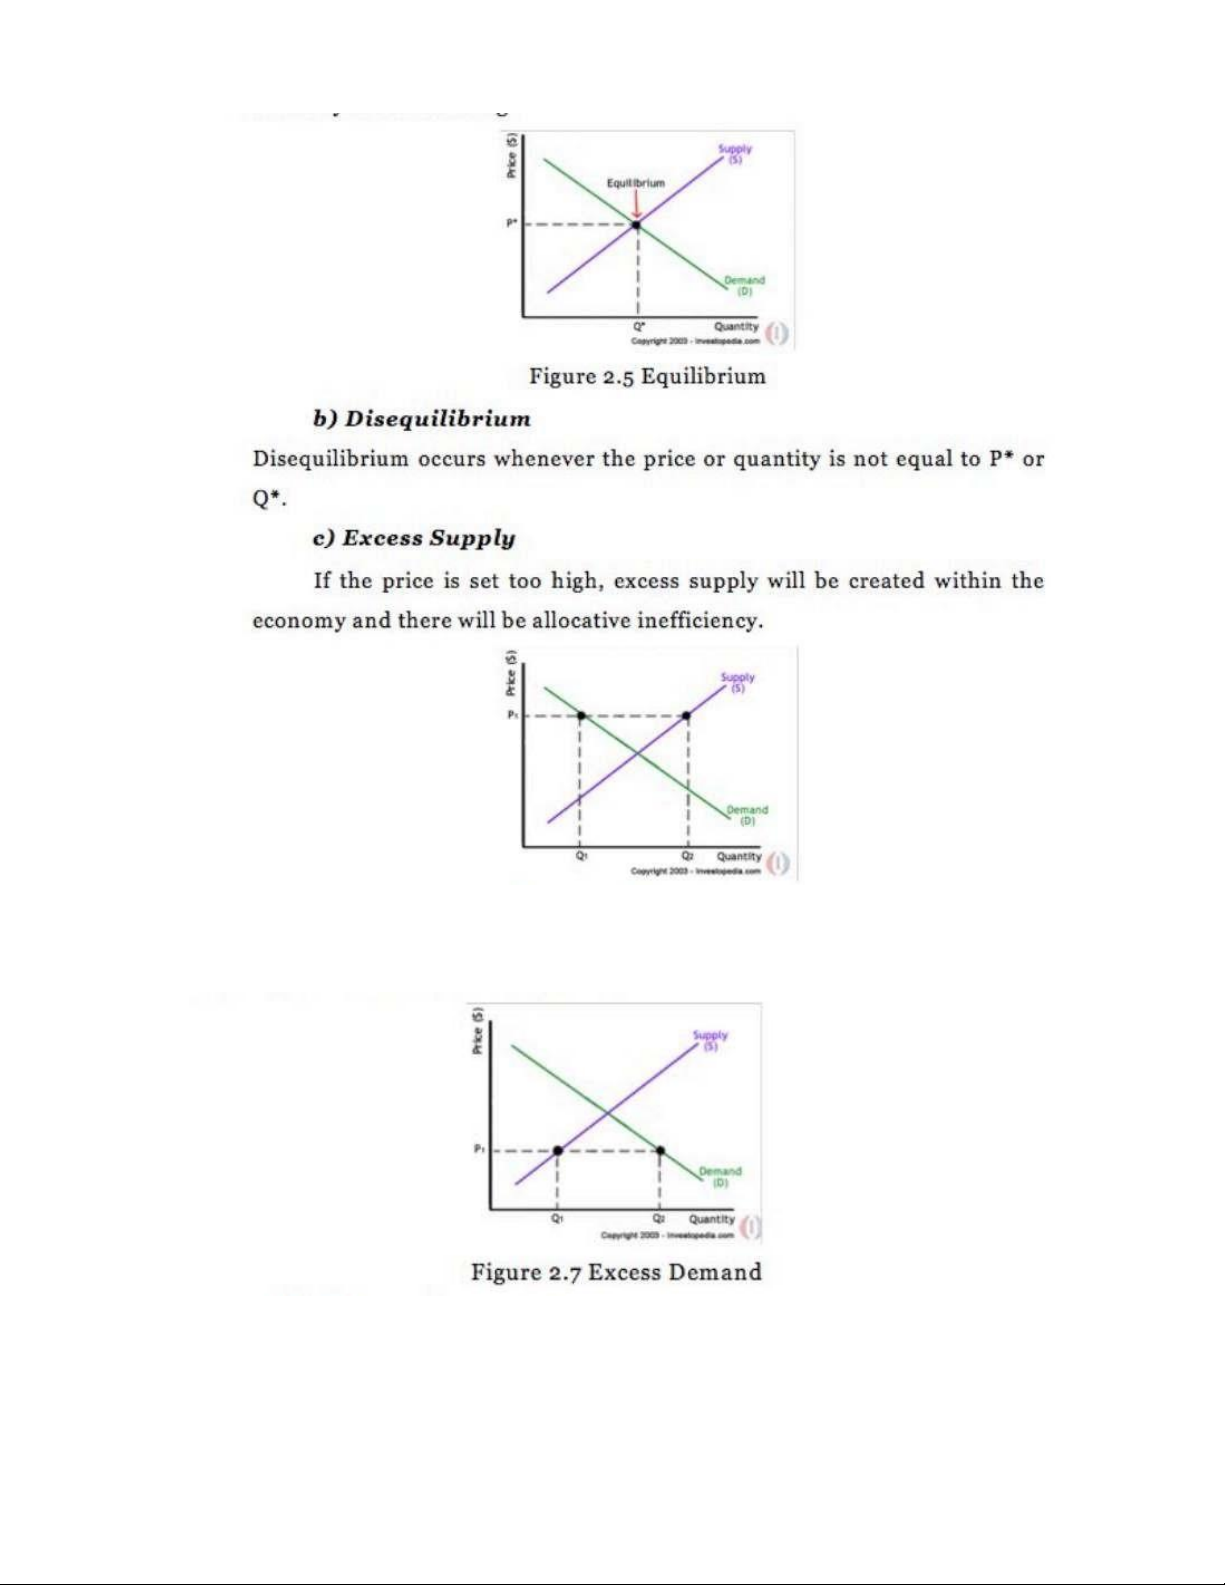
When supply and demand are equal (i.e. when the supply function and demand function
intersect) the economy is said to be at equilibrium. At this point, the allocation of goods is at its
most efficient because the number of goods being supplied is exactly the same as the number of
goods being demanded. Thus, everyone individuals, firms, or countries) is satisfied with the
current economic condition. At the given price, suppliers are selling all the goods that they have
produced and consumers are getting all the goods that they are demanding. lOMoAR cPSD| 47305584 d) Excess Demand
Excess demand is created when price is set below the equilibrium price. Because the price is so
low, too many consumers want the good while producers are not making enough of it.
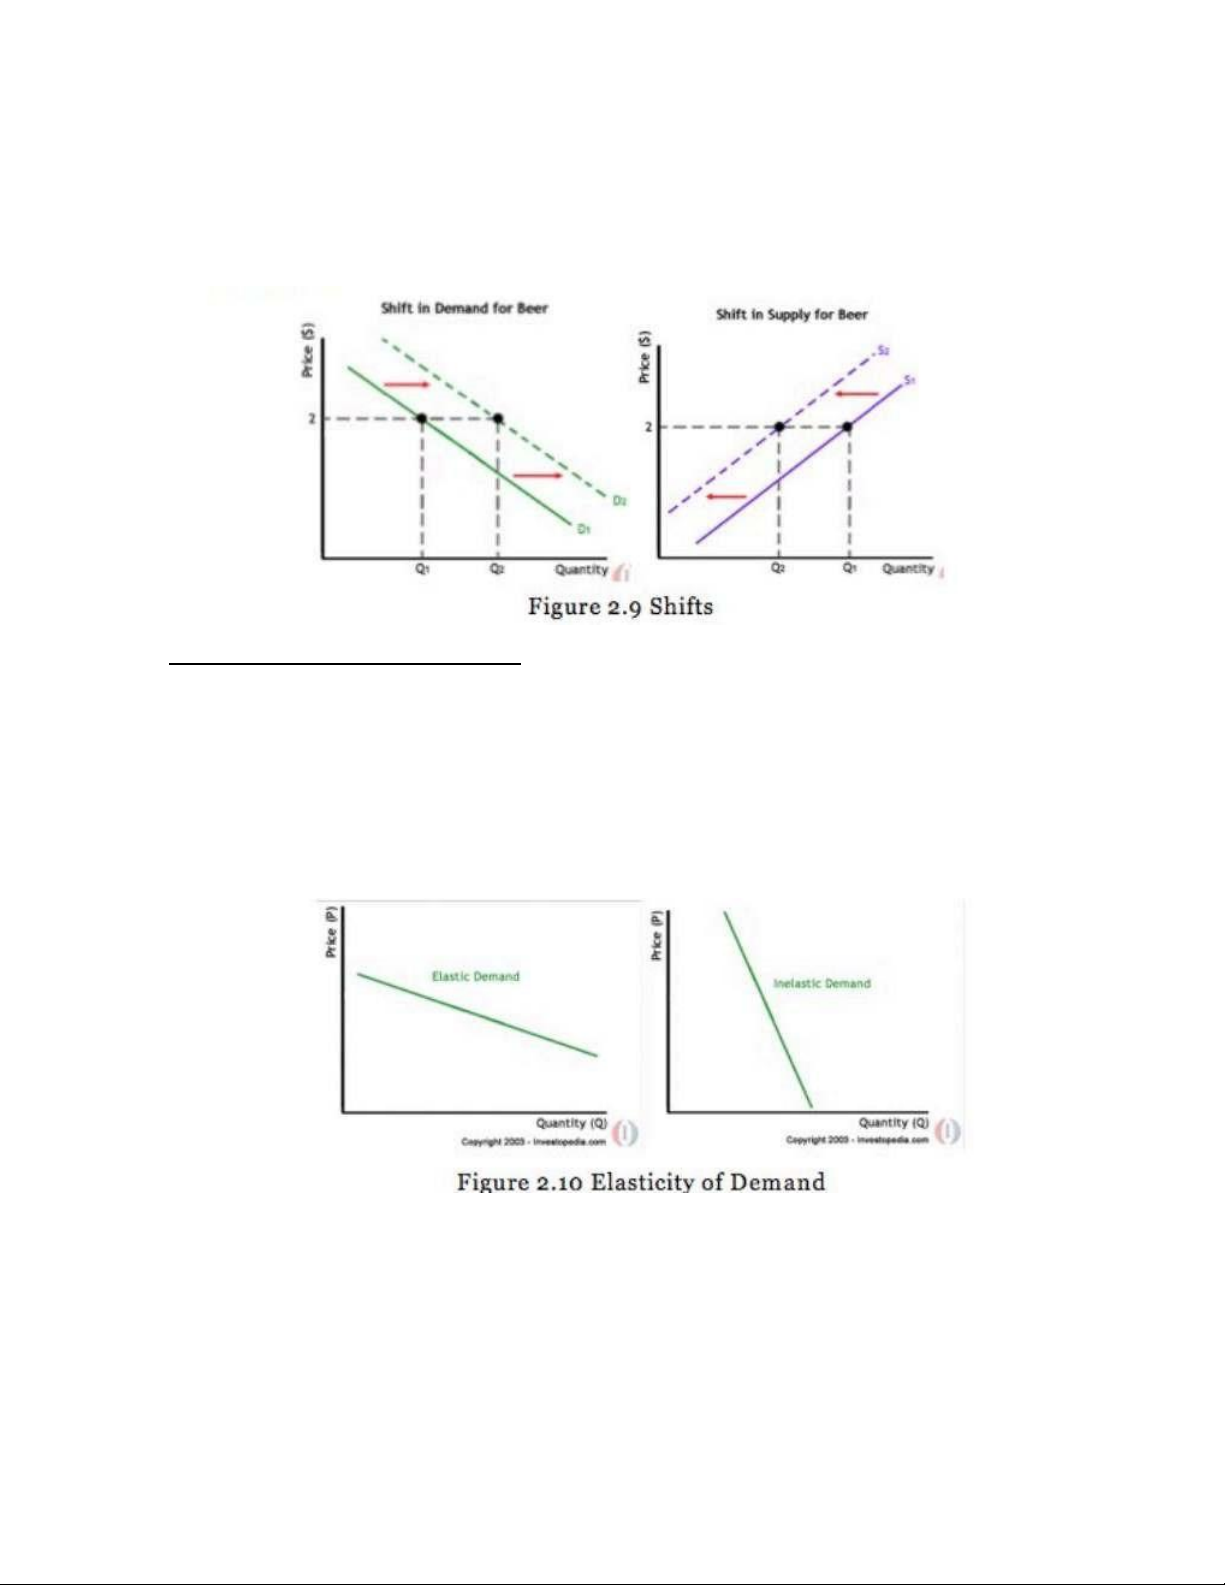
e) Shifts vs. Movement
For economics, the "movements" and "shifts" in relation to the supply and demand curves
represent very different market phenomena: lOMoAR cPSD| 47305584
A movement refers to a change along a curve. On the demand curve, a movement denotes a
change in both price and quantity demanded from one point to another on the curve. A
movement along the demand curve will occur when the price of the good changes and the
quantity demanded changes in accordance to the original demand relationship. In other words,
a movement occurs when a change in the quantity demanded is caused only by a change in price, and vice versa.
2.4 Elasticity of supply and demand a) Elasticity
We've seen that the demand and supply of goods react to changes in price, and that prices in
turn move along with changes in quantity. We've also seen that the utility, or satisfaction
received from consuming or acquiring goods diminishes with each additional unit consumed.
The degree to which demand or supply reacts to a change in price is called elasticity. To
determine the elasticity of the supply or demand of something, we can use this simple equation:
Elasticity = (% change in quantity / % change in price)
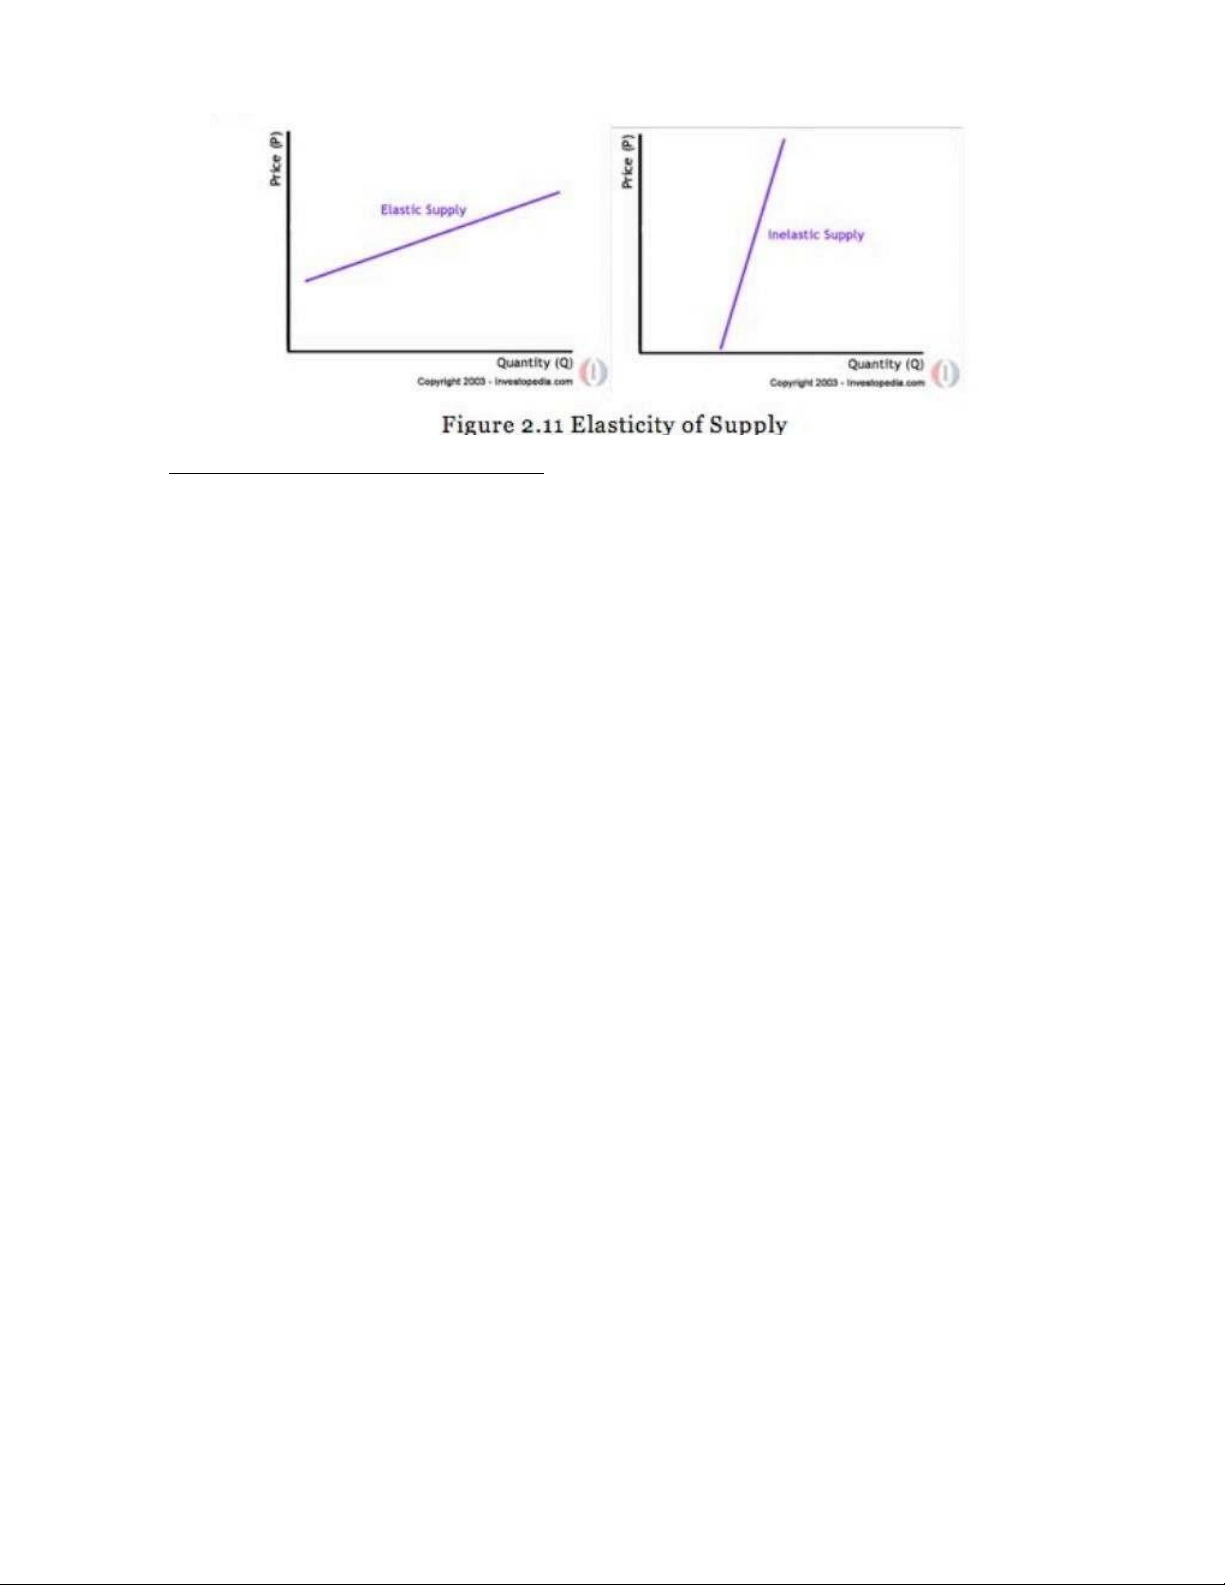
Elasticity of supply works similarly. Remember that the supply curve is upward sloping. If a small
change in price results in a big change in the amount supplied, the supply curve appears flatter
and is considered elastic. Elasticity in this case would be greater than or equal to one.
On the other hand, if a big change in price only results in a minor change in the quantity
supplied, the supply curve is steeper and its elasticity would be less than one. The good in
question is inelastic with regard to supply. lOMoAR cPSD| 47305584
b) Factors Affecting Demand Elasticity
There are three main factors that influence a good's price elasticity of demand:
• Avaiability of substitutes • Necessity • Time
c) Factors Affecting Supply Elasticity • Raw materials.
The producers convert the raw materials into finished products so that it can be made available
to the consumers. The availability of raw materials determines the elasticity of supply. If the raw
materials are readily available, then the supply will be elastic. On the contrary if the raw
materials are not that readily available then the supply will be inelastic in nature. • Production Cost.
The cost of production is yet another factor that determines the elasticity of supply. When the
cost of production is low then the producers are encouraged to provide more goods in the
market. So, the elasticity of supply in this scenario will be relatively elastic. But this is not the
case with higher production costs because for higher costs the supply will be inelastic in nature.
• Time factor. The time factor in other words can be stated as short run and long run. Supply of
the goods and services is made in response to the prices and also demand. When the
producers have sufficient time to react to price and demand then the nature of elasticity of
supply will be relatively elastic. But when sufficient time is not there for the producers to
respond then the elasticity of supply will be relatively inelastic in nature.
The long run and short run also matters when it comes to the utilization of factors of production.
General assumption is that in the long run all the factors can be utilized to increase the supply
but in the short run this is not the case. So, the inference here is that the nature of supply is less
elastic in the short run than the long run.
d) Total revenue and Elasticity
The key concept in thinking about collecting the most revenue is the price elasticity of demand.
Total revenue is price times the quantity of tickets sold (TB = PxQd). Imagine that the band starts lOMoAR cPSD| 47305584
off thinking about a certain price, which will result in the sale of a certain quantity of tickets. The
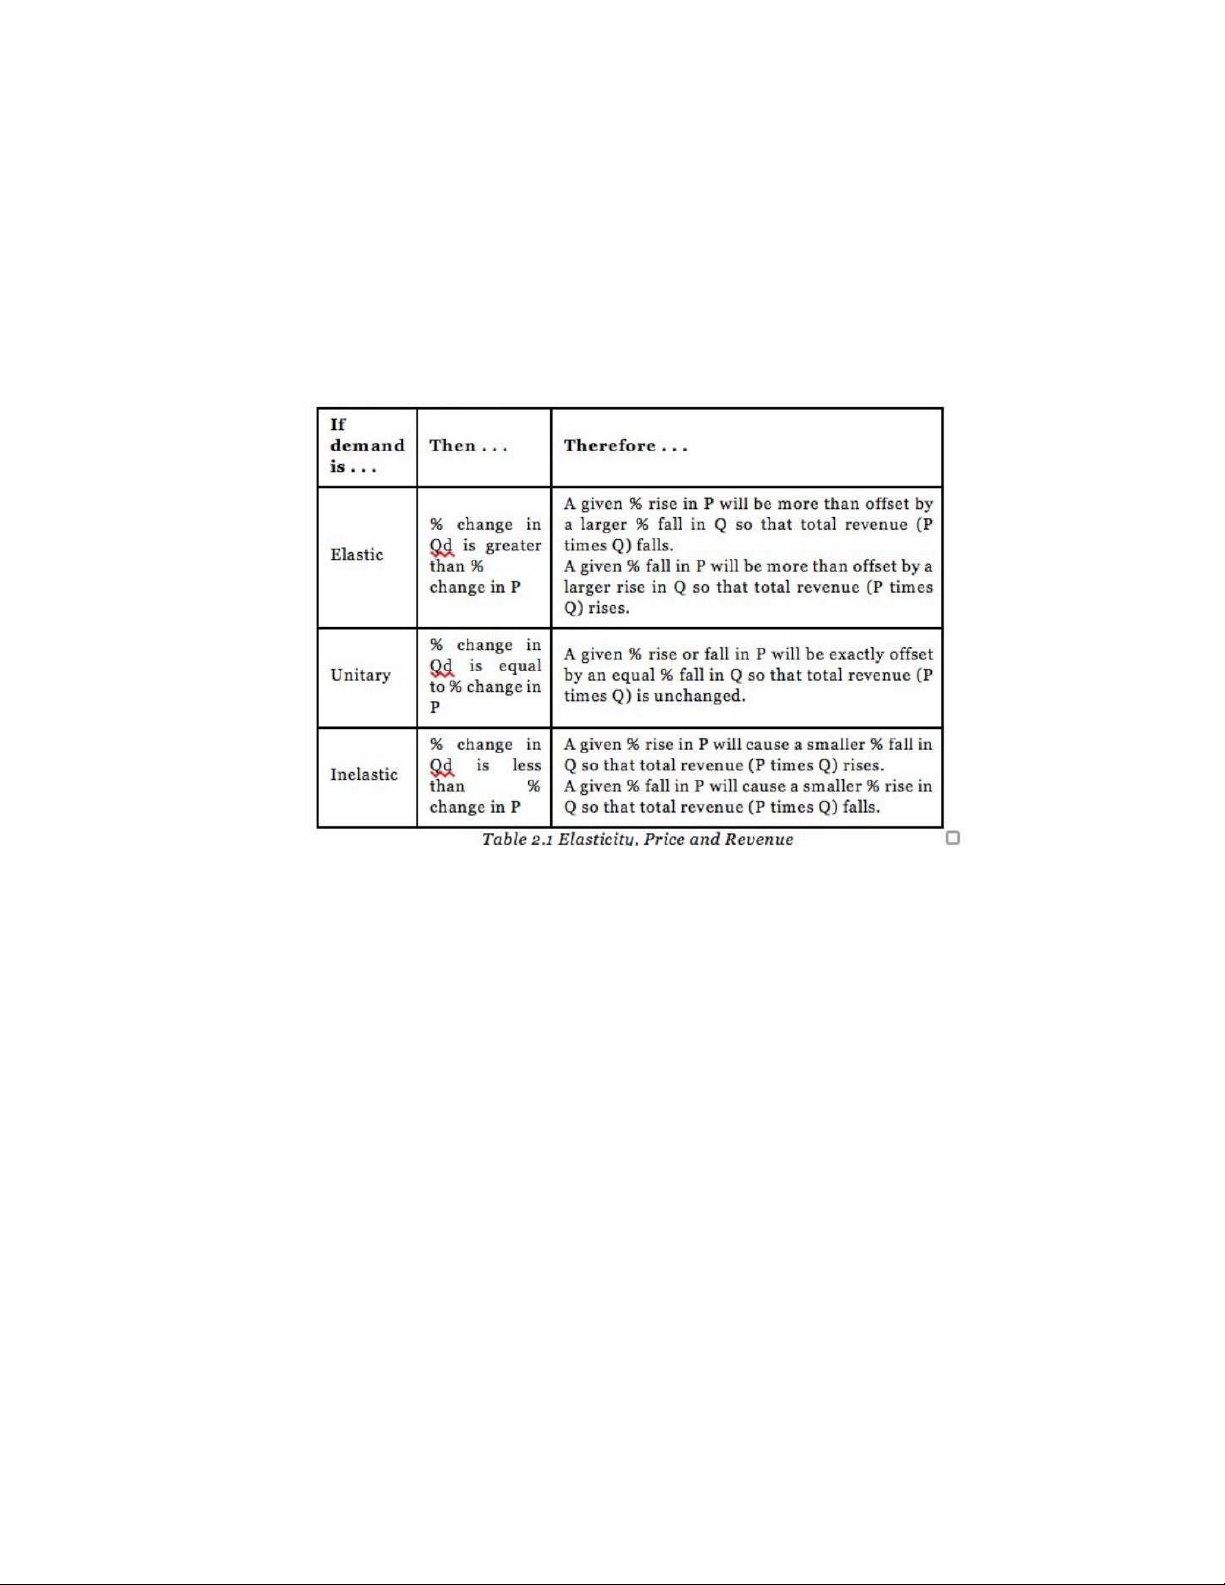
three possibilities are laid out in Table 1. If demand is elastic at that price level, then the band
should cut the price, because the percentage drop in price will result in an even larger
percentage increase in the quantity soldthus raising total revenue. However, if demand is
inelastic at that original quantity level, then the band should raise the price of tickets, because a
certain percentage increase in price will result in a smaller percentage decrease in the quantity
sold-and total revenue will rise. If demand has a unitary elasticity at that quantity, then a
moderate percentage change in the price will be offset by an equal percentage change in
quantity-so the band will earn the same revenue whether it (moderately) increases or decreases the price of tickets.
If demand is elastic at a given price level, then should a company cut its price, the percentage
drop in price will result in an even larger percentage increase in the quantity sold-thus raising
total revenue. However, if demand is inelastic at the original quantity level, then should the
company raise its prices, the percentage increase in price will result in a smaller percentage
decrease in the quantity sold-and total revenue will rise. lOMoAR cPSD| 47305584
Consider a market for tablet computers, as Figure 2.12 shows. The equilibrium price is $80 and
the equilibrium quantity is 28 million. To see the benefits to consumers, look at the segment of
the demand curve above the equilibrium point and to the left. This portion of the demand curve
shows that at least some demanders would have been willing to pay more than $80 for a tablet.
For example, point J shows that if the price were $90, 20 million tablets would be sold. Those
consumers who would have been willing to pay $90 for a tablet based on the utility they expect
to receive from it, but who were able to pay the equilibrium price of $80, clearly received a
benefit beyond what they had to pay. Remember, the demand curve traces consumers'
willingness to pay for different quantities. The amount that individuals would have been willing
to pay, minus the amount that they actually paid, is called consumer surplus. Consumer surplus
is the area labeled F-that is, the area above the market price and below the demand curve.
Consumer and Producer Surplus The somewhat triangular area labeled by F shows the area of
consumer surplus, which shows that the equilibrium price in the market was less than what
many of the consumers were willing to pay. Point J on the demand curve shows that, even at the
price of $90, consumers would have been willing to purchase a quantity of 20 million. The
somewhat triangular area labeled by G shows the area of producer surplus, which shows that
the equilibrium price received in the market was more than what many of the producers were
willing to accept for their products. For example, point K on the supply curve shows that at a
price of $45, firms would have been willing to supply a quantity of 14 million. The supply curve
shows the quantity that firms are willing to supply at each price. For example, point K in Figure
2.12 illustrates that, at $45, firms would still have been willing to supply a quantity of 14 million.
Those producers who would have been willing to supply the tablets at $45, but who were
instead able to charge the equilibrium price of $80, clearly received an extra benefit beyond
what they required to supply the product. The amount that a seller is paid for a good minus the
seller's actual cost is called producer surplus. In Figure 2.12, producer surplus is the area labeled lOMoAR cPSD| 47305584
G-that is, the area between the market price and the segment of the supply curve below the
equilibrium The sum of consumer surplus and producer surplus is social surplus, also referred to
as economic surplus or total surplus. In Figure 2.12, we show social surplus as the area F + G.
Social surplus is larger at equilibrium quantity and price than it would be at any other quantity.
This demonstrates the economic efficiency of the market equilibrium. In addition, at the efficient
level of output, it is impossible to produce greater consumer surplus without reducing producer
surplus, and it is impossible to produce greater producer surplus without reducing consumer surplus.
2.6 Government intervention in the market
Economists believe there are a small number of fundamental principles that explain how
economic agents respond in different situations. Two of these principles, which we have already
introduced, are the laws of demand and supply.
Governments can pass laws affecting market outcomes, but no law can negate these economic
principles. Rather, the principles will become apparent in sometimes unexpected ways, which
may undermine the intent of the government policy. This is one of the major conclusions of this section.
Controversy sometimes surrounds the prices and quantities established by demand and supply,
especially for products that are considered necessities. In some cases, discontent over prices
turns into public pressure on politicians, who may then pass legislation to prevent a certain price
from climbing “too high" or falling "too low."
The demand and supply model shows how people and firms will react to the incentives that
these laws provide to control prices, in ways that will often lead to undesirable consequences.
Alternative policy tools can often achieve the desired goals of price control laws, while
avoiding at least some of their costs and tradeoffs. a) Price Ceilings
Laws that government enact to regulate prices are called price controls. Price controls come in
two flavors. A price ceiling keeps a price from rising above a certain level (the "ceiling"), while a
price floor keeps a price from falling below a given level (the "floor"). This section uses the
demand and supply framework to analyze price ceilings. The next section discusses price floors.
A price ceiling is a legal maximum price that one pays for some good or service. A government
imposes price ceilings in order to keep the price of some necessary good or service affordable.
For example, in 2005 during Hurricane Katrina, the price of bottled water increased above $5 per
gallon. As a result, many people called for price controls on bottled water to prevent the price
from rising so high. In this particular case, the government did not impose a price ceiling, but
there are other examples of where price ceilings did occur.
In many markets for goods and services, demanders outnumber suppliers. Consumers, who are
also potential voters, sometimes unite behind a political proposal to hold down a certain price.
In some cities, such as Albany, renters have pressed political leaders to pass rent control laws, a
price ceiling that usually works by stating that landlords can raise rents by only a certain
maximum percentage each year. Some of the best examples of rent control occur in urban areas
such as New York, Washington D.C., or San Francisco.
Rent control becomes a politically hot topic when rents begin to rise rapidly. Everyone needs an
affordable place to live. Perhaps a change in tastes makes a certain suburb or town a more
popular place to live. Perhaps locally-based businesses expand, bringing higher incomes and lOMoAR cPSD| 47305584
more people into the area. Such changes can cause a change in the demand for rental housing, as
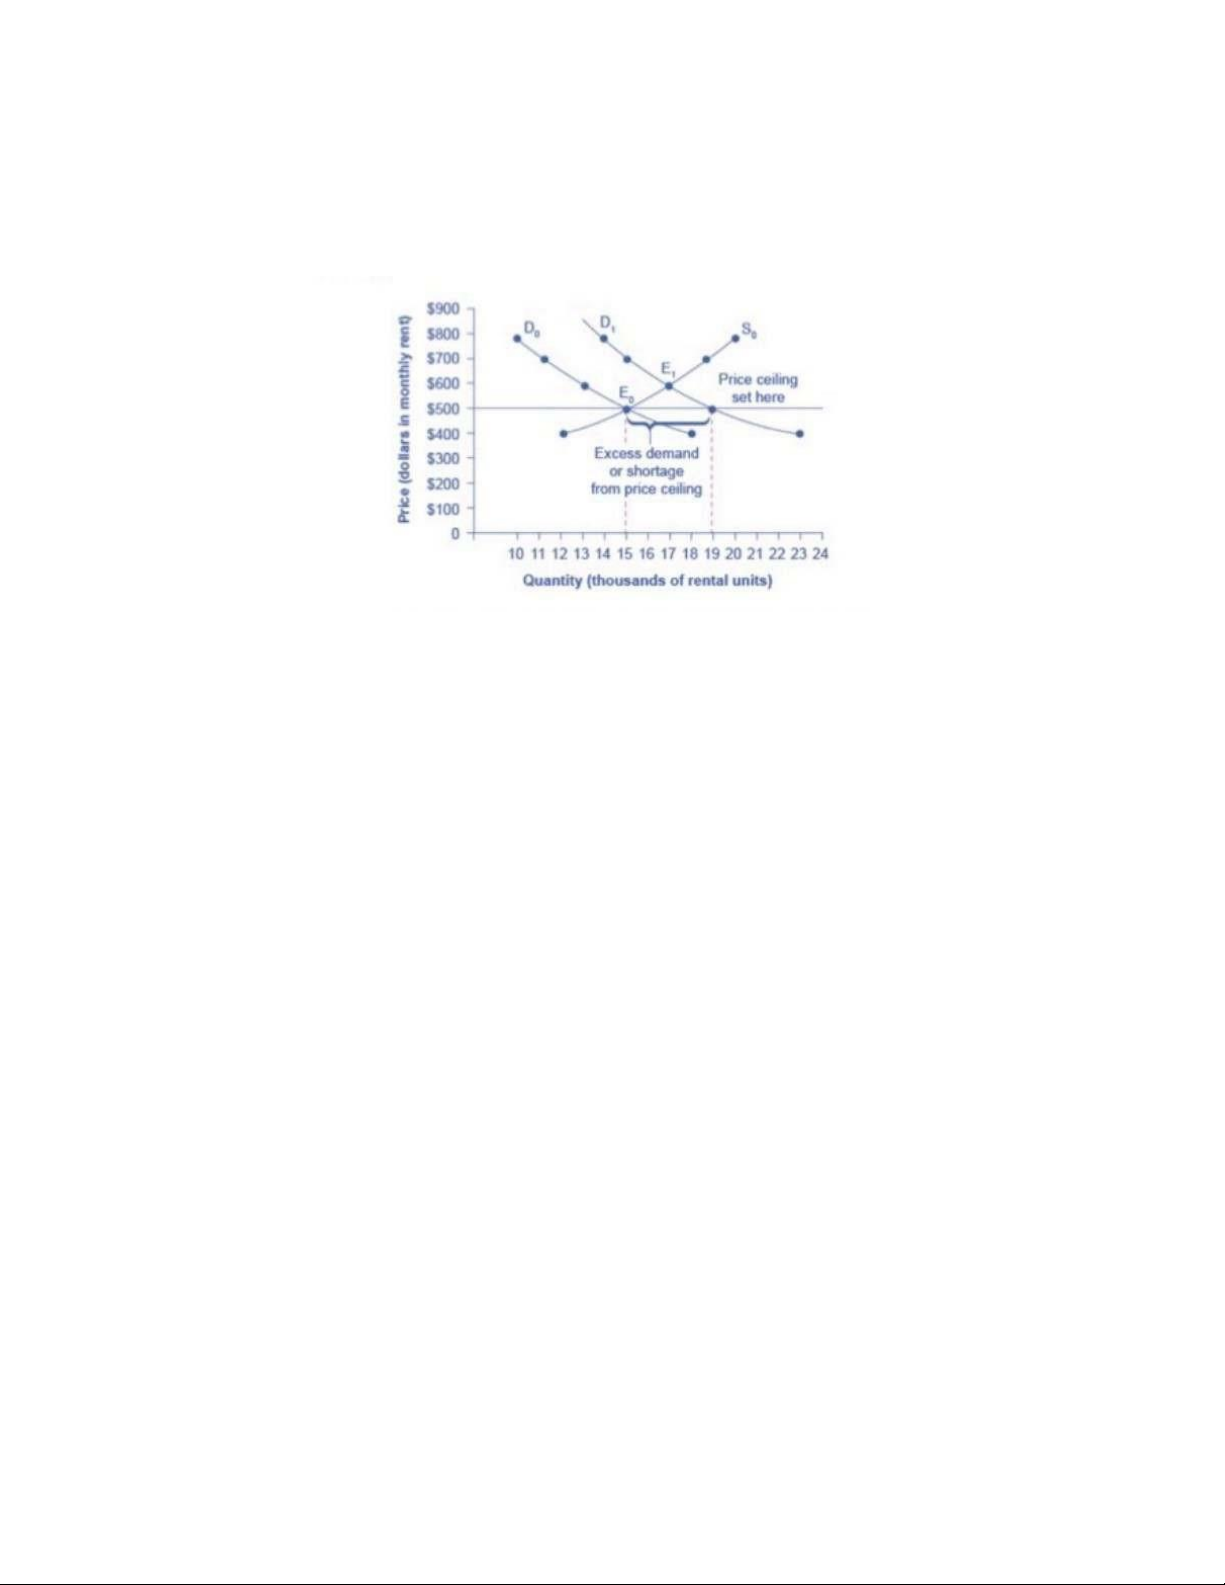
Figure 2.13 illustrates. The original equilibrium (E.) lies at the intersection of supply curve So and
demand curve Do, corresponding to an equilibrium price of $500 and an equilibrium quantity of 15,000 units of 17000 units.
The original intersection of demand and supply occurs at Eo. If demand shifts from Do to D1, the
new equilibrium would be at E-unless a price ceiling prevents the price from rising. If the price is
not permitted to rise, the quantity supplied remains at 15,000. However, after the change in
demand, the quantity demanded rises to 19,000, resulting in a shortage.
Suppose that a city government passes a rent control law to keep the price at the original
equilibrium of $500 for a typical apartment. In Figure 2.13, the horizontal line at the price of
$500 shows the legally fixed maximum price set by the rent control law. However, the underlying
forces that shifted the demand curve to the right are still there. At that price ($500), the quantity
supplied remains at the same 15,000 rental units, but the quantity demanded is 19,000 rental
units. In other words, the quantity demanded exceeds the quantity supplied, so there is a
shortage of rental housing. One of the ironies of price ceilings is that while the price ceiling was
intended to help renters, there are actually fewer apartments rented out under the price ceiling
(15,000 rental units) than would be the case at the market rent of $600 (17,000 rental units).
Price ceilings do not simply benefit renters at the expense of landlords Rather, some renters
(or potential renters) lose their housing as landlords convert apartments to co-ops and condos.
Even when the housing remains in the rental market, landlords tend to spend less on
maintenance and on essentials like heating, cooling, hot water, and lighting. The first rule of
economics is you do not get something for nothing-everything has an opportunity cost. Thus, if
renters obtain "cheaper" housing than the market requires, they tend to also end up with lower quality housing.
Price ceilings are enacted in an attempt to keep prices low for those who need the product.
However, when the market price is not allowed to rise to the equilibrium level, quantity
demanded exceeds quantity supplied, and thus a shortage occurs. Those who manage to
purchase the product at the lower price given by the price ceiling will benefit, but sellers of
the product will suffer, along with those who are not able to purchase the product at all.
Quality is also likely to deteriorate. b) Price Floors lOMoAR cPSD| 47305584
A price floor is the lowest price that one can legally pay for some good or service. Perhaps the
best-known example of a price floor is the minimum wage, which is based on the view that
someone working full time should be able to afford a basic standard of living. The federal
minimum wage in 2016 was $7.25 per hour, although some states and localities have a higher
minimum wage. The federal minimum wage yields an annual income for a single person of
$15,080, which is slightly higher than the Federal poverty line of $11,880. As the cost of living
rises over time, the Congress periodically raises the federal minimum wage.
Price floors are sometimes called "price supports," because they support a price by preventing it
from falling below a certain level. Around the world, many countries have passed laws to create
agricultural price supports. Farm prices and thus farm incomes fluctuate, sometimes widely.
Even if, on average, farm incomes are adequate, some years they can be quite low.
The most common way price supports work is that the government enters the market
and buys up the product, adding to demand to keep prices higher than they otherwise
would be. According to the Common Agricultural Policy reform passed in 2013, the
European Union (EU) will spend about 60 billion euros per year, or 67 billion dollars per
year (with the November 2016 exchange rate), or roughly 38% of the EU budget, on
price supports for Europe's farmers from 2014 to 2020.
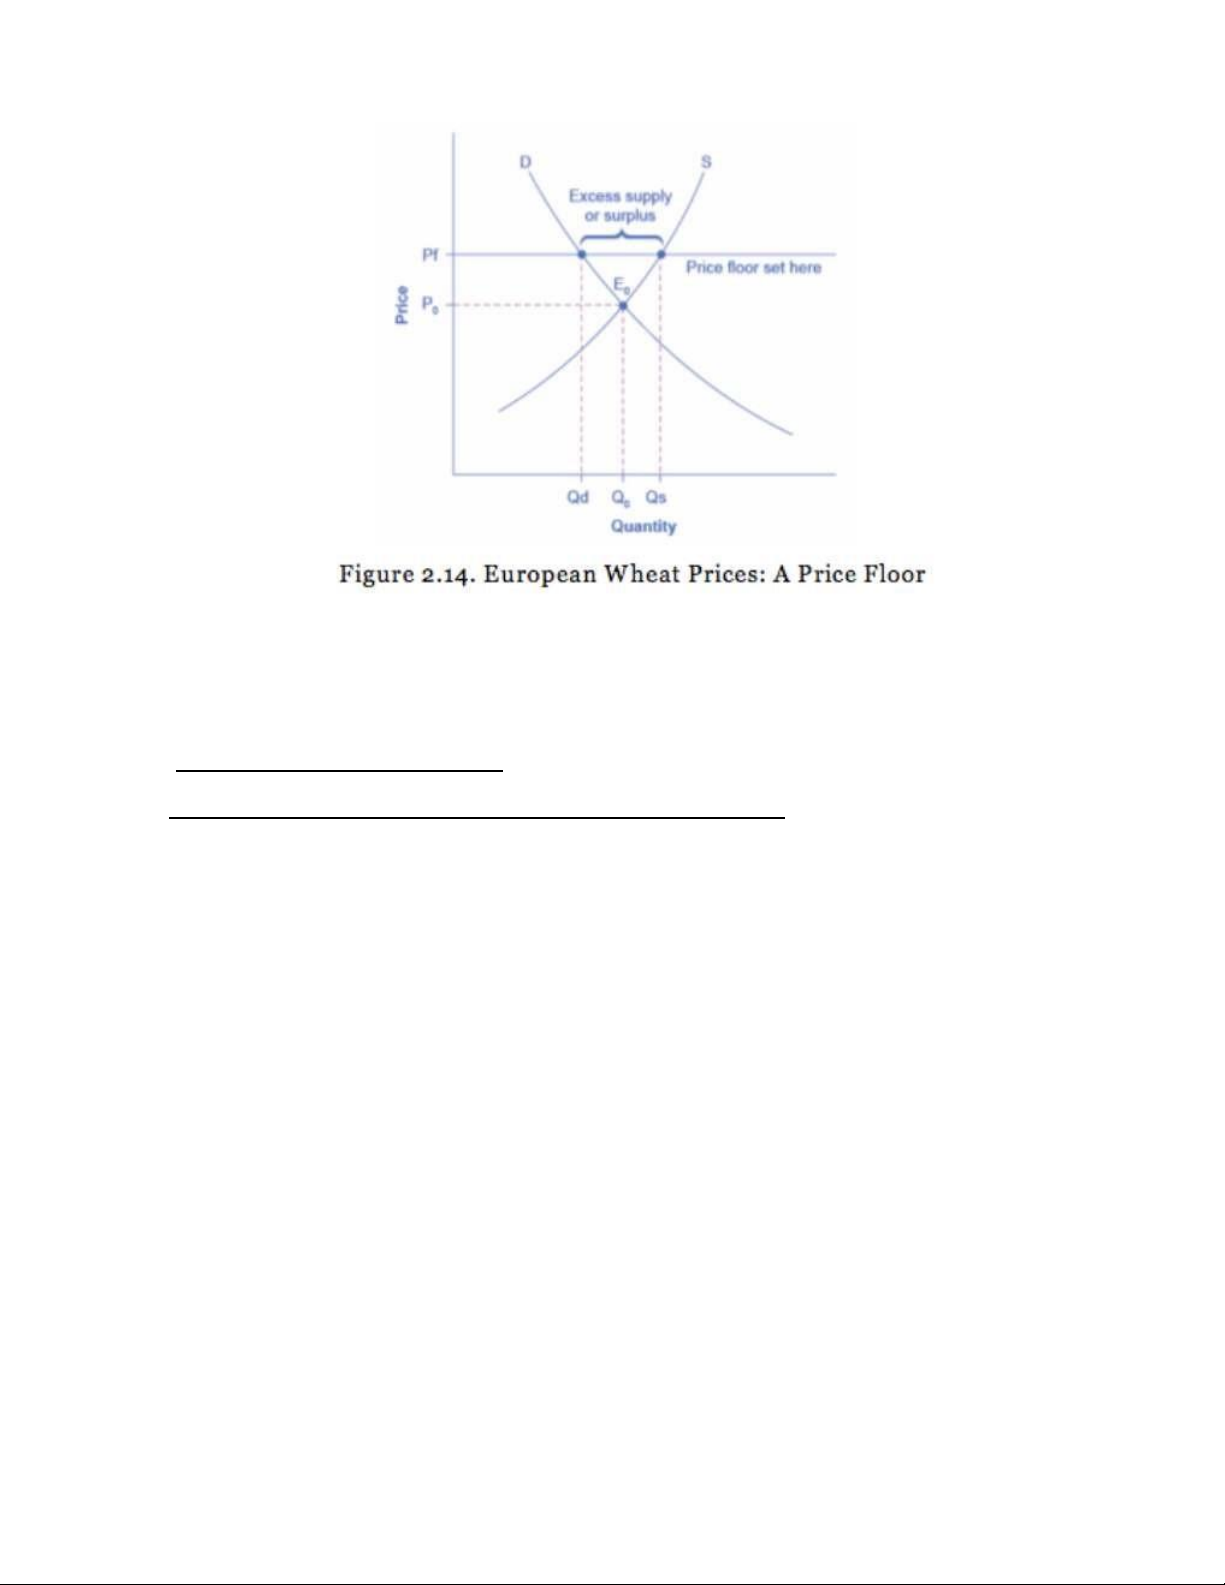
Figure 2.14 illustrates the effects of a government program that assures a price above
the equilibrium by focusing on the market for wheat in Europe. In the absence of
government intervention, the price would adjust so that the quantity supplied would
equal the quantity demanded at the equilibrium point Eo, with price Po and quantity Qo.
However, policies to keep prices high for farmers keeps the price above what would
have been the market equilibrium level, the price Pf shown by the dashed horizontal line
in the diagram. The result is a quantity supplied in excess of the quantity demanded
(od). When quantity supplied exceeds quantity demanded, a surplus exists.
Economists estimate that the high-income areas of the world, including the United
States, Europe, and Japan, spend roughly $1 billion per day in supporting their farmers.
If the government is willing to purchase the excess supply (or to provide payments for
others to purchase it), then farmers will benefit from the price floor, but taxpayers and
consumers of food will pay the costs. Agricultural economists and policy makers have
offered numerous proposals for reducing farm subsidies. In many countries, however,
political support for subsidies for farmers remains strong. This is either because the
population views this as supporting the traditional rural way of life or because of
industry's lobbying power of the agro-business. lOMoAR cPSD| 47305584
The intersection of demand (D) and supply (S) would be at the equilibrium point E.
However, a price floor set at Pf holds the price above E, and prevents it from falling. The
result of the price floor is that the quantity supplied Qs exceeds the quantity demanded
Od. There is excess supply, also called a surplus.
3) Consumer Choice theory
3.1 Explain the choice of consumers by Useful Theory
Marginal Decision-Making and Diminishing Marginal Utility
The budget constraint framework helps to emphasize that most choices in the real world
are not about getting all of one thing or all of another; that is, they are not about
choosing either the point at one end of the budget constraint or else the point all the way
at the other end. Instead, most choices involve marginal analysis, which means
examining the benefits and costs of choosing a little more or a little less of a good.
People naturally compare costs and benefits, but often we look at total costs and total
benefits, when the optimal choice necessitates comparing how costs and benefits
change from one option to another. You might think of marginal analysis as "change
analysis." Marginal analysis is used throughout economics.
We now turn to the notion of utility. People desire goods and services for the satisfaction
or utility those goods and services provide. Utility, as we will see in the chapter on
Consumer Choices, is subjective but that does not make it less real. Economists
typically assume that the more of some good one consumes (for example, slices of
pizza), the more utility one obtains. At the same time, the utility a person receives from
consuming the first unit of a good is typically more than the utility received from
consuming the fifth or the tenth unit of that same good. When Alphonso chooses
between burgers and bus tickets, for example, the first few bus rides that he chooses
might provide him with a great deal of utility-perhaps they help him get to a job interview
or a doctor's appointment. However, later bus rides might provide much less utility-they
Tài liệu liên quan:
-
Tổng hợp Đề thi Kinh tế Thương mại - FB/DethiNEU (Kỳ 1, 2016)
35 18 -
Test chương 1 môn Kinh tế học | Đại học Kinh tế Thành phố Hồ Chí Minh
34 17 -
Bài kiểm tra giữa kỳ môn Kinh tế học | Đại học Kinh tế Thành phố Hồ Chí Minh
41 21 -
Bài giảng Giới thiệu về kinh tế học | Đại học Kinh tế Thành phố Hồ Chí Minh
56 28 -
Đề cương ôn tập môn Kinh tế học | Đại học Kinh tế Thành phố Hồ Chí Minh
34 17