Tài liệu ôn tập Table-Lesson 7 - English | Đại học Văn Lang
Tài liệu ôn tập Table-Lesson 7 - English | Đại học Văn Lang giúp sinh viên tham khảo, ôn luyện và phục vụ nhu cầu học tập của mình cụ thể là có định hướng, ôn tập, nắm vững kiến thức môn học và làm bài tốt trong những bài kiểm tra, bài tiểu luận, bài tập kết thúc học phần, từ đó học tập tốt và có kết quả cao cũng như có thể vận dụng tốt những kiến thức mình đã học
Môn: English (EIIGH) 40 tài liệu
Trường: Trường Đại học Văn Lang 1.5 K tài liệu
Tác giả:


Preview text:
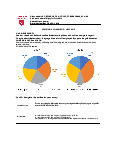
Is this table static or dynamic?
The table below shows the results of a survey that asked
6800 Scottish adults (aged 16 years and over) whether
they had taken part in different cultural activities in the past 12 months.
Work in pairs. Complete the outline for the table above.
The table illustrates the outcomes of research undertaken in Scotland with adults
aged from 16 to 74 to assess their involvement in a variety of cultural activities over a 12-month period.
It is evident that participation in any performance and crafts were the most
popular for all age groups while the least favorite ones were computer-based and writing activities.
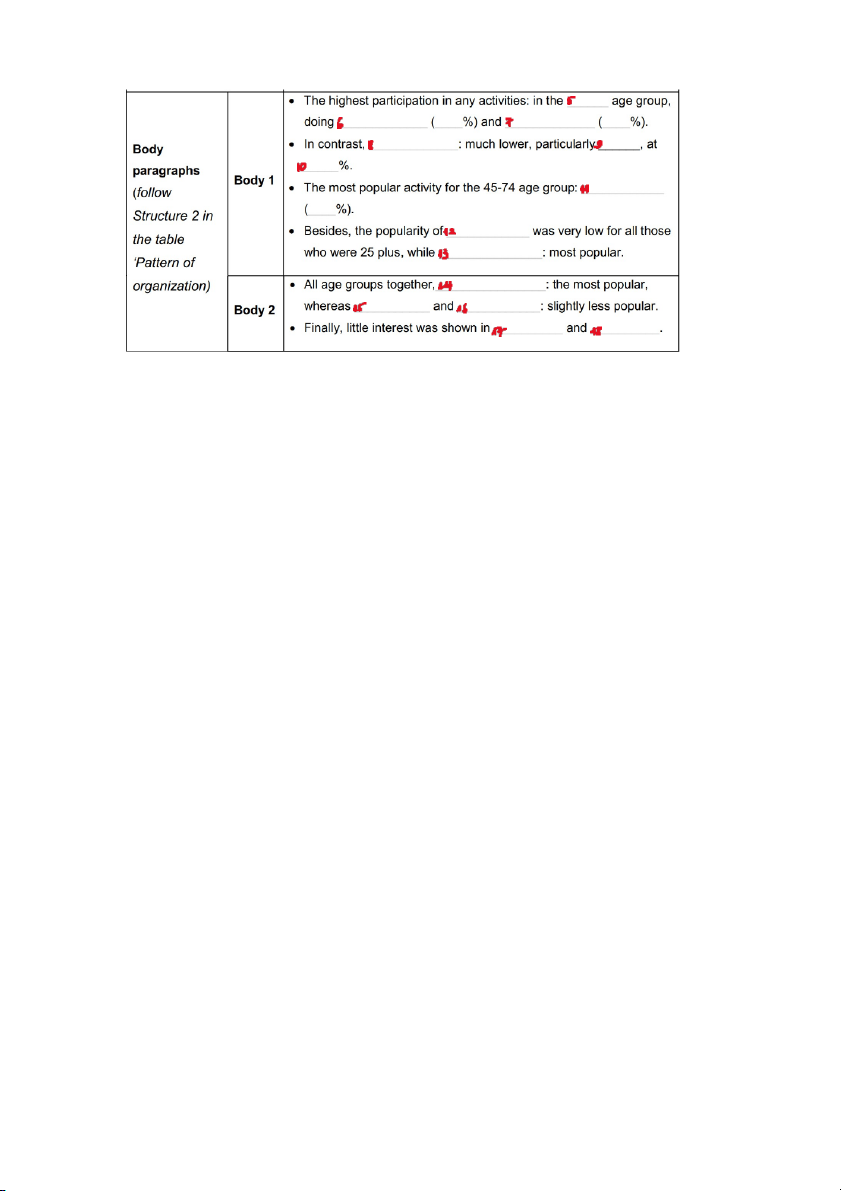
The highest participation in any activities was seen in the 16-24 age group, with
35% and 30% respectively doing performance and visual arts. In contrast, other
activities were much lower, particularly those computer-based, at only 10%. A
rate of 22% was evident for the most popular activity for the 45-74 age group,
which was crafts. Besides, the popularity of computers was very low for all those
who were 25 plus, while any performance was the most popular among people in this age group.
Taking all age groups together, it can be seen that performance and crafts were
the most popular, at over 19%, whereas cultural purchases and visual arts were
slightly less popular at 16% and 15% respectively. Finally, little interest was
shown in writing and computing.
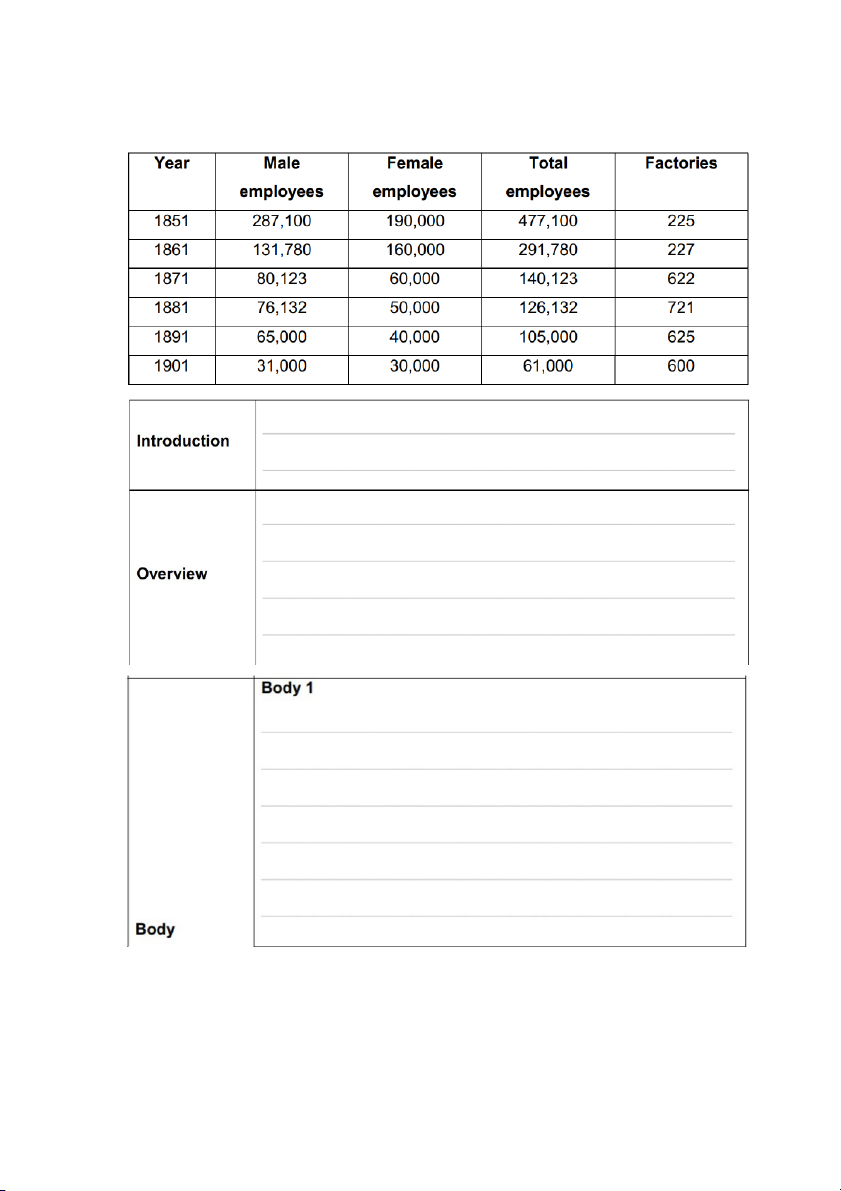
The table below describes the number of employees and factories in England
and Wales from 1851 to 1901.
What should be included in: Introduction Overview Body
Report important changes and trends or differences Paraphrase the topic
Describe general trends or most noticeable features
Tài liệu liên quan:
-
300 câu trắc nghiệm english theo chủ đề -Trường đại học Văn Lang
471 236 -
Lesson 3 Writing Task 0 - English | Đại học Văn Lang
326 163 -
Production Plan - English | Đại học Văn Lang
282 141 -
Template Writing assignment 2 - English ( EIIGH) | Đại học Văn Lang
357 179 -
Template Writing assignment - Đại học Văn Lang
440 220