Tài liệu về báo khoa học môn Khoa học dữ liệu | Đại học Văn Lang
Tài liệu về báo khoa học môn Khoa học dữ liệu | Đại học Văn Lang giúp sinh viên tham khảo, ôn luyện và phục vụ nhu cầu học tập của mình cụ thể là có định hướng, ôn tập, nắm vững kiến thức môn học và làm bài tốt trong những bài kiểm tra, bài tiểu luận, bài tập kết thúc học phần, từ đó học tập tốt và có kết quả cao cũng như có thể vận dụng tốt những kiến thức mình đã học
Môn: Khoa học dữ liệu 13 tài liệu
Trường: Trường Đại học Văn Lang 1.5 K tài liệu
Tác giả:


Preview text:
Home Search
Collections Journals About Contact us My IOPscience
Magnetic susceptibility and heat capacity measurements of single crystal TbMnO3
This content has been downloaded from IOPscience. Please scroll down to see the full text.
2014 J. Phys.: Condens. Matter 26 256002
(http://iopscience.iop.org/0953-8984/26/25/256002)
View the table of contents for this issue, or go to the journal homepage for more Download details: IP Address: 131.238.16.30
This content was downloaded on 01/06/2014 at 19:25
Please note that terms and conditions apply.
Journal of Physics: Condensed Matter
J. Phys.: Condens. Matter 26 (2014) 256002 (6pp)
doi:10.1088/0953-8984/26/25/256002
Magnetic susceptibility and heat capacity
measurements of single crystal TbMnO3
D O’Flynn1, MR Lees and G Balakrishnan
Department of Physics, University of Warwick, Coventry CV4 7AL, UK
E-mail: d.oflynn@ucl.ac.uk, m.r.lees@warwick.ac.uk and g.balakrishnan@warwick.ac.uk
Received 15 January 2014, revised 17 March 2014
Accepted for publication 1 April 2014 Published27 May 2014 Abstract
Measurements of the magnetic susceptibility χ and heat capacity C on single crystals of
the multiferroic TbMnO3 are presented. A non-magnetic isostructural compound, LaGaO3,
was used to isolate the magnetic component of the heat capacity. An anisotropic magnetic
susceptibility, deviations from Curie-Weiss behaviour and a significant magnetic entropy
above the antiferromagnetic ordering temperature TN1=41K are attributed to a combination
of crystal-field effects and short-range order between the Mn moments. Heat capacity in a
magnetic field applied along the a axis confirms the saturation of Tb3+ moments in 90kOe.
A hyperfine contribution from the Tb and Mn nuclear moments that may be convolved with a
contribution from low-lying Tb crystal-field levels leads to a low-temperature rise in C(T)/T.
Keywords: multiferroics, antiferromagnetism, magnetic susceptibility, heat capacity, single crystal
(Some figures may appear in colour only in the online journal) 1. Introduction
of the magnetic structure of the Mn3+ moments, with a canting
in the c direction in the sinusoidal order phase and a canting in
In recent years, multiferroic materials have attracted signifi- the di a
rection in the cycloidal order phase [18].
cant interest due to the coexistence of (anti)ferromagnetism
There is a strong coupling between the Mn and Tb and ferroelectricity [ – 1 ]
3 . The discovery of strong coupling
moments. The magnetization versus applied magnetic field
between these properties makes multiferroics potentially
data at low temperature for single crystal TbMnO 3 show two
attractive for technological applications [4– ] 7 . A well studied
sharp metamagnetic transitions with the field applied along
multiferroic compound is TbMnO , 3 which shows coincident
the b axis and are described as being due to reversal of the
antiferromagnetic and ferroelectric order [ – 8 13]. Importantly, Tb moments[ ]
2 . The second transition at ∼50kOe coincides
it is possible to change the electric polarization direction in
with the ferroelectric polarization flop from the c to the a axis
this compound by the application of a magnetic field [2].
[19]. There is a change in the orientation of the Mn moments
TbMnO3 (space group Pbnm) undergoes three distinct from a - b c to an - a
b cycloidal ordering under these magnetic
magnetic transitions. At T 3+ N1=41K, the Mn moments show
field conditions, highlighting the strong coupling between the
sinusoidal antiferromagnetic order propagating along the
Mn and the Tb moments and explaining the resultant modifi-
crystallographic b axis [2]. The Mn3+ moments undergo a
cations to the ferroelectric properties of TbMnO3 [ ] 20 .
further transition at TN2=27K, with the moments arranging
TbMnO3 has been studied in some detail. Despite this, in a cycloid in the -
b c plane. It is this magnetic order which
there are still only limited data available for some important
breaks inversion symmetry and results in a ferroelectric polar-
bulk properties. The temperature dependence of the magnetic
ization developing at the same temperature [8, , 9 , 14 ] 15 .
susceptibility χ has been reported over a restricted tempera-
AtTN3=7K, the Tb3+ moments order antiferromagnetically ture range along some crystallographic directions for single
[16, 17]. An x-ray resonant scattering study gave a refinement crystals [2, , 19 21, ]
22 and thin films [23] while heat capacity
C as a function of temperature has been reported in zero mag-
1 Author to whom any correspondence should be addressed. Department of
netic field for crystals [2, 22] and in magnetic field for poly-
Medical Physics and Bioengineering, University College London, WC1E 6BT, UK crystalline TbMnO3 [ ]
24 . This work aims to fill these gaps in 0953-8984/14/256002+6$33.00 1
© 2014 IOP Publishing Ltd Printed in the UK
J. Phys.: Condens. Matter 26 (2014) 256002 D O’Flynnet al
the literature. Detailed measurements of the magnetic suscep- 1.0 H c |
tibility of single crystals of TbMnO3 are presented along the
three principal crystallographic axes and an analysis using the 0.8
Curie–Weiss law is given. We also present heat capacity data
with magnetic fields from 0–90kOe applied along the a axis, )-1l
as well as low-temperature measurements down to 0.6K. The 0.6
non-magnetic isostructural compound, LaGaO , mo 3 was used to T (K)
try to isolate the magnetic contribution to the heat capacity 0.4 H a of TbMnO (emu |
3. The magnetic susceptibility and heat capacity χ
measurements reveal that short-range magnetic order persists 0.2 H b |
above TN1 and that significant crystal-field (CF) effects are
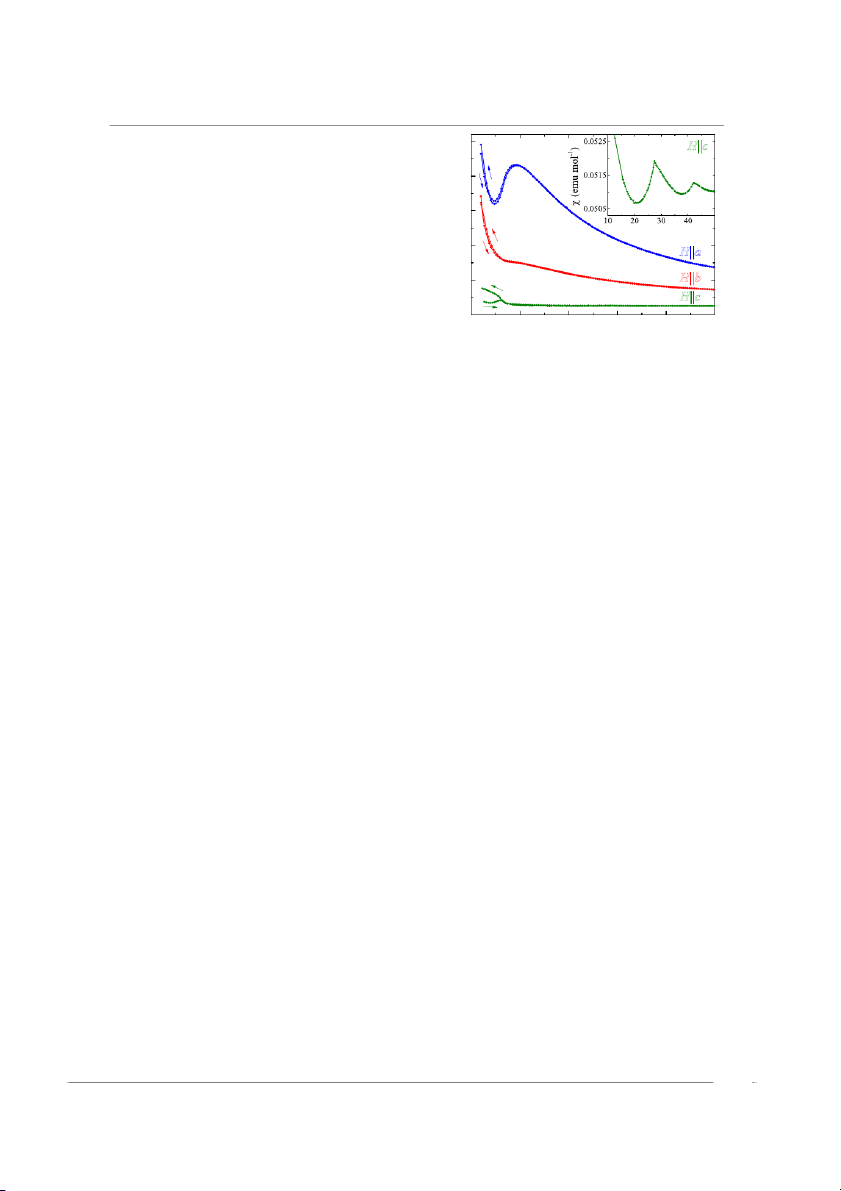
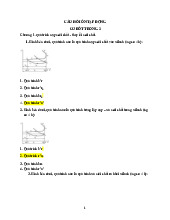
present in this material up to 200K. H c | 0.0 0 10 20 30 40 50 2. Experimental details T (K)
A single crystal of TbMnO3 was grown at a rate of 10mmh−1 Figure 1. Magnetic dc susceptibility measured as a function of
using the floating zone method. The growth was carried out
temperature in a magnetic field of 1kOe applied along the principal
in an Ar atmosphere, using protocols based on previous work
crystallographic axes of a TbMnO3 single crystal. Arrows indicate
the ZFCW and FCC data. Inset: expanded view of the ZFCW
[19]. For magnetic dc susceptibility measurements a single
susceptibility for H‖c.
crystal piece was cut into a rectangular cuboid with dimensions
∼2×2×3mm3, with each surface normal parallel to a prin-
[11, 21]. Choosing the maximum in χ(T) at 9K with H‖a and
cipal crystallographic axis. For the heat capacity measurements,
b accounts for the higher value for TN3 reported in [2 ] 1 .
a single crystal was cut into a thin plate of ∼2×2×0.5mm3,
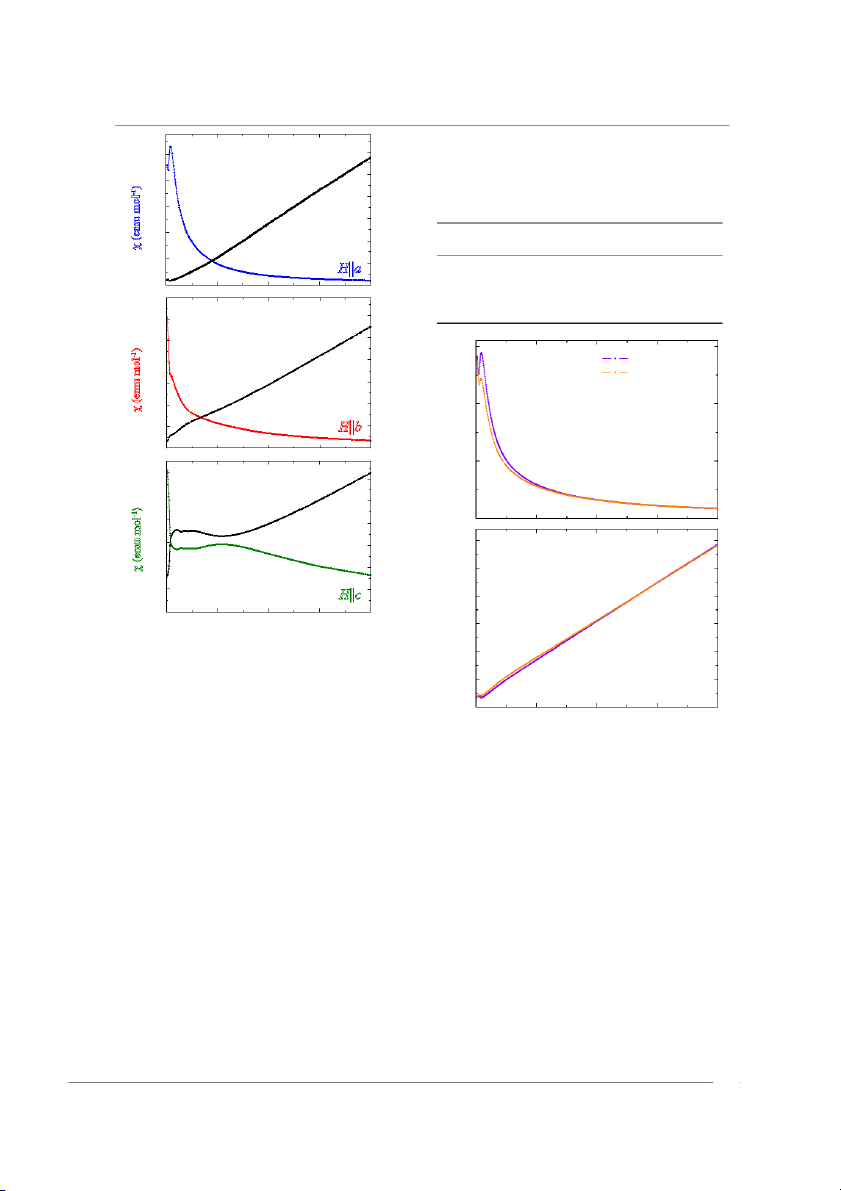
In order to conduct a quantitative analysis of the magnetic
with the normal to the plate parallel to the
a axis. Polycrystalline
susceptibility data, measurements in an applied field of 5kOe LaGaO
were taken between 2K and 400K (figure ) 2 . The inverse sus-
3 was prepared by reacting stoichiometric ratios of La2O3 and Ga
ceptibility in the paramagnetic regime was then fitted to the
2O3. The resulting powder was then pressed into a pellet
before sintering at 1400°C. Magnetic susceptibility measure-
Curie–Weiss (CW) law. A CW dependence is not seen along any
ments were made using a Quantum Design Magnetic Property
of the three directions measured until temperatures much higher
Measurement System (MPMS) XL SQUID magnetometer
than TN1 = 41K. Particularly interesting susceptibility data was
and the heat capacity was measured with a Quantum Design
measured with H‖c, where CW behaviour was not observed until
Physical Property Measurement System (PPMS).
temperatures around 200 K above TN1. Instead, a broad max-
imum is present between ∼40 and 250K. The results of these fits
are shown in table 1. Since the magnetic susceptibility is made 3. Results
up of contributions from both the Tb3 + and Mn3 + moments, it is
difficult to separate the contributions of each ion from this data. 3.1. Magnetic susceptibility
As such, the values of the effective magnetic moment peff=μ/μB
The magnetic susceptibility, χ, of TbMnO3 is highly aniso-
determined, represent the overall moment per formula unit μ of
tropic indicating the presence of significant crystal-field effects. TbMnO 2 2 2 3 and is given by p
(TbMnO3) = p (Tb ) + p (Mn ). eff eff eff
Figure 1 shows the zero-field-cooled warming (ZFCW) and For comparison with the values given in table 1, the theo-
field-cooled cooling (FCC) χ(T) data with a field H=1kOe retical effective moment of TbMnO3 was calculated as 2 2 2
applied along each of the three principal crystallographic axes. p = ⎡g J ( T ( b J + Tb 1)) +g (JMn J ( + eff ⎣ ⎤ Mn 1) J = 10.89 where Tb Mn ⎦ ) J
At low temperatures the largest susceptibility is seen for a
g and g are the Landé g values and JT b and JM n are the total JTb JMn
magnetic field applied parallel to the
a axis, the direction along angular momentum for the Tb3 + and Mn3 + ions respectively.
which the Tb3+ moments have been shown to order in low
(Itshould be noted that the errors given for the values of C, θ magnetic field [1 ]
9 , and suggests that at lower temperatures the and peff are the statistical errors from the fits to the data). There is
Tb3+ are constrained to lie preferentially along this axis. The
reasonable agreement between the values of peff found along the
susceptibility along the c axis exhibits peaks at temperatures
a, b and c axes and the expected value. As a result of the mag-
corresponding to the magnetic transitions in TbMnO
netic anisotropy the values of θ are also quite different along the 3 at TN1 and T
three principal crystallographic axes, with no value being close
N1. This is the only direction along which there is a clear
signature in χ(T) for the ordering of the Mn moments. Features to −TN 1 =−41K.
are seen in the susceptibility along each of the three principal
A Curie-Weiss analysis has previously been carried out on
crystallographic direction around T polycrystalline TbMnO 27 N 3 = 7 K, corresponding 3 [
]. In order to compare our results
to the independent magnetic order of the Tb3
+ moments. For with this published data and to validate the single crystal
H‖a and b the susceptibility is almost reversible while for
data presented above, a piece of single crystal TbMnO 3 was
H‖c there is a clear hysteresis between the ZFCW and FCC
crushed into polycrystalline form for susceptibility measure- data around T
ment. Thepolycrystalline susceptibility is shown in figure 3, N .
3 The observed magnetic susceptibility shows
similar behaviour to those published for Tb
alongside a crystal average calculated as (χ a + χ b + 0.8Y0.2MnO3 [25] χc)/3 and Tb0.95Bi0.05MnO3 [ ] 26 , and for TbMnO 3 up to 60 K (where χ ,
a χb and χc are the susceptibilities along the , a b and 2
J. Phys.: Condens. Matter 26 (2014) 256002 D O’Flynnet al
Table 1.Curie constant, C, Weiss temperature, θ and effective 1.0 (a) 30
magnetic moment, peff, for TbMnO3(TN1=41K) obtained from
Curie-Weiss fits to the inverse susceptibility versus temperature for 25
a single crystal, a crystal average calculated as (χa + χb + χc)/3 and 0.8 ) )-1
powder from a crushed crystal piece. The expected peff value for -1 20 u ol
TbMnO3 is 10.89. The significant differences in θ for H‖ , a b and c 0.6
are due to effects of the crystal fields. u m 15 ol em 0.4 C (emu Fit range (em (m 10 χ /χ K mol−1) θ (K) peff (K) 1 0.2 H a 5 H‖a 13.33(1) +17.6(2) 10.32(1) 100–400 | H‖b 15.15(2) −9.3(5) 11.00(1) 200–400 0.0 0 H‖c 16.75(5) −128(1) 11.57(2) 250–400 0.7 Crystal average 14.78(1) −30.8(1) 10.87(1) 250–400 Polycrystalline 14.38(1) −21.9(1) 10.72(1) 60–400 0.6 (b) 30 25 0.5 ) ) -1 u 0.6 -1 20 0.4 ol (a) crushed crystal crystal average u m 15 ol em 0.3 (m (em 0.2 10 /χ 0.4 χ 1 )-1 ol 0.1 H b | 5 u m 0.0 0 (em 0.2 χ 0.12 (c) 30 0.10 25 ) ) -1 -1 0.08 ol 20 u 0.0 u m 0.06 15 ol em 30 (b) (em 0.04 (m χ 10 /χ 25 1 0.02 H c | 5 )-1 20 u 0 0 0 100 200 300 400 ol em 15 T (K) (m /χ 10
Figure 2. Magnetic dc susceptibility and inverse susceptibility as a 1
function of temperature for TbMnO3, along the ( ) a a a xis, ( ) b a b xis
and (c) c axis. Measurements were made in an applied magnetic 5 field of 5kOe. 00 100 200 300 400
c axis respectively). An effective moment of 10.72(1) was T (K)
measured for the polycrystalline sample, in good agreement
with the theoretical value and the value of 10.95 reported
Figure 3. (a) Magnetic dc susceptibility and ( ) b inverse
previously [27]. The inverse susceptibility data is linear from
susceptibility versus temperature for polycrystalline TbMnO3 and
60K upwards, a temperature which is much closer to TN1 than an average of the data along the , a a
b nd c axes. Measurements
for the single crystal data. The value for θ was calculated as
were made in an applied magnetic field of 5kOe.
−21.9K for the polycrystalline sample. The crystal average of
the susceptibility data gives similar results to the polycrystal-
has suggested that TbMnO3 has a crystal-field excitation at
line data. The CW analysis of this data gave p
around 4.50meV (52.2K) but there is no detailed crystal-field eff = 10.87(1),
which is very close to the theoretical value of 10.89 calculated
scheme published for this material [28, ] 29 . In the absence of
above. Fitting the crystal average data over the temperature
such information it is not practical to calculate how the CF
range 60–400K does not significantly affect the results of the effects will modify the magnetic susceptibility of TbMnO3.
analysis, with θ=−31.7(1)K and peff=10.88(1) in this case.
The magnetic susceptibility data indicate that immediately 3.2. Heat capacity
above TN1, a combination of crystal-field effects and per-
haps short-range order between the Mn moments modify the
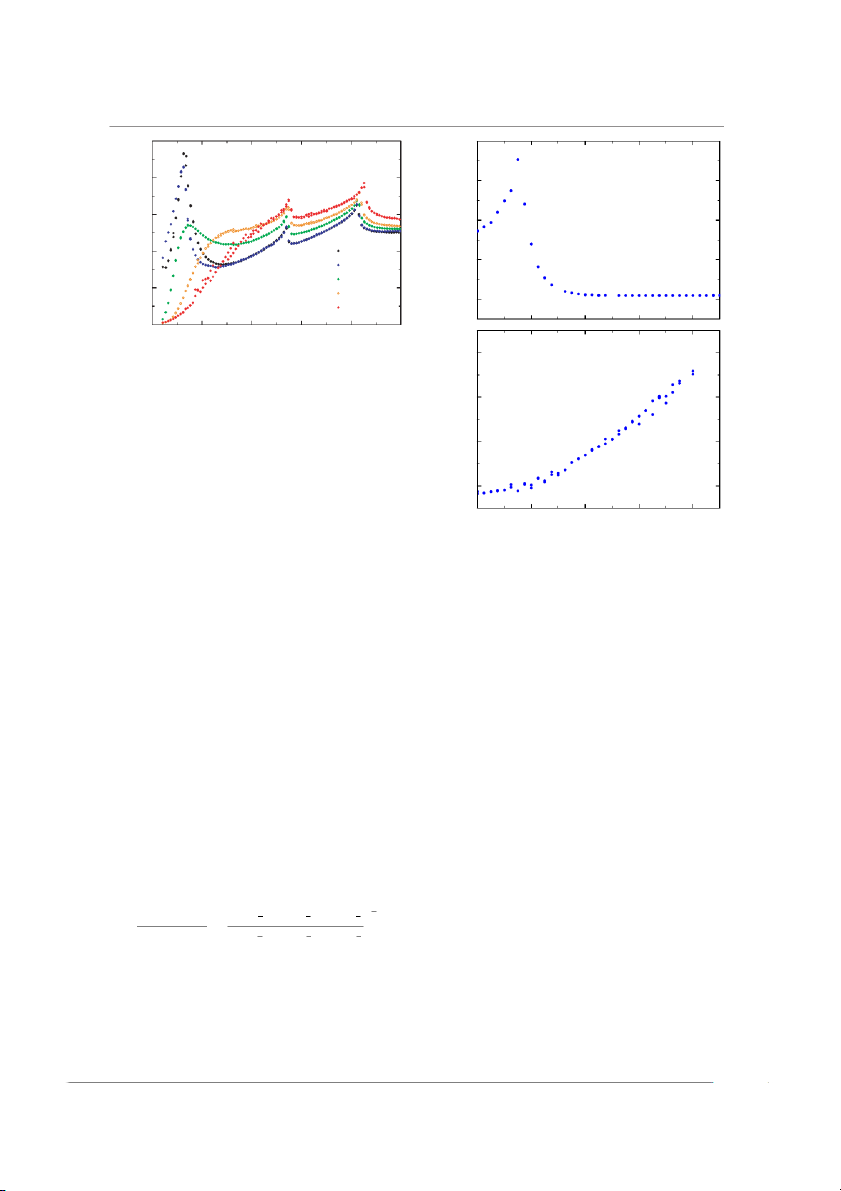
The temperature dependence of the heat capacity for
magnetic response and that a CW behaviour is only seen at
TbMnO3 in different applied magnetic fields is shown
temperature in excess of 200K. Inelastic neutron scattering
in figure 4. For practical reasons, the magnetic field was 3
J. Phys.: Condens. Matter 26 (2014) 256002 D O’Flynnet al 1.0 0.8 (a) 0.8 0.6 ) )-2 -2 K K-1 -1 0.6 ol ol 0.4 (J m (J m T T 0.4 0 kOe / / 0.2 10 kOe C C 30 kOe 3 K 0.2 50 kOe 0.0 90 kOe 0.0 0 10 20 30 40 50 T (K) 0.56 (b)
Figure 4. Specific heat capacity divided by temperature versus
temperature for a single crystal of TbMnO3, with magnetic fields ) applied along the a a xis. -2 0.55 K-1
applied along the a axis. This is the magnetic ‘easy’ axis for ol
TbMnO3 [16, 19], and therefore reduced the risk of damage (J m 0.54
to the delicate PPMS heat capacity sample stage from any T /
magnetic torque on the crystal. As previously reported, there C
are three distinct peaks in the zero-field specific heat, cor- 0.53 60 K
responding to the magnetic transitions at TN1, TN2 and TN3
[2]. For successively higher applied magnetic fields, there 0 40 60 80
is a gradual smearing out of the low-temperature peak cor- 20 H
responding to the ordering of the Tb3+ moments until it has (kOe)
nearly completely disappeared at 90kOe (the highest field Figure 5. Specific heat divided by temperature versus magnetic field
the PPMS is capable of achieving). This implies that a mag- along the
a axis for a single crystal of TbMnO3, at (a) 3K and ( ) b 60K.
netic field of 90kOe is sufficient to force the Tb3+ moments
into the saturated paramagnetic state. A measurement of the
0.975 was applied to the LaGaO3 temperature values. It can
heat capacity versus applied magnetic field at 3K (figure 5(a)) be seen that there is a non-zero value for the magnetic spe-
shows a peak at ∼20kOe. This behaviour is reflected by the cific heat—and therefore magnetic entropy—up to 200 K,
metamagnetic transition seen in TbMnO 3 with a similar mag-
over 160 K higher than the magnetic ordering temperature
netic field applied along the a axis [19]. Another change in the TN1 =41 K. This suggests that short-ranged magnetic cor-
heat capacity due to an applied magnetic field is the shift of relations persist in TbMnO3 at temperatures well above TN1.
the Mn3+ ordering peak at TN1 towards higher temperature. The magnetic contribution to the heat capacity, Cmag (T ) / T
This behaviour was also reported in the phase diagram of
was integrated with respect to temperature to determine
TbMnO3, from measurements of the dielectric constant [19]. the magnetic entropy, Smag. For this calculation a point was
The heat capacity is still weakly field dependent at 60K, i.e. added to the data before integration at zero temperature and
in the paramagnetic state (figure 5(b)).
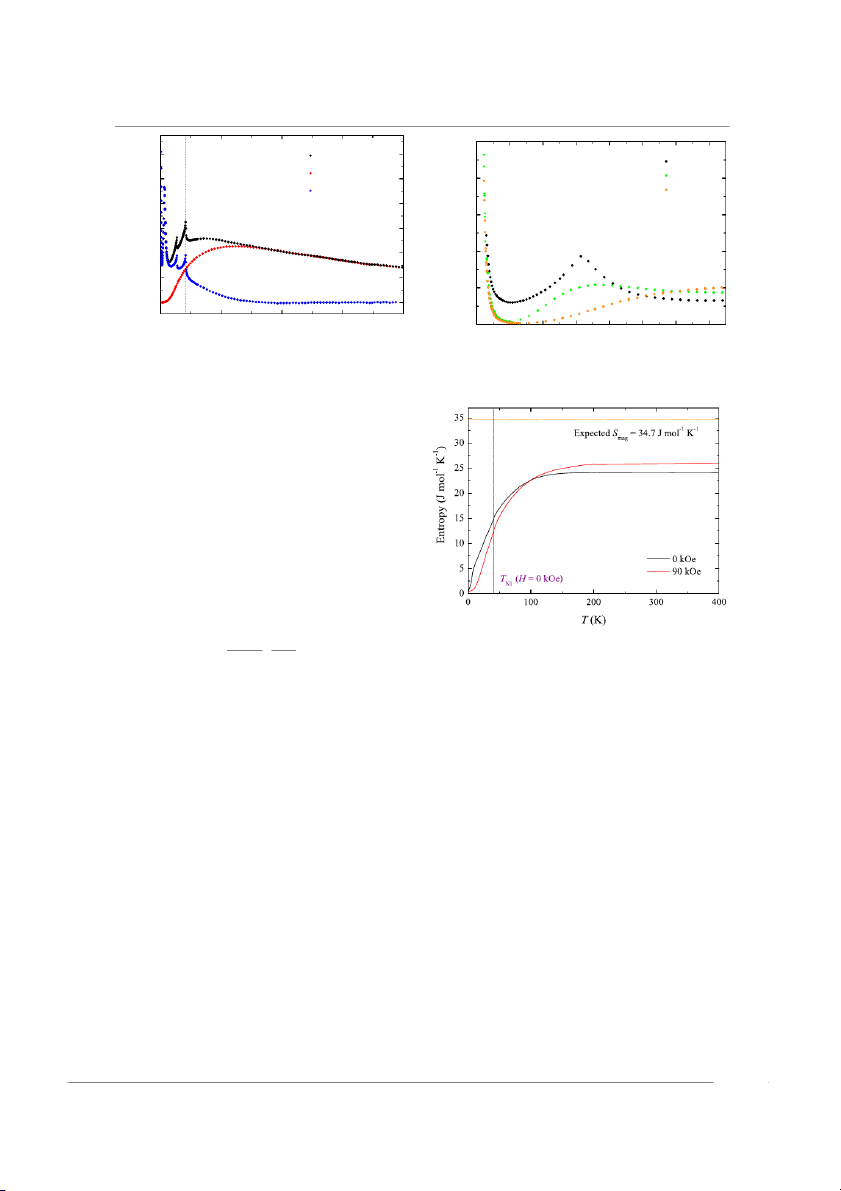
zero heat capacity. The measured magnetic entropy reached
In order to determine the magnetic contribution to the
a saturation at ∼23.4 J mol−1 K−1, well below the theoret-
heat capacity of TbMnO3, the heat capacity of the non-mag-
ical maximum entropy of 34.7 J mol−1 K−1 calculated for
netic isostructural material LaGaO3 was measured as a func- TbMnO3 using
tion of temperature to estimate the lattice contribution to the
Smag(TbMnO3) = Rln( J 2
3 + + 1 ) + Rln ( 2S 3 + + 1 ) .
heat capacity. The results of these measurements are shown Tb Mn (2) in figure 6. Since the LaGaO
To confirm that this discrepancy was not due to a large 3 and TbMnO3 compounds have
different molecular masses, the temperatures for the LaGaO
amount of magnetic entropy below 2K, the heat capacity was 3
data were normalized by multiplying by the ratio of the
measured down to 0.6K using a He-3 PPMS sample insert
effective Debye temperatures of the two compounds, using
(figure 7). A rapid increase in C(T)/T is seen below 2K, which
the method adopted by Bouvier et al [30]. with
appears to be the tail of a peak located below the temperature
range of the measurement. The entropy associated with this 1 ⎡ 3 3 3 ⎤ Θ 3
low-temperature feature amounts to at least 0.7Jmol−1 K−1 D ( TbMnO3 )
(MLa)2 + (MGa)2 +3(MO)2 = ⎢ ⎥ , (1)
in zero field. Again, a point was added to the data at zero Θ 3 3 3 D ( LaGaO3)
⎣⎢ (MTb)2 + (MMn)2 + 3(MO )2 ⎦⎥
temperature and zero heat capacity before integration. When where Θ
this contribution is considered, the entropy in zero field satu-
D is the Debye temperature and M is the atomic
mass of each of the constituent atoms. A correction factor of
rates at ∼24.1 J mol−1 K−1(figure 8). A similar temperature 4
J. Phys.: Condens. Matter 26 (2014) 256002 D O’Flynnet al 2.5 1.2 TbMnO3 0 kOe LaGaO 1.0 3 ) 2.0 30 kOe -2 C (TbMnO ) 50 kOe mag 3 K 0.8 ) -1 -2 ol K 1.5 0.6 -1 ol (J m T 1.0 / 0.4 (J m C T 0.2 / C 0.5 T 0.0 N1 0 100 200 300 400 0.0 T (K) 0 2 4 6 8 10 12 14 T (K)
Figure 6. Specific heat divided by temperature versus
temperature in zero applied magnetic field for a single crystal
Figure 7. Low-temperature C/T versus T for a single crystal of
of TbMnO3, a polycrystalline sample of the non-magnetic
TbMnO3, with magnetic fields applied along the a a xis.
isostructural LaGaO3 and the magnetic specific heat, calculated as Cmag(TbMnO3 = ) C ( TbMnO3 − ) C( LaGa 3) O .
dependence for Smag(T) is seen in a field of 90 kOe with
Smag(T) still saturating well below the theoretical maximum entropy.
This low-temperature peak in C/T(T) may be the result of
a reorientation of the Tb moments at T<TN3 as reported in
TbFeO3 and TbCrO3 [31]. Low-temperature studies using a
probe such as neutron scattering are required to verify this
possibility. The weak magnetic field dependence of this fea-
ture suggests it may be a Schottky peak. Such a peak can
arise from a hyperfine contribution to the heat capacity and is
expected to scale as A/T 2 at temperatures above the Schottky
anomaly, with the coefficient A being related to the hyperfine field, Hhf by μ2 μ 2 R I N ⎛I + 1 ⎞ A
Figure 8. Magnetic entropy versus temperature for TbMnO3 in ⎜ ⎟ = H2 hf , (3) 3k2 ⎝
magnetic fields of 0 and 90kOe applied along the a axis. The B I ⎠
horizontal dotted line shows the expected maximum entropy,
where I and μI are the nuclear spin quantum number and the calculated from equation ( ) 2 .
nuclear magnetic moment of the ion respectively, R is the
molar gas constant (8.314Jmol−1K−1) and μN is the nuclear We also note that in some other Tb based materials, for
magneton [32, 33]. Fitting to the zero-field low-temperature example TbFe2, the magnetic exchange field significantly
heat capacity data gave a value for A of 0.2027(7)JKmol−1.
modifies the CF energy level diagram leading to a large reduc-
For Tb, I =3/2 and μI =1.5 [33]. Putting these values into tion in the contribution to the magnetic entropy at lower tem-
equation (3) gives Hhf = 3820 kOe. If instead the hyper- peratures [39]. For TbFe , 2 only 0.6 R 2 ln(2J + + 1) Tb3 is seen by
fine contribution is assumed to be due to the Mn ions (with 300K. The ordering temperature in TbMnO3 is significantly
I = 5/2 and μI = 3.461), the hyperfine field is calculated as lower but similar effects may still modify the CF scheme.
1810 kOe. These fields are about an order of magnitude Assuming there is a full contribution to the magnetic entropy
larger than the values quoted in the literature for Mn ions in
from the Mn moments, we only observe 0.4 R 7 ln(2J + + 1) Tb3
either La1−xSrxMnO3 or Sr doped Pr0.6Ca0. M 4 nO 3 manganite
up to 300K. However, a detailed knowledge of the CF levels
[34, 35]. The large hyperfine fields are more likely to be due to in TbMnO3 is required in order to build a more quantitative
electrons in the well screened unfilled 4f shell of the Tb ions model of the contributions to Cmag(T) from hyperfine and
being in reasonable agreement with the values of 3120(20) CFeffects.
and 3205(5)kOe previously reported for Tb in Tb2Fe17Cx and
It is proposed that the main reasons why the measured TbAl2 respectively [36, 37].
magnetic entropy appears lower than expected are CF effects
Alternatively, this Schottky anomaly may result from the CF
which modify the magnetic contribution to the heat capacity
levels of the Tb ions. For example, in Tb(OH) 3 the low-temper-
of the Tb moments, short-range correlations between the Mn
ature heat capacity contains a feature that is attributed to low
moments persisting well into the paramagnetic state above TN1
lying crystal-field levels and hyperfine field contributions [38]. and perhaps an overestimate in the lattice contribution to the 5
J. Phys.: Condens. Matter 26 (2014) 256002 D O’Flynnet al
specific heat. This suggestion is consistent with the deviations [11] Prokhnenko O, Aliouane N, Feyerherm R, Dudzik E,
from CW behaviour seen in the magnetic susceptibility data.
Wolter A U B, Maljuk A, Kiefer K and Argyriou D N 2010 Phys. Rev. B 81 024419
[12] Rovillain P, Cazayous M, Gallais Y, Sacuto A, Measson M A 4. Conclusions
and Sakata H 2010 Phys. Rev. B 81 054428
[13] Jang H et al 2011 Phys. Rev. Lett. 106 047203
[14] Kenzelmann M, Harris A B, Jonas S, Broholm C, Schefer J,
The magnetic behaviour of TbMnO3 is highly anisotropic.
Kim S B, Zhang C L, Cheong S W, Vajk O P and Lynn J W
The magnitude of the magnetic susceptibility in the paramag- 2005 Phys. Rev. Lett. 95 087206
netic state suggests that the Tb3+ moments are constrained to
[15] Katsura H, Nagaosa N and Balatsky A V 2005 Phys. Rev. Lett. lie preferentially along the
a axis. The deviations from CW 95 057205
behaviour observed below 200K and the heat capacity show
[16] Quezel S, Tcheou F, Rossat-Mignod J, Quezel G and
RoudautE 1977 Physica B + C 86 8 – – 916 8
that CF effects and short-range correlations modify the mag-
[17] Kajimoto R, Yoshizawa H, Shintani H, Kimura T and Tokura Y
netic response above TN1. Although TbMnO 3 is one of the 2004 Phys. Rev. B 70 012401
most widely studied multiferroic compounds, there is little
[18] Wilkins S B et al 2009 Phys. Rev. Lett. 103 207602
discussion about the role of crystal-field effects in the magne-
[19] Kimura T, Lawes G, Goto T, Tokura Y and Ramirez A P 2005
toelectric coupling exhibited by this material. Clear evidence Phys. Rev. B 71 224425
[20] Aliouane N, Schmalzl K, Senff D, Maljuk A, Prokeš K,
for magnetic ordering of the Mn moments below TN1 is only
Braden M and Argyriou D N 2009 Phys. Rev. Lett.
seen for H‖c. This is the same crystallographic direction along 102207205
which the spontaneous electric polarization develops below
[21] Jin J L, Zhang X Q, Li G K, Cheng Z H, Zheng L and Lu Y T 2011 Phys. Rev. B 83 184431
N1. Heat capacity measurements in an applied magnetic field
confirm the proposal that the magnetization saturation seen [22] Cuartero V, Blasco J, Rodríguez -Velamazán J A, García J,
Subías G, Ritter C, Stankiewicz J and Canadillas-Delgado L for H‖ i
a s due to the Tb moments [ ] 19 . 2012 Phys. Rev. B 86 104413
[23] Cui Y, Wang C and Cao B 2005 Solid State Commun. 133 – 641 5 Acknowledgments
[24] Pavan Kumar N, Lalitha G and Venugopal Reddy P 2011 Phys. Scr. 83 045701
This work was supported by the Engineering and Physical
[25] Ivanov V Yu, Mukhin A, Prokhorov A, Balbashov A and
Sciences Research Council (EPSRC), UK (EP/I007210/1).
Iskhakova L 2010 JETP Lett. 91 – 392 7
Some of the equipment used in this research was obtained
[26] Golosovsky I V, Mukhin A A, Ivanov V Yu, Vakhrushev S B,
through the Science City Advanced Materials project:
Golovenchits E I, Sanina V A, Hoffmann J -U, Feyerherm R
and Dudzik E 2012 Eur. Phys. J. B 85 – 1 6
Creating and Characterizing Next Generation Advanced
[27] Blasco J, Ritter C, García J , de Teresa J M, Pérez-Cacho J and
Materials project, with support from Advantage West
Ibarra M R 2000 Phys. Rev. B 62 5609
Midlands (AWM) and part funded by the European Regional
[28] Senff D, Link P, Hradil K, Hiess A, Regnault L P, Sidis Y,
Development Fund (ERDF). We wish to thank T E Orton for
Aliouane N, Argyriou D N and Braden M 2007 Phys. Rev. 98 technical support. Lett. 137206
[29] Kajimoto R, Mochizuki H, Yoshizawa H, Shintani H, KimuraT
and Tokura Y 2005 J. Phys. Soc. Japan 74 2430–3 References
[30] Bouvier M, Lethuillier P and Schmitt D 1991 Phys. Rev. B 43 13137
[31] Mareschal J, Sivardière J, De Vries G F and Bertaut E F 1968
[1] Wang J et al 2003 Science 299 1719 J. Appl. Phys. 39 1364
[2] Kimura T, Goto T, Shintani H, Ishizaka K, Arima T and
[32] Tari A 2003 The Specifc Heat of Matter at Low Temperatures Tokura Y 2003 Nature 426 55
(London: Imperial College Press)
[3] Hur N, Park S, Sharma P A, Ahn J S, Guha S and Cheong S W
[33] Kopfermann H 1958 Nuclear Moments (New York: Academic) 2004 Nature 429 392
[34] Woodfield B F, Wilson M L and Byers J M 1997 Phys. Rev.
[4] Ramesh R and Spaldin N A 2007 Nature Mater. 6 21 Lett. 78 – 3201 4
[5] Zavaliche F et al 2005 Nano Lett. 5 1793
[35] Lees M R, Petrenko O A, Balakrishnan G and Paul D M 1999
[6] Vopsaroiu M, Blackburn J and Cain M G 2007 J. Phys. D: Phys. Rev. B 59 – 1298 303 Appl. Phys. 40 5027
[36] Li Y, Graham R G, Ross J W, McCausland M A H,
[7] Zhang Y, Li Z, Deng C, Ma J, Lin Y and Nan C W 2008 Appl.
Bunbury D S P, Cao L, Kong L S and Shen B G 1996 Phys. Lett. 92 152510
J.Phys. Condens. Matter 8 1059
[8] Xiang H J, Wei S H, Whangbo M H and Da Silva J L F 2008
[37] Vijayaraghavan R, Shimizu K, Itoh J, Grover A K and Phys. Rev. Lett. 101 037209
Gupta LC 1977 J. Phys. Soc. Japan 43 – 1854 6
[9] Malashevich A and Vanderbilt D 2008 Phys. Rev. Lett.
[38] Catanese C A, Skjeltorp A T, Meissner H E and Wolf W P 101037210 1973 Phys. Rev. B 8 – 4223 46
[10] Shuvaev A M, Travkin V D, Ivanov V Y, Mukhin A A and
[39] Germano D J and Butera R A 1981 Phys. Rev. B
Pimenov A 2010 Phys. Rev. Lett. 104 097202 24 – 3912 27 6
Tài liệu liên quan:
-
Ôn tập Khoa học dữ liệu | Trường Đại học Văn Lang
34 17 -
Tài liệu khoa học dữ liệu- Trường đại học Văn Lang
242 121 -
40 câu trắc nghiệm Nguyên hàm kế toán-trường đại học Văn Lang
433 217 -
72 câu trắc nghiệm Thanh toán quốc tế- Trường đại học Văn Lang
542 271 -
159 câu ôn tập Động cơ đốt trong-Trường đại học Văn Lang
399 200