Tổng hợp Chương 1 - 8 môn Vĩ mô | Trường Đại học Duy Tân
Macroeconomics studies long-run economic growth and short-run economic fluctuation. Tài liệu được sưu tầm gồm 37 trang, giúp các bạn ôn luyện và phục vụ cho việc học tập, đạt kết quả tốt. Mời các bạn đón xem!
Môn: Vĩ mô 10 tài liệu
Trường: Đại học Duy Tân 2 K tài liệu
Tác giả:


Preview text:
Chapter 1 I. True/False 1.
Macroeconomics studies long-run economic growth and short-run economic fluctuationT 2.
Real GDP totals the dollar value of all goods and services within the borders of a given
country using their current prices during the year they were produced F 3.
An example of a macroeconomic policy question would be “Can governments promote long-run economic growth?T 4.
Modern economic growth means that output rises at about the same rate as the populationF 5.
An example of economic investment, as economists use the term, would be the purchase
of a corporate stock or bond.T 6.
Economies are exposed to both demand shocks and supply shocksT 7.
A positive demand shock refers to a situation where demand turns out to be lower than expected F higher 8.
In a market system, the government owns most of the property resources( land and capital) F 9.
If two goods are complementary, an increase in the price of one will tend to increase the
demand for the other. F decrease demand of both goods II. Multiple choice 1.
Short-run fluctuations in output and employment are often referred to as A. Recession B. Inflation C. The business cycle D. Modern economic growth 2.
Economic growth in an economy is best measured from one year to the next by comparing the change in A. The rate of inflation B. The rate of unemployment C. Nominal GDP D. Real GDP 3.
Unemployment is undesirable because it A. Increases inflation B.
Wastes labor resources. C. Contributes to sticky prices D.
Raises interest rates in the economy 4.
A major problem with inflation is that it A. Lowers housing prices B. Increase the rate of savings C.
Reduces purchasing power D. Decrease government spending 5.
What account for the vast difference in the living standards today between rich and poor countries? A. Purchasing power parity B. rising rates of inflation C. Increase in nominal GDP D. Modern economic growth 6.
Macroeconomic behavior is most significantly influenced by A. Purchasing power parity B.
Expectations about the future C.
The price of agricultural land D.
Employment in the construction industry 7.
Economic forecasters had expected consumer spending to increase by 5 percent this year,
but instead it increased by 0.5 percent. This situation would be an example of a A. Positive supply shock B. Negative supply shock C. Positive demand shock D.
Negative demand shock III. Problems 1.
Assume that in Year 1 an economy produces _500 units__of output that sell for 10$___a
unit, on average. In year 2, the economy produces the same _500 units__ of output, but sells
them for _11$__a unit, on average. a.
What is nominal GDP in Year ___
What is nominal GDP in year 2?____. Nominal GDP increased from Year 1 to Year 2 because
(prices, output) _____increased. b.
Use Year 1 prices to calculate real GDP in year 1 and year 2. What is real GDP in Year 1? ______
What is real GDP in Year 2?_____. Real GDP did not increase from Year 1 to Year 2 because
(price, ouput) _____did not change. Chapter 2 I. True/False 1.
National income acounting allows us to assess the performance of the economy and make
polices to improve that performance . T 2.
Gross domestic product measures at their market value the total output of all goods and
services produced in the economy during a year F 3.
GDP is a count of the physical quantity of output and is not a monetary measure. F 4.
Final goods are consumption goods, capital goods, and service that are purchased by their
end user rather than being ones used for further processing or manufacturing T 5.
GDP includes excludes the sale of intermediate goods and excludes includes the sales of final goods. F 6.
The total value added to a product and the value of final product are equal. T 7.
Social security payments and other public transfer payments are (not) counted as part of GDP F 8.
The sale of stocks and bonds is excluded from GDP. T 9.
In computing gross domestic product, private transfer payments are excluded because
they do not represent payment for currently produced goods and services. T 10.
The two approaches to the measurement of the gross domestic product yield identical
result because one approaches measures the total amount spent on the products produced
by business firms during a year while the second approaches measures the total income
of business firms during the year. F 11.
Personal consumption expenditure only include expenditure for durable and nondurable goods. F services 12.
The expenditure made by a household to have a new home built is a personal
consumption expenditure F Gross private domestic investment 13.
In national income accounting, any increase in the inventories of business firm is
included in gross private domestic investment T 14.
Government purchase include spending by all units of government on the finished
products of business, but exclude all direct purchase of resources such as labor F exclude transfer payment 15.
The net exports of an economy equal its exports of goods and services less its import of goods and services T 16.
The income approach to GDP includes compensation of employees, rents, interest
income, proprietor’s income, corporate profit, and taxes on production and imports. F 17.
A GDP that has been deflated or inflated to reflect changes in the price level is called real GDP T 18.
To adjust nominal GDP for a given year to obtain real GDP. It is necessary to multiply
nominal GDP by the price index (expressed in hundredths) for that year. F divide 19.
If nominal GDP for an economy is $ 11.000 billion and the price index is 110, then real GDP is $10.000 billion T 20.
. GDP is a precise measure of the economic well-being of society F income and output 21.
The productive services of a homemaker are included in GDP F nonmarket transaction II. Multiple choice 1.
Which is a primary use for national income accounting? A.
It provides a basis for assessing the performance of the economy. B.
It measures economic efficiency in specific industries C.
It estimates expenditure on nonproduction transaction D.
It analyzes the cost of pollution to the economy 2.
Gross domestic product (GDP) is defined as A.
Personal consumption expenditure and gross private domestic investment B.
the sum of wage and salary compensation of employees, corporate profits, and interest income C.
The market value of final goods and services produced within a country in 1 year. D.
The market value of all final and intermediate goods and services produced by the economy in 1 year 3.
To include the value of the parts used in producing the automobiles turned out during a
year in gross domestic product for that year would be an example of A.
Including a nonmarket transaction B.
including a nonproduction transaction C.
Including a noninvestment transaction D. Multiple counting 4.
Which of the following is a public transfer payment? A.
The social security benefit sent to a retired worker B.
The sale of shares of stock in Microsoft Corporation C.
The sale of a used (secondhand) toy house at a garage sale D.
The birthday gift of a check for $50 sent by a grandmother to her grandchild. 5.
The sale in year 2 of an automobile produced in year 1 would not be include in the
gross domestic product for year 2; doing so would involved A. Including a nonmarket transaction B.
Including a nonproduction transaction C.
Including a noninvestment transaction D. Public transfer payments 6.
The service a babysitter performs when she stays at home with her baby brother while her
parents are out and for which she receives no payment is not included in the gross domestic product because A.
This is a nonmarket transaction B.
This is a nonproduction transaction C.
This is noninvestment transaction D.
Multiple counting would be involved 7.
According to national income accounting, money income derived from the production of
this year’s output is equal to A.
Corporate profits and the consumption of fixed capital B.
The amount spent to purchase this year’s total output C.
The sum of interest income and the compensation of employees D.
Gross private domestic investment less the consumption of fixed capital 8.
Which would be considered an investment according to economist? A.
The purchase of newly issued shares of stock in Microsoft B.
The construction of a new computer chip factory by intel C.
The resale of stock originally issued by the general electric corporation D.
The sale of a retail department store building by Sears to JCPenney 9.
A refrigerator was produced by its manufacturer in year 1, sold to a retailer in year 1, and
sold by the retailer to a final consumer in year 2. The refrigerator was A.
Counted as consumption in year 1 B. Counted as savings in year 1 C.
Counted as investment in year 1 D.
Not included in the gross domestic product of year 1 10.
The annual charge that estimates the amount of private capital equipment used up in each year’s production is called A. Investment B. Depreciation C. Value added D. Multiple counting 11.
GDP in an economy is $3452 billion. Consumer expenditure are $2343 billion,
government purchases are $865 billion, and gross investment is $379 billion. Net exports are A. + $93 billion B. + $123 billion C. - $45 billion D. -$135 billion
Question 12 through 18 use the national income accounting data given in the following table
Billions of dollars Net private domestic investment $32 Personal taxes 39 Transfer payments 19
Taxes on production and imports 8 Corporate income taxes 11
Personal consumption expenditures 217 Consumption of fixed capital 7 U.S. exports 15 Dividends 15 Government purchases 51 Net foreign factor income 0
Undistributed corporate profits 10 Social Security contributions 4 U.S. imports 17 Statistical discrepancy 0 12.
Gross private domestic investment is equal to A. $32 billion B. $39 billion C. $45 billion D. $56 billion 13. Net export are equal to A. -$2 billion B. $2 billion C. -$32 billion D. $32 billion 14.
The gross domestic product is equal to A. $298 billion B. $302 billion C. $317 billion D. $ 305 billion 15.
The net domestic product is equal to A. $298 billion B. $302 billion C. $317 billion D. $321 billion 16. National income is equal to A. $ 245 billion B. $ 278 billion C. $ 298 billion D. $ 310 billion 17. Personal income is equal to A. $ 266 billion B. $ 284 billion C. $ 290 billion D. $ 315 billion 18. Disposable income is equal to A. 245 billion B. 284 billion C. 305 billion D. 321 billion 19.
Suppose nominal GDP rose from $500 billion to $600 billion while the GDP price index
increase from 125 to 150. Real GDP A. Was constant B. Increased C. Decreased D.
Cannot be calculated from these figures 20.
In an economy, the total expenditure for a market basket of goods in year 1 (the base
year) was $4000 billion. In year 2, the total expenditure for the same market basket of goods was
$4500 billion. What was the GDP price index for the economy in year 2? A. 0.88 B. 1.13 C. 188 D. 113 21.
Nominal GDP is less than real GDP in an economy in year 1. In year 2, nominal GDP is
equal to real GDP. In year 3, nominal GDP is slightly greater than real GDP. In year 4, nominal
GDP is significantly greater than real GDP. Which year is most likely to be the base year that is
being used to calculate the price index for this economy A. 1 B. 2. C. 3 D. 4 22.
Nominal GDP was $3774 billion in year 1 and the GDP deflator was 108 and nominal
GDP was 3989 in year 2 and the GDP deflator that year was 112. What was real GDP in years 1 and 2, respectively? A.
$3494 billion and $3562 billion. B.
$3339 billion and $3695 billion C. $3595 billion and $3725 billion D.
$3643 billion and $4069 billion 23.
A price index one year was 145, and the next year it was 167. What is approximate
percentage change in the price level from one year to the next as measured by that index? A. 12% B. 13% C. 14% D. 15% III. Problem
1. Following are national income accounting figures Exports $367 Dividends 60
Consumption of fixed capital 307 Corporate profits 203
Compensation of employees 1,722 Government purchases 577 Rents 33
Taxes on production and imports 255
Gross private domestic investment 437 Corporate income taxes 88 Transfer payments 320 Interest 201 Proprietors’ income 132
Personal consumption expenditures 1,810 Imports 338
Social Security contributions 148
Undistributed corporate profits 55 Personal taxes 372 Net foreign factor income 0 Statistical discrepancy 0
Expenditure Approach Item Amount
_______________________ $________________
_______________________ $________________
_______________________ $________________
_______________________ $________________
Income Approach Item Amount
_______________________ $________________
_______________________ $________________
_______________________ $________________
_______________________ $________________
_______________________ $________________
_______________________ $________________
_______________________ $________________
_______________________ $________________ - CHAPTER 3
I. TRUE-FALSE QUESTIONS:
Circle T if the statement is true, F if it is false 1.
Economic growth is measured as either an increase in real GDP or an increase in real GDP percapita. T 2.
Real GDP is the best measure of economic growth for comparing standards of living amongnations. F per capital 3.
Suppose two economies both have GDPs of $ 500 billion. If the GDPs grow at annual
rates of3% in the first economy and 5% in the second economy, the difference in their amounts of
growth in one year is $ 10 billion. T
7. Poorer follower countries can never catch up with and or surpass the living standards of rich
leader countries. F can catch up
9. Changes in the physical and technical agents of production are supply factors for
economicgrowth that enable an economy to expand its potential GDP. T
10. The demand factor in economic growth refers to the ability of the economy to expand its
production as the demand for products grows. T
11. An increase in the quantity and quality of natural resources is an efficiency factor for economic growth. F supply factor
12. A shift outward in the production possibilities curve is the direct result of improvements in
supply factors for economic growth. T
13. The real GDP of an economy in any year is equal to its input of labor divided by the productivity of labor. F multiplied
14. The hours of labor input depend on the size of the employed labor force and the length of the average workweek. T
17. One determinant of labor productivity is the quantity of capital goods available to workers. T
18. Public investment in the form of new infrastructure often complements private capital investment. T
19. Education and training contribute to a worker’s stock of human capital. T
21.If the rate of growth in labor productivity averages 2.5% a year, it will take about 50 years for
the standard of living to double. F
22. Productivity growth is the basic source of improvements in real wage rates and the standard of living. T
II. MULTIPLE-CHOICE QUESTIONS
Circle the letter that correspond to the best answer.
1. Which of the following is the best measure of ecomoic growth? (a) the supply factor (b) the demand factor
(c) real GDP per capita
(d) nominal GDP per capita
2. If the real output of an economy were to increase from $2000 billion to $2100 billion in 1 year,
the rate of growth of real output during that year would be (a) 1% (b) 5% (c) 10% (d) 50%
5. Which one of the following is true?
(a) Poor follower countries can catch up and even surpass the living standards of rich leader countries.
(b) As a result of modern economic growth, there are no sustained increases in growth over time.
(c) Differences in labor supply make a minimal contribution to differences in living standards.
(d) There is a relatively even distribution of economic growth across nations.
7. A supply factor in economic growth would be
(a) an increase in the efficient use of resources
(b) a decline in the rate of resources depletion
(c) an improvement in the quality of labor
(d) an increase in cosumption spending
8. Which is a demand factor in economic growth?
(a) an increase in the purchasing power of the economy
(b) an increase in the economy’s stock of capital goods
(c) more natural resources
(d) technological progress
Use the following graph to answer questions 9 and 10.
9. If the production possibilities curve of an economy shifts from AB to CD , it is most likely the
result of what factor affecting economic growth? (a) a supply factor (b) a demand factor
(c) an efficiency factor
(d) an allocation factor
10. If the production possibilities curve for an economy is at CD but the economy is operating at
point X, the reasons are most likely (a) supply and environmental factors
(b) demand and efficiency factors
(c) labor inputs and labor productivity
(d) technological progress
11. Total output or real GDP in any year is equal to
(a) labor inputs divided by resource outputs
(b) labor productivity multiplied by real output
(c) worker-hours multiplied by labor productivity
(d) worker-hours divided by labor productivity
12. Assume that an economy has 1000 workers, each working 2000 hours per year. If the
average real output per worker-hour is $9, then total output or real GDP will be
(a) $2 million (b) $9 million (c) $18 million (d) $24 million
16. An example of U.S. public investment in infrastructure would be (a) an airline company
(b) a natural gas pipeline
(c) an auto and truck plant (d) an interstate highway
17. Economists call the knowledge and skills that make a productive worker
(a) the labor-force participation rate (b) learning by doing (c) human capital (d) infrastructure
20. If the annual growth in a nation’s productivity is 2% rather than 1%, then the nation’s
standard of living will double in
(a) 25 years (b) 35 years (c) 50 years (d) 70 years III. PROBLEMS 1.
Given the hypothetical data in the table below, calculate the annual rate of growth in real
GDPand real per capita GDP over the period given. The numbers for real GDP are in billions. Real Annual Real GDP Annual Year GDP growth in % per capita growth in% 1 $2,416 $11,785 2 2,472 2.32% 11,950 1.4_____ 3 2,563 12,213 _____ 4 2,632 12,421 _____ 5 2,724 12,719 _____ 6 2,850 12,948 _____ 2.
Suppose the real GDP and the population of an economy in seven different years were
thoseshown in the following table. Population, Real GDP, Per capita Year Million biilions of dollars real GDP 1 30 $ 9 $300 2 60 24 3 90 45 4 120 66 5 150 90 6 180 99 7 210 105 a.
How large would the real per capita GDP of the economy be in each of the other six
years? Put your figure in the table. b.
What would have been the size of the optimum population of this economy? _______________ c.
What was the amount of growth in real GDP between year 1 and year 2? $ 24-9=15 d.
What was the rate of growth in real GDP between year 3 and year 4? _____________%
3. The table below shows the quantity of labor (measured in hours) and the productivity
of labor (measured in real GDP per hour) in a hypothetical economy in three different years. Quantity Productivity Year of labor of labor Real GDP 1 1000 $100 $_____ 2 1000 105 ___105000___ 3 1100 105 ___115500___ a.
Compute the economy’s real GDP in each of the three years and enter them in the table. b.
Between years 1 and 2, the quantity of labor remained constant, but
(1) the productivity of labor increased by _________%, and (2)
as a consequence, real GDP increased by ___________%. c.
Between years 2 and 3, the productivity of labor remained constant, but
(1) the quantity of labor increased by _________%, and (2)
as a consequence, real GDP increased by _________%. d. Between years 1 and 3
(1) real GDP increased by _________%, and
(2) this rate of increase is approximately equal to the sum of the rates of increase in the
(quantity,productivity) _____ _____ and the ___ ________ of labor.
4. In the table below, indicate how may years it will take to double the standard of living (Years)
in an economy given different annual rates of growth in labor productivity. Years Productivity 1.0% _____ 1.4% _____ 1.8% _____ 2.2% _____ 2.6% _____ 3.0% _____
What can you conclude about the importance of small changes in the growth rate of productivity on the standard of living? CHAPTER 4/ I.TRUE- FALSE QUESTIONS:
Circle T if the statement is true, F if it is false
1. The business cycle is best defined as alternating periods of increases and decreases in the
rateof inflation in the economy.
2. Business cycle tend to be of roughly equal duration and intensity. 5.
The unemployment rate is equal to the number of people in the labor force divided by
thenumber of people who are unemployed. 6.
Discouraged workers, those people who are able to work but quit looking for work
becausethey can not find a job, are counted as unemployed by the U.S. Bureau of Labor Statistics.
10. Cyclical unemployment is caused by a decline in total spending.
16. Inflation is defined as an increase in the total output of an economy.
17. From one year to the next, the Consumer Price Index rose from 154.5 to 160.5. The rate
ofinflation was therefore 6.6%.
18. If the price level increase by 10% each year, the price level will double every 10 years
19. The essence of demand-pull inflation is “too much spending chasing too few goods”.
20. Cost-push inflation explains rising prices in terms of factors that increase per-unitproduction cost.
21. A person’s real income is the amount of goods and services that the person’s nominal
(ormoney) income will enable him or her to purchase. 24. Cost-push inflation reduces real output.
II. MULTIPLE-CHOICE QUESTIONS
1. Which is one of the four phases of a business cycle ? (a) inflation (b) recession (c) unemployment (d) hyperinflation
3. Production and employment would be least affected by a severe recession in which type of industry?
(a) nondurable consumer goods
(b) durable consumer goods (c) capital goods (d) labor goods
4. The unemployment rate in an economy is 8%. The total population of the economy is 250
million, and the size of the civilin labor force is 150 million. The number of employed workers in this economy is (a) 12 million (b) 20 million (c) 138 million (d) 140 million
5. The labor force includes those who are
(a) less than 16 years of age
(b) in mental institutions (c) not seeking work (d) employed
6. The unemployment data collected by the Bureau of Labor Statistics have been criticized because
(a) part-time workers are not counted in the number of workers employed
(b) discouraged workers are not considered a part of the labor force
(c) it covers frictional unemployment, but not cyclical unemployment, which inflates unemployment figures
(d) the underground economy may understate unemployment
7. A worker who loses a job at a petroleum refinery because consumers and business firms switch
from the use of oil to the burning of coal is an example of
(a) frictional unemployment
(b) structural unemployment
(c) cyclical unemployment
(d) disguised unemployment
8. A worker who has quit one job and is taking 2 weeks off before reporting to a new job is an example of
(a) frictional unemployment
(b) structural unemployment
(c) cyclical unemployment
(d) disguised unemployment
15. If the Consumer Price Index was 110 in one year and 117 in the next year, then rate of
inflation from one year to the next was (a) 3.5% (b) 4.7% (c) 6.4% (d) 7.1%
16. The price of a good has doubled in about 14 years. The approximate annual percentage rate
of increase in the price level over this period has been (a) 2% (b) 3% (c) 4% (d) 5%
17. Which contributes to cost-push inflation?
(a) an increase in employment and output (b) an increaes in per-unit production costs
(c) a decrease in resource prices
(d) an increase in unemployment
18. Only two resources, capital and labor, are used in an economy to produce an output of 300
million units. If the total cost of capital resources is $150 million and the total cost of labor
resources is $50 million, then the per-unit production cost in this economy are (a) $0.67 (b) $1.50 (c) $2.00 (d) $3.00
19. If a person’s nominal income increases by 8% while the price level increases by 10%, the person’s real income
(a) increases by 2% (b) increases by 18% (c) decreases by 18% (d) decreases by 2%
20. If the average level of nominal income in a nation is $21.000 and the price index is 154, the
average real income would be about (a) $12.546 (b) $13.636 (c) $15.299 (d) $17.823
22. With no inflation, a bank would be willing to lend a business firm $10 million at an annual
interest rate of 8%. But if the rate of inflation was anticipated to be 6%, the bank would change
the firm an annual interst rate of (a) 2% (b) 6% (c) 8% (d) 14% 23. Cost-push inflation
(a) lowers interest rates
(b) lowers the price level
(c) decreases real output (d) increases real output
25. If an economy has experienced an inflation rate of over 1000% per for several years, this
economic condition would best be described as
(a) a cost-of-living adjustment
(b) cost-push inflation (c) hyperinflation (d) GDP gap III. PROBLEMS
1. The following table gives statistics on the labor force and total employment during year 1 and
year 5. Make the computations necessary to complete the table. (Numbers of persons are in thousands.) Year 1 Year 5 Labor force 84,889 95,453 Employed 80,796 87,524 Unemployed ______ ______ Unemployed rate ______ ______ a.
How is it possible that both employment and unemployment increased?
_______________________________________________________________________ b.
In relative terms, if unemployment increase, employment will decrease. Why?
_______________________________________________________________________ c.
Would you say that year 5 was a year of full employment?
_______________________________________________________________________ d.
Why is the task of maintaining full employment over the years more than just a problem
of finding jobs for those who happen to be unemployment at any given time?
_______________________________________________________________________
3. The following table shows the price index in the economy at the end of four different years. Year Price index Rate of inflation 1 100.00 _____% 2 112.00 ______ 3 123.20 ______ 4 129.36 ______
a. Compute and enter in the table the rate of inflation in years 2,3, and4
b. Employing the rule of 70, how many years would it take for the price level to double at each
of these three inflation rates? ________________________________________________ c.
If nominal income increased by 15% from year 1 to year 2, what was the approximate
percentage change in real income?_____________________________________________ d.
If nominal income increased by 7% from year 2 to year 3, what was the approximate
percentage change in real income?_____________________________________________ e.
If nominal income was $25,000 in year 2, what was real income that year? -
_______________________________________________________________________
f. If nominal income was $25,000 in year 3, what was real income that year? -
_______________________________________________________________________ g.
If the nominal interest rate was 14% to borrow money from year 1 to year 2, what was
the approximate real rate of interest over that period? ________________________________ h.
If the nominal interest rate was 8% to borrow money from year 3 to year 4, what was the
approximate real rate of interest over that period? ________________________________ CHAPTER 5 TRUE/FALSE:
1. Consumption equals disposable income plus saving.
2. the most significant determinant of the level of consumer spending is diposable income.
4. Consumption rises and saving falls when disposable income increase.
6. the break even income is the income level at which business begins to make a profit.
7. The average propensity to save is equal to the level of saving divided by the level of consumption.
8. The marginal propensity to consume is the change in consumption divided by the change in income.
9. The slope of the saving schedule is equal to the average propensity to save. 10.
An increase in wealth will increase the consumption schedule ( shift the consumption curve upward)
13. The real interest rate is the nominal interest rate minus the rate of inflation.
15. An increase in the stock of capital goods on hand will decrease the investment demand.
16. An increase in planned inventories will decrease the investment demand.
17. investment tends to be relatively stable over time.
19. The multiplier is equal to the change in real GDP multiplied by the intial change in spending.
21. The multiplier effect works only in a positive direction in changing GDP.
23. The higher the marginal propensity to consume , the larger the size of the multiplier. II. MULTICHOICE QUESTIONS 1. Saving equals
a. investment plus consumption
b. investment minus consumption
c. disposable income minus consumption
d. disposable income plus consumption
2. As disposable income decrease, ceteris paribus,
a. both consumption and saving increase
b. consumption increase and saving decrease
c. consumption decrease and saving increase
d. both consumption and saving decrease
4. if consumption spending increases from $358 to $367 billion when disposable income
increases from $412 to $427 billion, it can be concluded that the marginal propensity to consume is a. 0.4 b. 0.6 c. 0.8 d. 0.9
5. If disposable income is $375 billion when the average propensity to consume is 0.8, it can be concluded that
a. the marginal propensity to consume is also 0.8
b. the marginal propensity to save is 0.2
c. consumption is $325 billion d. saving is $75 billion
6. As the disposable income of the economy increases a. both the APC and APS rise
b. the APC rises and APS falls
c. the APC falls and APS rises d. both the APC and APS fall
7. the slope of the consumption schedule or line for a given economy is the
a. marginal propensity to consume
b. average propensity to consume
c. marginal propensity to save d. average propensity to save
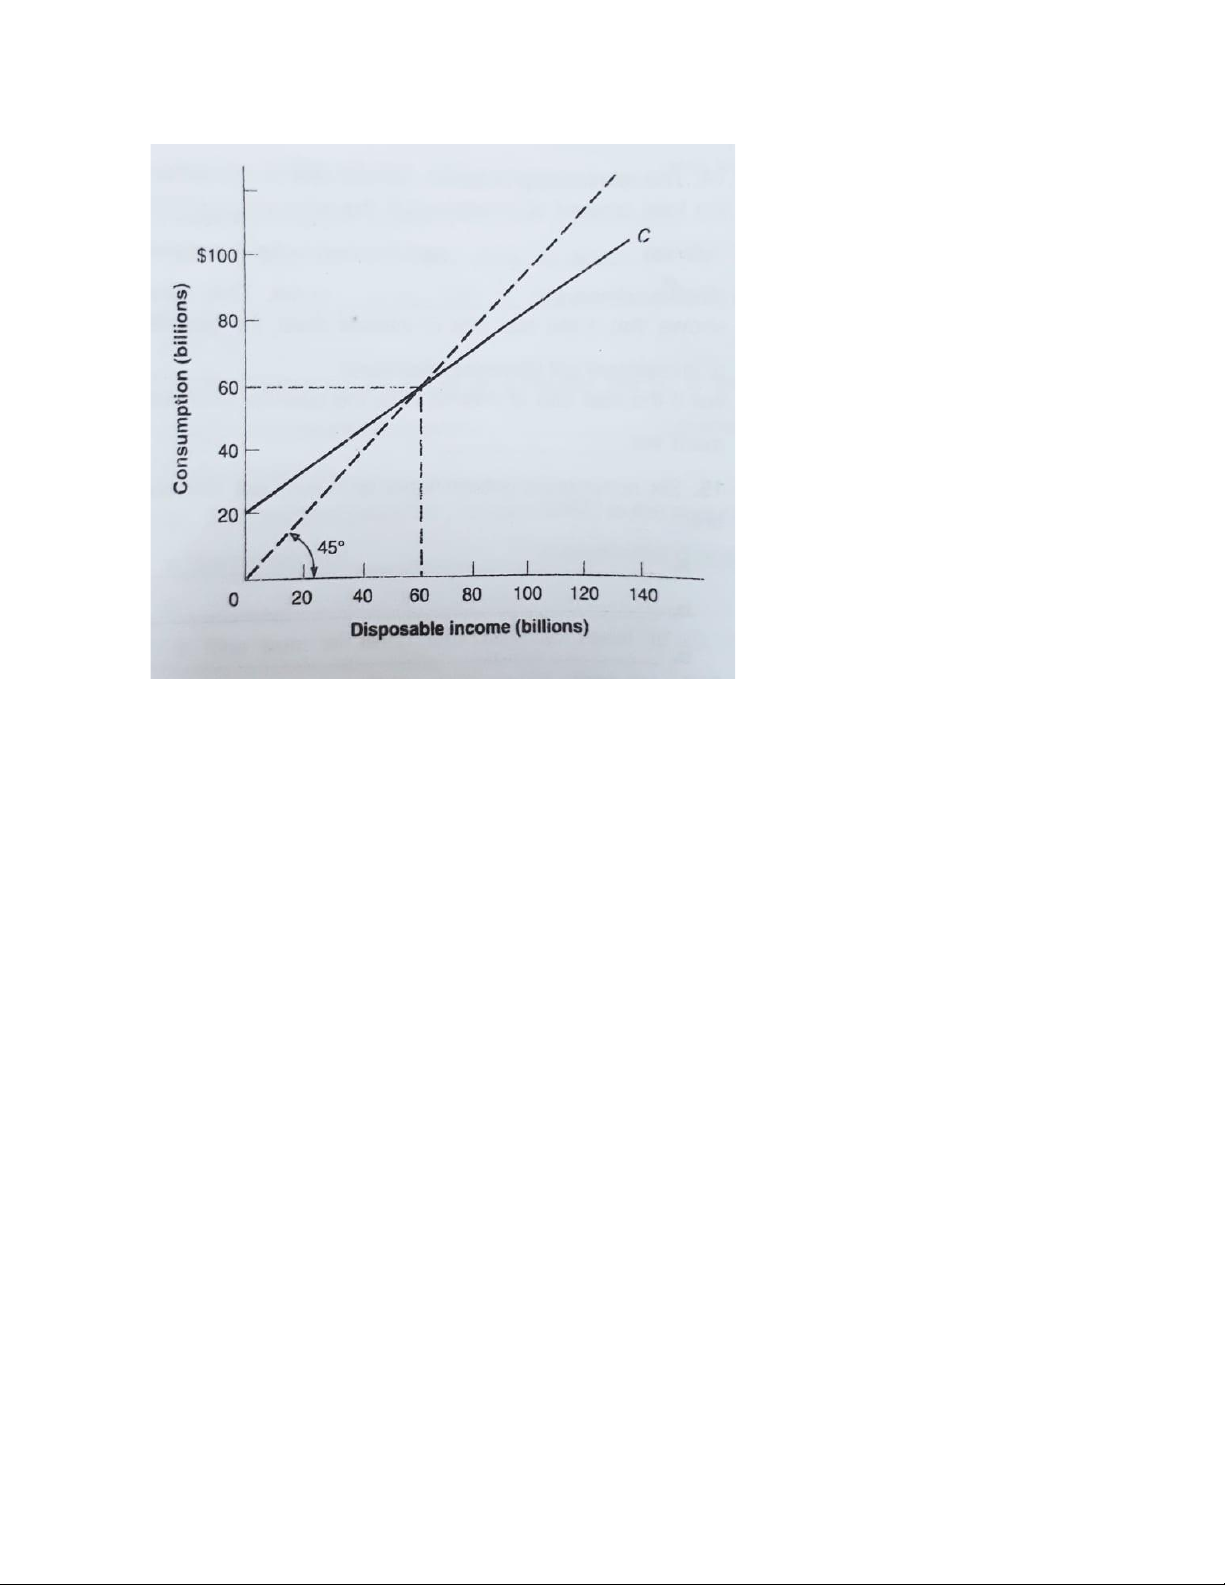
Answer questions 8 and 9 on the basis of the following graph. 8. This graph indicates that
a. consumption decreases after the $60 billion level of disposable income
b. the marginal propensity to consume decreases after the $60 billion level of disposable income
c. consumption decreases as a percentage of disposable income as disposable income increases
d. consumption increases as disposable income decreases
9. If the relevant saving schedule were constructed, one would find that
a. the marginal propensity to save is negative up to the $60 billion level of disposable income
b. the marginal propensity to save increases after the $60 billion level of disposable income
c. saving is zero at the $60 billion level of disposable income
d. saving is $20 billion at the $0 level of disposable income.
Answer Questions 10,11 and 12 on the basis of the following disposable income (DI) and
consumption (C) schedule for a private, closed economy. All figures are in billions of dollars. DI C $0 $4 40 40 80 76 120 112 160 148 200 184
10. If plotted on graph, the slope of the consumption schedule would be a. 0.6 b. 0.7 c. 0.8 d. 0.9
11. At the $160 billion level of disposable income, the average propensity to save is a. 0.015 b. 0.075 c. 0.335 d. 0.925
12. If consumption increases by $5 billion at each level of disposable income, then the
marginal propensity to consume will
a. change, but the average propensity to consume will not change
b. change, but the average propensity to consume will change
c. not change, but the average propensity to consume will change
d. not change, but the average propensity to consume will not change
13. If the slope of a linear saving schedule decreases, then it can be concluded that the a. MPS has decreased b. MPC has decreased c. income has decreased d. income has increased
14. An increase in wealth shifts the consumption schedule
a. downward and the saving schedule upward
b. upward and the saving schedule downward
c. downward and the saving schedule downward
d. upward and the saving schedule upward
15. Expectations of the a recession are likely to lead households to
a. increase consumption and saving
b. decrease consumption and saving.
c. decrease consumption and increase saving
d. increase consumption and decrease saving16. Higher real interest rate are likely to
a. increase consumption and saving
b. decrease consumption and saving
c. decrease consumption and increase saving
d. increase consumption and decrease saving
18. which relationship is an inverse one?
a. consumption and disposable income
b. investment spending and the rate of interest
Tài liệu liên quan:
-

Questions & concepts in macroeconomics review | Trường Đại học Duy Tân
173 87 -

Short answer guide for AD-AS & monetary policy môn Vĩ mô | Trường Đại học Duy Tân
124 62 -

Bài tập nhóm Cán cân thương mại Việt Nam giai đoạn 2019-2021 môn Vĩ mô | Trường Đại học Duy Tân
121 61 -

Group project: Macroeconomic analysis of Japan môn Vĩ mô | Trường Đại học Duy Tân
136 68