Vingroup Financial Analysis Report môn Kinh tế vi mô 1 | Học viện Tài chính
This report provides an analysis of Vingroup's consolidated financial statements for FY2024. The analysis focuses on key balance sheet figures, income statement highlights, andfinancial ratios. Tài liệu giúp bạn tham khảo, ôn tập và đạt kết quả cao. Mời đọc đón xem!
Môn: Kinh tế vi mô 1 (MIE) 471 tài liệu
Trường: Học viện Tài chính 1.1 K tài liệu
Tác giả:


Preview text:
Vingroup - Financial Analysis (FY2024) Created: 2025-09-22 11:57:08 1. Introduction
This report provides an analysis of Vingroup's consolidated financial statements for
FY2024. The analysis focuses on key balance sheet figures, income statement highlights, and
financial ratios. Charts are also included for visual representation of financial structure and performance.
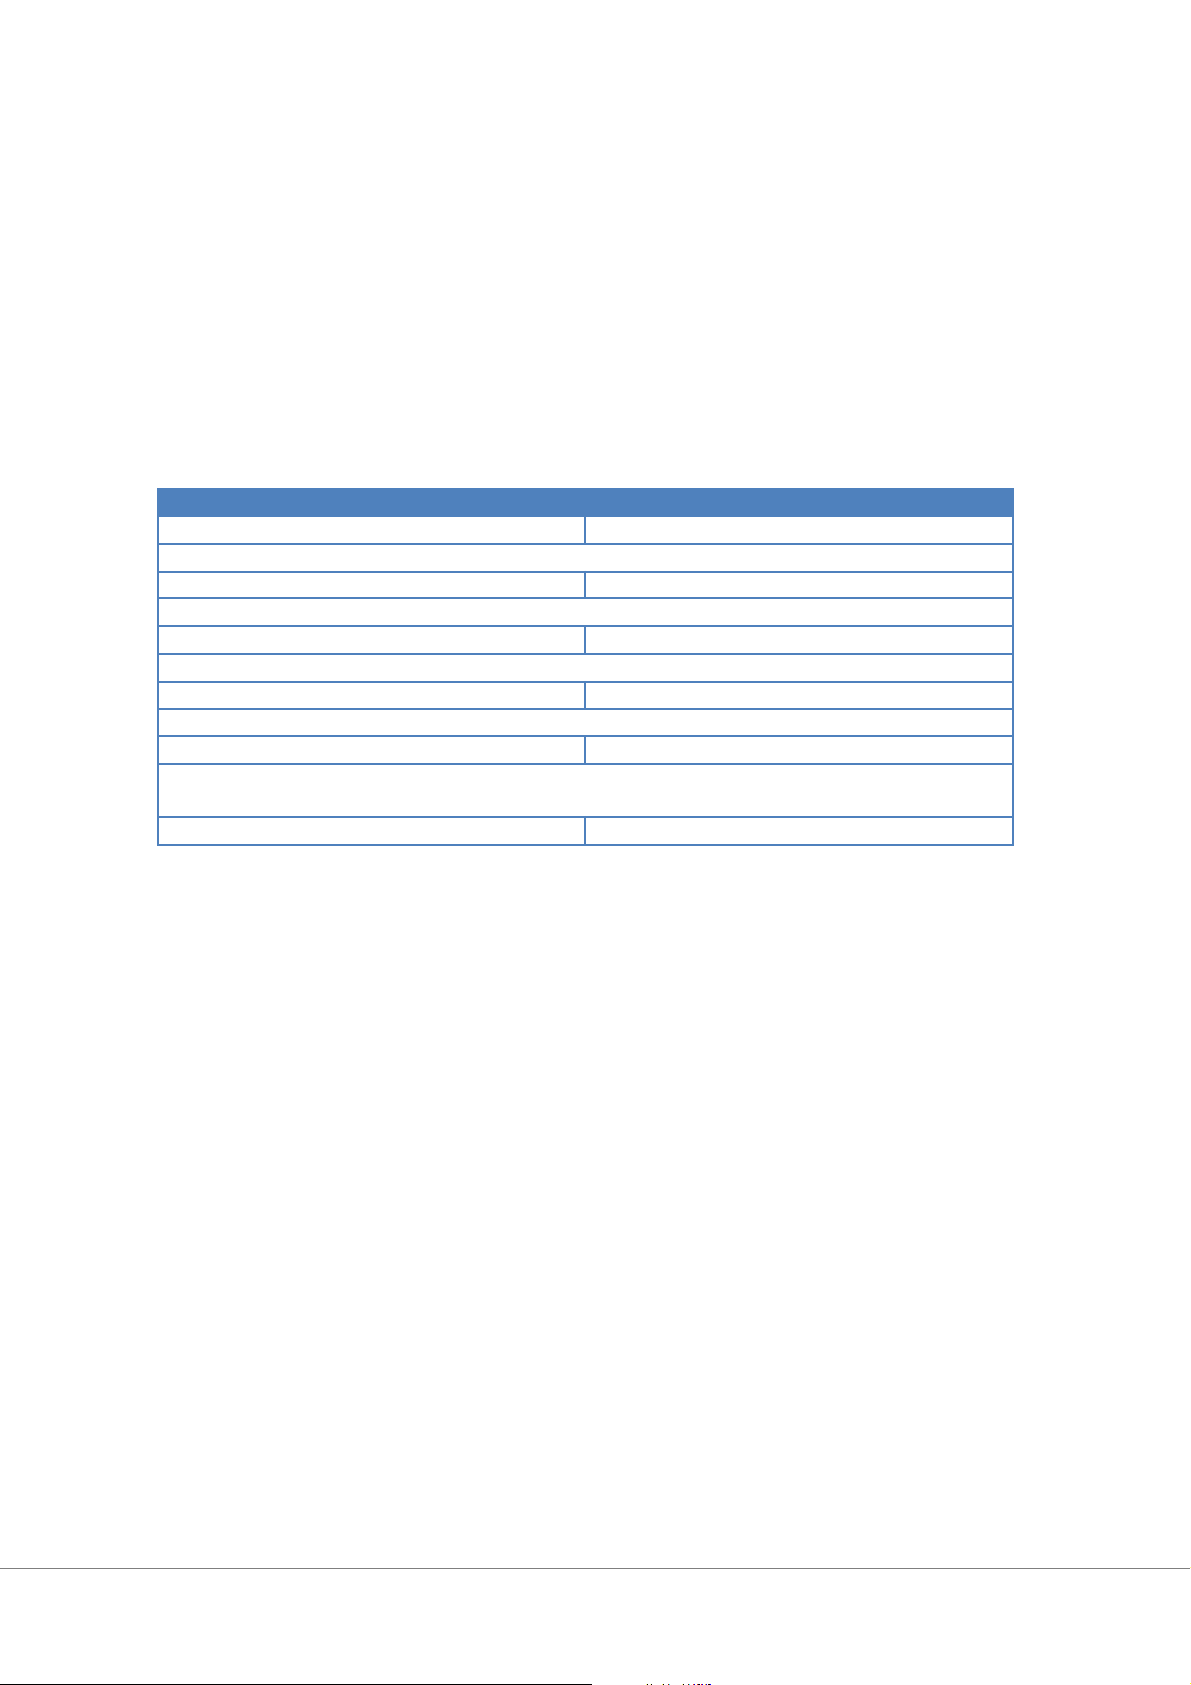
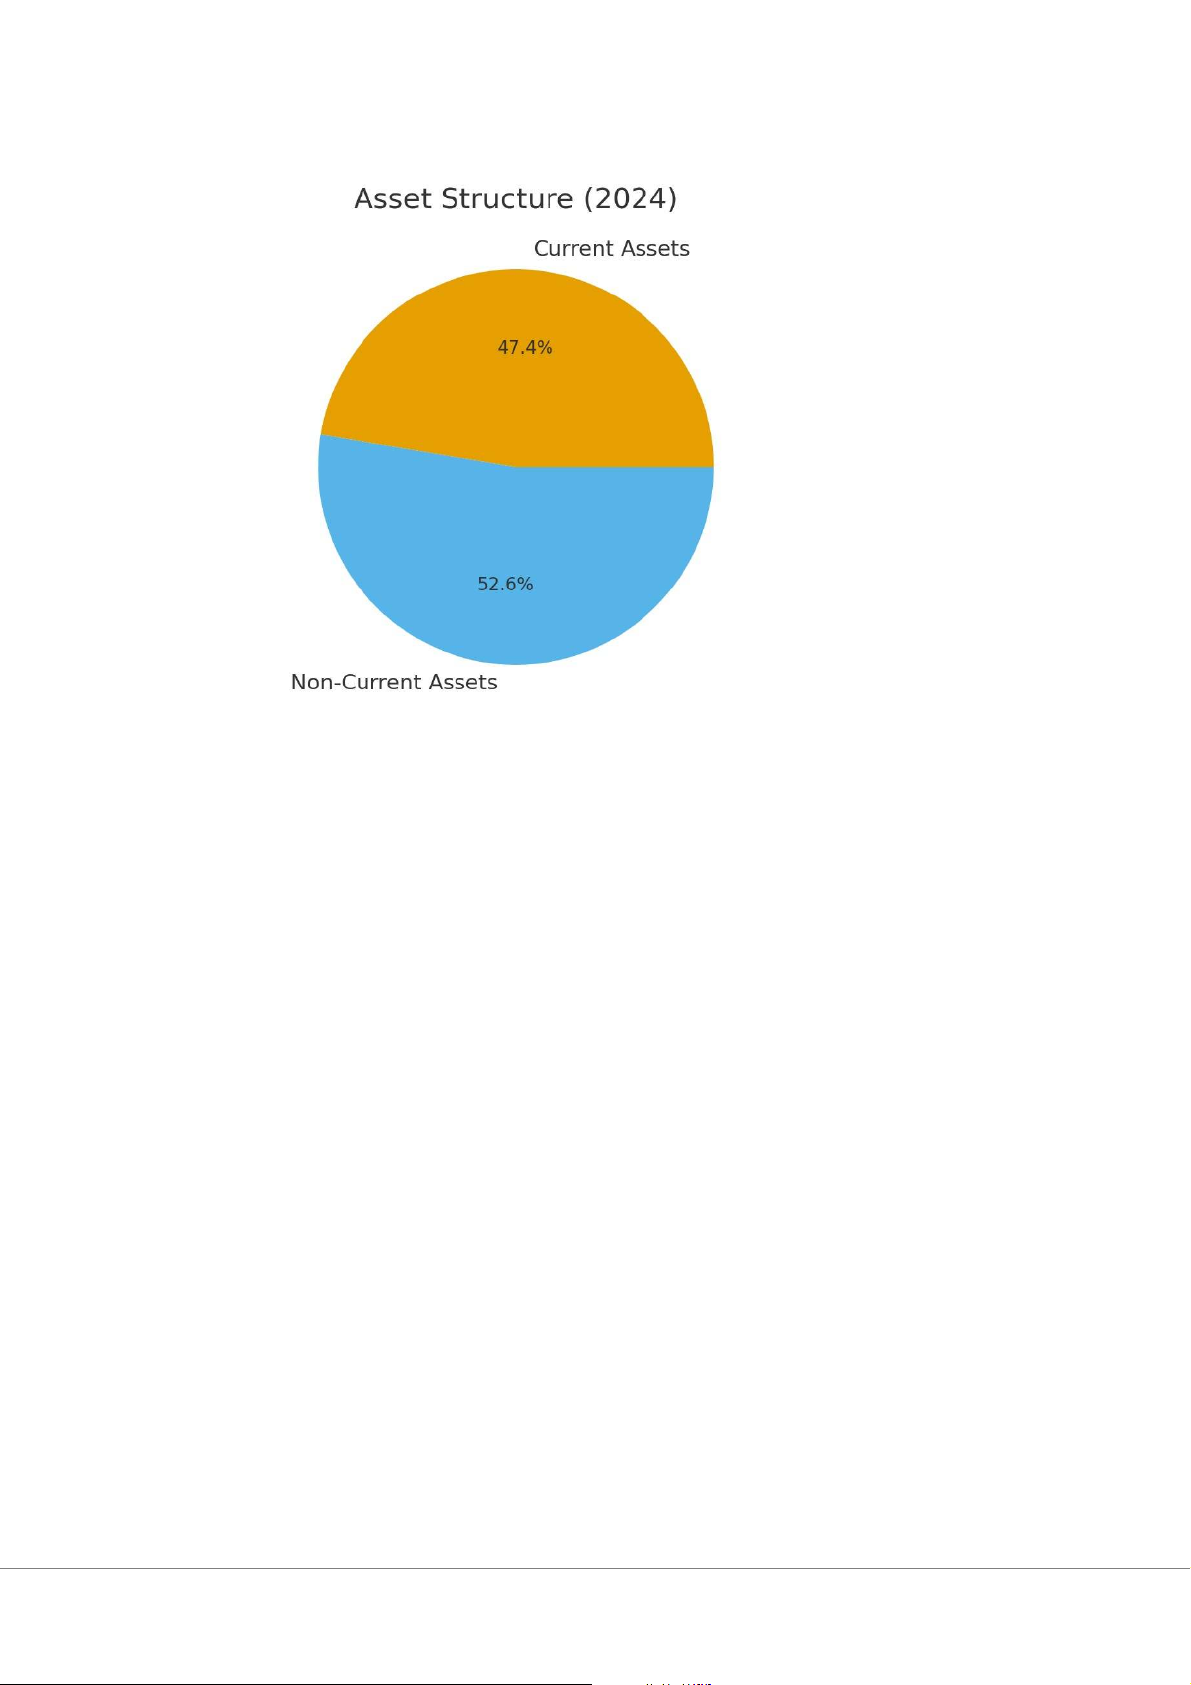
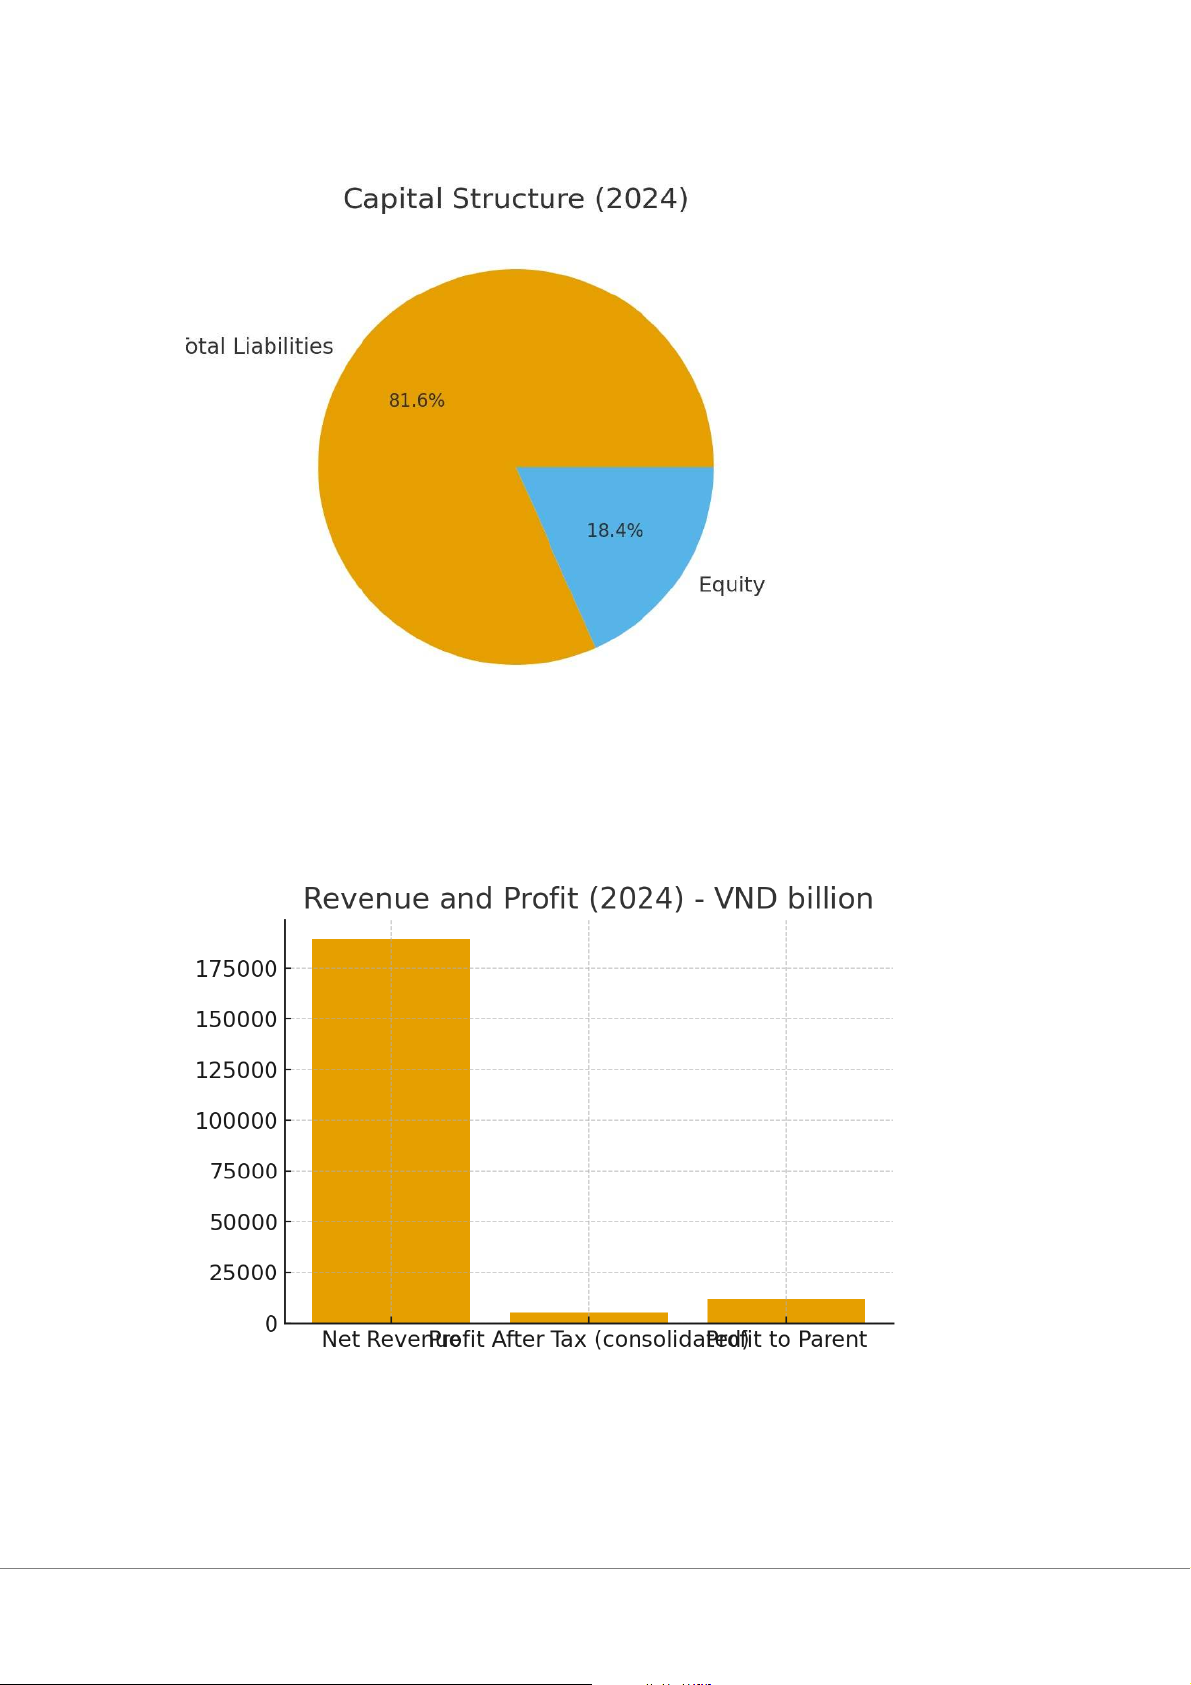
2. Key Financial Figures (VND billion) Item Value Total Assets (2024) 836,604 Current Assets (2024) 396,480 Non-Current Assets (2024) 440,124 Total Liabilities (2024) 682,769 Current Liabilities (2024) 506,624 Non-Current Liabilities (2024) 176,145 Owner's Equity (2024) 153,834 Net Revenue (2024) 189,068
Profit after tax - consolidated (2024) 5,276
Profit after tax attributable to parent 11,903 (2024) Total borrowings (2024) 227,920 3. Visual Charts
The following charts illustrate the financial structure and profitability of Vingroup in 2024: • Asset Structure: • Capital Structure:
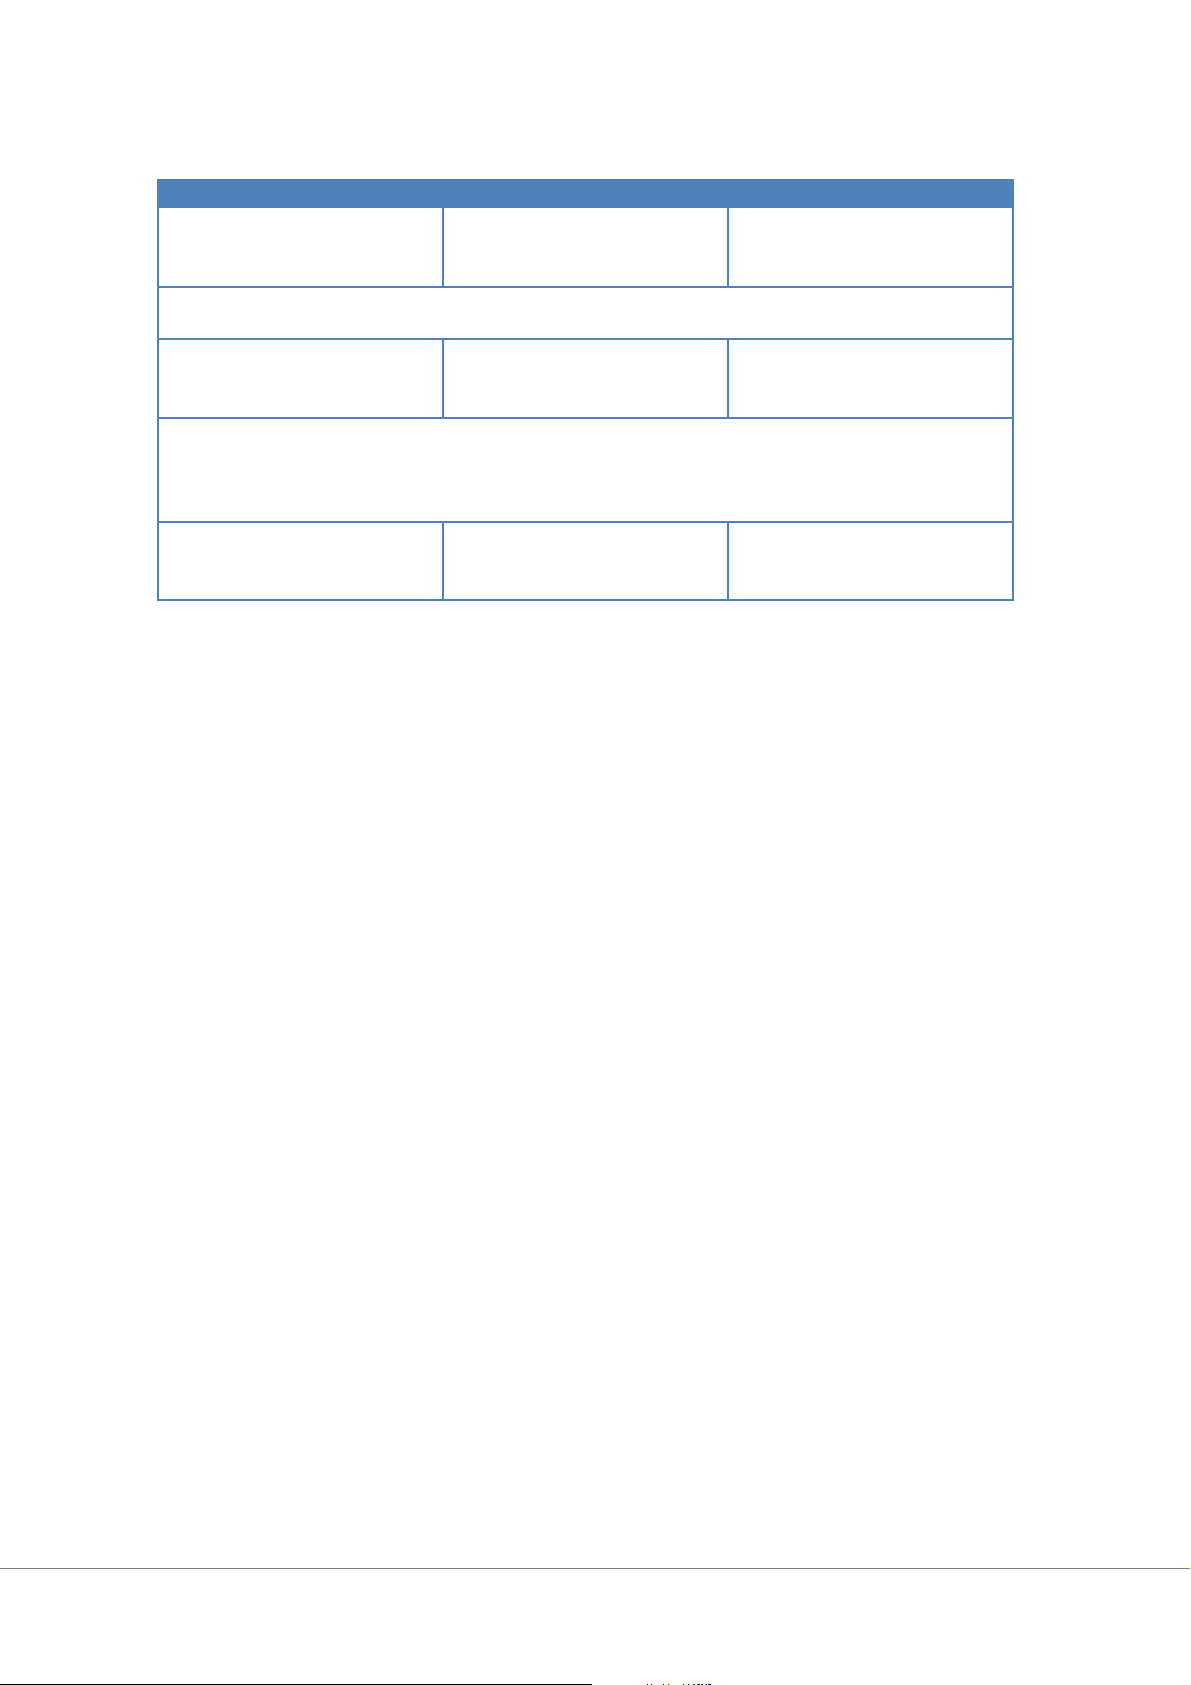
• Revenue and Profit Comparison: 4. Financial Ratio Analysis Ratio Formula Value Current ratio (Current 396,480 / 506,624 0.78 assets / Current liabilities) Debt to assets (Total 682,769 / 836,604 81.61% liabilities / Total assets) Debt to equity (Total 682,769 / 153,834 443.83% liabilities / Owner's equity) Return on Assets - ROA 5,276 / 836,604 0.63% (Profit after tax consolidated / Total assets) Return on Equity - ROE 11,903 / 153,834 7.74% (Profit attributable to parent / Owner's equity) 5. Detailed Interpretation
- Liquidity: The current ratio is 0.78, indicating that short-term liabilities exceed short-term
assets. This suggests potential liquidity pressure and reliance on refinancing or external funding.
- Leverage: Debt accounts for nearly 82% of assets, and the debt-to-equity ratio is above
400%. This highlights Vingroup's high leverage strategy, typical for large-scale property and
manufacturing groups. Such a structure can magnify returns but also increases financial risk.
- Profitability: ROA is 0.63%, showing limited returns from assets. ROE at 7.74% is modest,
but better than ROA due to leverage. However, compared to industry peers, profitability remains on the low side.
- Revenue and profit: Net revenue reached VND 189 trillion in 2024. Profitability, however,
was relatively weak due to large financing costs, investment cycles, and the challenges faced by VinFast.
- Outlook: To improve financial health, Vingroup may focus on optimizing cash flows,
reducing debt, and improving profitability from new ventures. 6. Conclusion
Overall, Vingroup remains a large and diversified conglomerate with strong revenue
generation capacity. Nevertheless, high debt levels and low profitability indicators pose
financial risks. Sustainable growth will depend on deleveraging, efficient capital allocation,
and success in emerging sectors. 7. References
Vingroup Consolidated Financial Statements FY2024 (audited, published April 2025).
Annual General Meeting 2025 materials and investor relations publications.
Tài liệu liên quan:
-
Các tiêu chuẩn quốc tế đặt ra cho Việt Nam trong quá trình hội nhập toàn cầu môn Kinh tế vi mô 1 | Học viện Tài chính
27 14 -

Phương pháp giải bài tập và đề thi môn Kinh tế vi mô 1 | Học viện Tài chính
27 14 -
Câu hỏi ôn tập chương 5 & 6 môn Kinh tế vi mô 1 | Học viện Tài chính
27 14 -
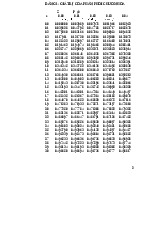
Bảng Giá Trị Thống Kê - Phân Phối Fisher & Durbin-Watson môn Kinh tế vi mô 1 | Học viện Tài chính
24 12 -
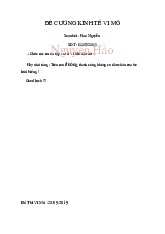
Đề cương ôn tập môn Kinh tế vi mô 1 | Học viện Tài chính
22 11