An assessment potential of large-scale hydrogen export from Vietnam to Asian countries
An assessment potential of large-scale hydrogen export from Vietnam to Asian countries. Tài liệu được sưu tầm giúp bạn tham khảo, ôn tập và đạt kết quả cao. Mời bạn đọc đón xem.
Môn: Tài liệu Tổng hợp 3.6 K tài liệu
Trường: Tài liệu khác 3.9 K tài liệu
Tác giả:


Preview text:
International Journal of Hydrogen Energy 65 (2024) 687–703
Contents lists available at ScienceDirect
International Journal of Hydrogen Energy
journal homepage: www.elsevier.com/locate/he
An assessment potential of large-scale hydrogen export from Vietnam to
Asian countries: Techno-economic analysis, transport options, and energy carriers’ comparison
Dang-Chuong Ta ∗, Thanh-Hoang Le, Hoang-Luong Pham
Department of Thermal Energy Engineering, Hanoi University of Science and Technology, Hanoi, 100000, Viet Nam A R T I C L E I N F O A B S T R A C T Keywords:
Hydrogen and synthetic fuels are emerging as viable low-carbon options, notably underscored by Japan’s ‘‘Basic HOMER pro
Hydrogen Strategy’’ (2017) and Korea’s ‘‘Hydrogen Economy Roadmap’’ (2019), emphasizing the significant Hydrogen transmission
demand for imported hydrogen in East Asia. This article conducts a techno-economic assessment on hydrogen Export hydrogen
production and transmission including storage, shipping, and re-conversion. Three storage options – liquid Liquid hydrogen hydrogen (LH Ammonia
2 ), ammonia (NH3 ), and liquid organic hydrogen carriers (LOHC) – are compared. Applying
HOMER Pro (Hybrid Optimization of Multiple Energy Resources) software, the optimized hydrogen production LOHC/MCH
system in Tra Vinh, Vietnam, integrates wind turbines and grid infrastructure, revealing the most economical
levelized cost of hydrogen production (LCOH ) with values of $2.00/kg, $1.86/kg, and $1.72/kg for LH 𝑃 2 ,NH3 ,
and LOHC conversion systems, respectively. In terms of hydrogen transmission, LH2, NH3 and LOHC rank
1st, 2nd, and 3rd, respectively, in levelized cost of hydrogen transmission (LCOH ). LH 𝑇 2 exhibits the highest
levelized cost of hydrogen and CAPEX for conversion and storage at both export and import terminals.
Furthermore, a gradual reduction in load from 90% to 60% results in an increase in total levelized cost of hydrogen (LCOH
) for all three candidates. In export scenarios to Japan and Korea, LH 𝑇 𝑜𝑡𝑎𝑙 2 , experiences a substantial LCOH increase ($2.00/kg), while NH 𝑇 𝑜𝑡𝑎𝑙
3 and LOHC show marginal increases ($1.20/kg and $0.80/kg) respectively. 1. Introduction
can help reduce the load on the poor power transmission system and
increase the system’s load capacity.
Renewable hydrogen (or green hydrogen) is produced through elec-
Vietnam has a huge potential for developing renewable energy. The
trolysis using renewable energy sources, and it is a near-zero carbon
total potential of wind power onshore is about 221,000 MW. Offshore
production route [1]. In PM Decision 500/QD-TtG signed by deputy
wind power potential (600,000 MW), solar potential is about 963,000
prime minister Tran Hong Ha, the production of new energy (hydrogen,
MW (ground about 837,400 MW, water surface about 77,400 MW
ammonia, etc.) is prioritized unlimited development based on assuring
and roof about 48,200 MW) [2]. Additionally, development of green
energy security and yielding high economic effectiveness [2]. In July
hydrogen should be in the southern part of Vietnam, due to abundant
2023, Deputy Prime Minister Tran Hong Ha freshly signed a decision
renewable energy sources and closer to potential hydrogen consumers,
to approve the National Energy Master Plan for the 2021–2030 period,
including industries and transportation hubs. Moreover, the southern
with a vision to 2050. Orientation to strongly develop offshore wind
part of Vietnam has a high concentration of big harbors which is
power in combination with other types of renewable energy (solar
advantageous for exporting green hydrogen.
power, onshore wind power, . . . ) to produce new energy (hydrogen,
Tra Vinh province is in the Mekong Delta region of Vietnam which is
green ammonia, . . . ) to meet domestic and export demand [3]. There-
considered as the most important location for increasing clean energy
fore, producing green hydrogen is the solution for the issue of the
current feed-in tariff pricing mechanism implemented in the renewable
generation in Vietnam. It has high potential of renewable energy re-
energy industry. Moreover, green hydrogen can be used to generate
sources, also with a 65 km long coastline and different deep continental
electricity at consumption points near renewable energy sources, re-
shelves, Tra Vinh province is suitable for wind power development
ducing the pressure on electricity transmission on the grid system. This
investment. The province is pushing forward the implementation of ∗ Corresponding author.
E-mail address: chuong.tadang.hust@gmail.com (D.-C. Ta).
https://doi.org/10.1016/j.ijhydene.2024.04.033
Received 12 January 2024; Received in revised form 27 February 2024; Accepted 2 April 2024 Available online 10 April 2024
0360-3199/© 2024 Hydrogen Energy Publications LLC. Published by Elsevier Ltd. All rights reserved. D.-C. Ta et al.
International Journal of Hydrogen Energy 65 (2024) 687–703
of the province, the province has promoted and created favorable Nomenclature
conditions for investors to come and survey. Moreover, it is the gateway LH
to the Mekong Delta region (with a channel for large-tonnage ships en- 2 Liquid Hydrogen NH
tering the Hau River), facilitating maritime trade and having potential 3 Ammonia AEM Anion Exchange Membrane
for maritime economic development located between the Tien and Hau AWE Alkaline Water Electrolyzer
rivers, interconnected water and land transportation infrastructure with
the region and international area, a system of 4 seaports (Tra Cu, Dinh BESS Battery Energy Storage Systems
An, Duyen Hai, and intergrated seaport). Notably, The Green Solutions C𝐶
Installed Capacity of Conversion Plant
Tra Vinh Green Hydrogen Company, a member of The Green Solutions C𝐸
Installed Capacity of Export Terminal
Group, has started construction of Vietnam’s first and largest green C𝐼 Installed Capacity
hydrogen factory in Tra Vinh’s Duyen Hai district, with a total invest- C𝑆 Shipping Capacity
ment of 8 trillion VND (341 million USD) [4]. Also, John Cockerill, the CAPEX Initial Capital Expenditure
mechanical engineering group from Belgium reached an agreement to CF Capacity factor
develop a hydrogen factory in Tra Vinh [5]. Therefore, for this purpose, CRF Capital Recovery Factor
Tra Vinh province is chosen as the location of interest for this study. E𝑝𝑟𝑖𝑐𝑒 Electricity Price
The IEA report in 2019 ‘‘The Future of Hydrogen’’ estimated hy- F𝑝𝑟𝑖𝑐𝑒 Fuel Price
drogen costs from hybrid solar photovoltaic (PV) and onshore wind GH2 Green Hydrogen
systems in the long term. The production cost of hydrogen ranges GIZ
Deutsche Gesellschaft fur Internationale
from $3.00 to more than $4.00 per kg with the majority being around Zusammenarbeit GmbH
$3.00 and $3.20 which are lower compared to other countries in HOMER Pro
Hybrid Optimization of Multiple Energy
Southeast Asia [1]. Another report from GIZ (Deutsche Gesellschaft Resources
für Internationale Zusammenarbeit GmbH) presented the estimate of HRES
Hybrid Renewable Energy Systems
the cost of green hydrogen production in Vietnam with four periods: IEA International Energy Agency
2022 (e4.75 – e 5.00/kg), 2030 (e2.75 – e3.00/kg), 2040 (e1.75 – IRENA
International Renewable Energy Agency
e2.00/kg) and 2050 (e1.25 – e1.50/kg) [6]. It also analyzed three l Sea Distance
shipping options (LH2, ammonia and LOHC) and indicated ammonia,
except for importing countries with low electricity prices where LOHC LCOE Levelized Cost of Energy
becomes the preferred option. However, when it comes to modeling LCOH𝐶
Levelized Cost of Hydrogen Conversion
or analyzing the techno-economic aspects of HRES (Hybrid Renewable LCOH𝐸
Levelized Cost of Hydrogen Export terminal
Energy Systems) the two reports did not optimize the design of com- LCOH𝐼
Levelized Cost of Hydrogen Import terminal
ponents. In [7] presented numerous widely used software programs LCOH𝑃
Levelized Cost of Hydrogen Production
in such studies. In there, the computer program HOMER Pro (Hybrid LCOH𝑅
Levelized Cost of Hydrogen Re-conversion
Optimization of Multiple Energy Resources) created and analyzed HRES LCOH𝑆
Levelized Cost of Hydrogen Storage
with the large number of available energy resources including con-
LCOH𝑇 𝑜𝑡𝑎𝑙
Total Levelized Cost of Hydrogen
ventional and renewable sources; it also allows the design of both LCOH𝑇
Levelized Cost of Hydrogen Transmission
off-grid and on-grid systems. By considering various factors such as LOHC
Liquid organic hydrogen carriers
system sizing, component selection, and operational strategies and con- MRF Minimum Renewable Fraction
straints, HOMER Pro enables users to determine the most efficient and NPC Net Present Cost
cost-effective configurations for their specific energy needs. In 2019, O&M Operation and Maintenance
Abdin et al. determined the minimum levelised cost of energy (LCOE) OPEX
Annual Operational Expenditures
and levelized cost of hydrogen production (LCOH𝑃 ) for three off-grid OPEX
locations with nine different renewable energy systems simulated by 𝑓 𝑖𝑥𝑒𝑑
Annual Fixed Operation Expenditures
HOMER pro [8]. The results showed System PV and WT-based hybrid
OPEX𝑣𝑎𝑟𝑖𝑎𝑏𝑙𝑒
Annual Variable Operation Expenditures
systems: (a) without a battery energy storage systems (BESS) resulted PEM Proton Exchange Membrane
in the minimum 17.20$/kg. On the other side, the system PV and WT- PV Photovoltaic
based hybrid systems: (b) with BESS, (c) without a fuel cell resulted Q𝐶
Annual Dispensed Hydrogen of Export Ter-
in the minimum LCOE from 0.50 $/kwh to 0.66 $/kwh. They also minal
concluded that a combination of hydrogen technologies could replace Q𝐶 Annual Output Conversion Plant
the BESS for long-term energy storage and reliable power supply, RF Renewable Fraction
although currently, the cost is higher due to higher capital cost of RO reverse osmosis
system component. Barhoumi et al. [9] proposed optimizing hydrogen ROI Return of Investment
refueling stations in Salalah City using wind turbine technology, com- SEC
Specific Electricity Consumption
paring standalone and grid-connected configurations. Their analysis SOEC Solid Oxide Electrolysis Cells
found the grid-connected setup to be the most cost-effective, with a t
LCOE of 0.06 e/kWh and LCOH of 6.24 e/kg. In 2023, Dokhani et al. ℎ𝑎𝑟𝑏𝑜𝑟
Average time the ship spend at harbor t
evaluated techno-economic assessment of hydrogen production from
𝑠𝑡𝑜𝑟𝑎𝑔𝑒 storage time at terminal Tol-MCH Toluene-Methylcyclohexane
sea water and assessed of HRES connect with grid Norway imposed a tpd Ton per Day
new 2025 emission tax [10]. The results show HRES with offshore wind v ship Velocity
connect with grid show the cost 3.51 $/kg, while amount of energy
required for desalination is 1.00% while the cost of producing hydrogen WT Wind Turbine
reaching 5.11 $/kg when the tax on emission in Norway from the grid
solutions to become one of the renewable energy centers in the Mekong was taken into consideration.
Delta region. To develop the potential of renewable energy, especially
LH2, NH3, and LOHC are three prominent options for shipping due
wind power, in recent years, based on the energy development plan to several reasons: 688 D.-C. Ta et al.
International Journal of Hydrogen Energy 65 (2024) 687–703 Table 1
Key properties of various carriers [12–14]. Hydrogen Carrier LH2 NH3 TOL-MCH Density (kg/m3) 70.8 682 769 Boiling point (◦C) −252.9 −33.3 101 Gravimetric H2 100 17.8 6.16 density (wt%) Volumetric H2 70.9 120.3 47.1 density (kg /m3) H2 Energy density 33.3 5.9 2.0 (kWh/kg) Energy density 2364 4029 1565 (kWh/m3) Preparation costs High preparation costs due to Relatively lower preparation Moderate preparation costs
the energy-intensive process of costs compared to liquid despite initial toluene cost liquefaction. hydrogen. requirement. Storage and Requires cryogenic storage Can be stored and transported Stored and transported in a transportation and transportation at at ambient conditions, making liquid state at moderate methods extremely low temperatures it more practical and temperatures and pressures, (−253 ◦C), which can be cost-effective compared to offering ease of handling and challenging and costly. liquid hydrogen. lower safety risks compared to liquid hydrogen. Advantages High energy density by
Well-established infrastructure Offers high energy density by weight, suitable for for production, storage, and volume, ease of storage and applications requiring high transportation; can serve as a transportation, and potential purity and energy content. direct hydrogen carrier or be for reversible hydrogen used for industrial purposes. release. Bottlenecks High energy input required for Issues may arise from its De-hydrogenation is a liquefaction, safety concerns
toxicity, safety hazards during high-intensity energy process. associated with cryogenic handling and transportation, Additional steps required for handling, and the need for and the NH3 decomposition hydrogen release and specialized infrastructure.
process requires high-intensity recovery, potential for energy. degradation or loss during repeated cycling.
- High volumetric and gravimetric of hydrogen: LH2, NH3 and
2019, Heuser et al. [15] conducted a techno-economic analysis ex-
LOHC can store hydrogen at a higher energy density than other
ploring hydrogen trade between Patagonia and Japan, projecting a
storage methods, making them attractive options for hydrogen
pre-tax expense of approximately $4.44/kgH2 for liquid hydrogen de- storage.
livery to Yokohama Harbor. Wind-based hydrogen production cost was
- Scalability: All three methods have the potential to be scaled up
estimated at $2.16/kgH2, aligning with Armijo et al. (2020) [16], who
for use in large-scale applications such as fueling stations, fuel
computed flexible H2 and NH3 production costs at around $2.00/kgH2
cells, and other industrial uses.
and the levelized cost of ammonia below $500.00/tNH3. Ishimoto - Existing infrastructure: NH
et al. in 2020 [17] compared LH
3 is fully prepared to support the tech-
2 and NH3 as hydrogen carriers,
nology, with numerous transmission and distribution networks,
finding LH2 more energy-efficient and with lower CO2 emissions (20–
as it is already widely used in the fertilizer industry. Meanwhile,
23 kgCO2/MWh) compared to NH3 (76–122 kgCO2/MWh). LH2 also LH
showcased lower production and delivery costs to Rotterdam, priced
2 can take advantage of the LH2 supply chain. For instance,
as of April 2022, there were 161 operational hydrogen refueling
at 5.00e/kgH2 compared to NH3 at e5.90/kgH2. Transporting hy- stations in Japan [11].
drogen to Japan indicated similar costs for both pathways, close to - Safety: LH e7.00/kgH
2, LOHC, and NH3 have been extensively tested for
2. Additionally, the study indicates that, with optimistic
safety and are considered relatively safe for storage and transport,
projections, the costs linked to the LH2 pathway approach Japan’s 2030
with reliable safety measures in place.
hydrogen price goal. Hong et al. in 2019 [18] conducted a techno-
economic assessment of the hydrogen supply chain in the ASEAN re-
Although LH2, LOHC, and NH3 offer several benefits, they still
gion, encompassing the transfer of hydrogen from Malaysia, Indonesia,
have some limitations that need to be addressed, such as the cost of
and Australia to Singapore. Considering its vast renewable resources,
production, transportation, and safety concerns associated with their
Australia can supply both green ($6.00/kgH2) and blue ($1.80/kgH2)
usage. Therefore, the choice of hydrogen storage method will depend
hydrogen. Malaysia and Indonesia possess abundant natural gas, but
on the specific application and its requirements. A comparison of these
renewable sources are limited; therefore, they can provide only blue
three carriers including physical properties, preparation costs, storage
H2 at $2.00/kgH2 and $1.80/kgH2, respectively. With the assumption
and transportation methods, as well as advantages and bottlenecks is
that green hydrogen is produced in Australia for $6/kgH2, the study’s shown in Table 1 [12].
findings reveal that the LCOH for LH2, NH3, and MCH amounts to
In [12], they investigated the efficiency and anticipated expenses
$9.50/kgH2, $9.90/kgH2, and $9.20/kgH2, respectively. Felipe et al.
for exporting hydrogen from Australia to Japan via LH2, MCH, and
in 2020 [19] conducted an techno-economic analysis of the solar H2
NH3. The study evaluated the LCOH at 2030 and 2050. By assuming
supply chain linking Chile and Japan. They analyzed H2 production
hydrogen production costs of $0.75/kgH2 in Australia, the resulting
via AWE and PEM electrolysis with diverse energy supply strategies,
LCOH in 2030 stood at $2.67/kgH2 for LH2, $2.34 for Tol-MCH,
as well as transmission methods using LH2 and NH3. Their findings
$2.34/kgH2 for NH3 (decomposition) and $1.78/kgH2 for NH3 (direct
indicated that production costs decreased from $2.20/kgH2 in 2018
use). Moving to 2050 with production costs at $0.60/kgH2, LCOH
to $1.67/kgH2 by 2025–2030. Additionally, the LCOH values were
reduced to $1.78/kgH2 for LH2, $2.00/kgH2 for Tol-MCH, $2.00/kgH2
$7.48 – 7.79/kgH2 for NH3 and $9.12–9.34/kgH2 for LH2 in 2018; and
for NH3 (decomposition), and $1.56/kgH2 for NH3 (direct use). In
$3.94–4.32/kgH2 for NH3 and $4.89 – 5.07/kgH2 for LH2 by 2025. 689 D.-C. Ta et al.
International Journal of Hydrogen Energy 65 (2024) 687–703
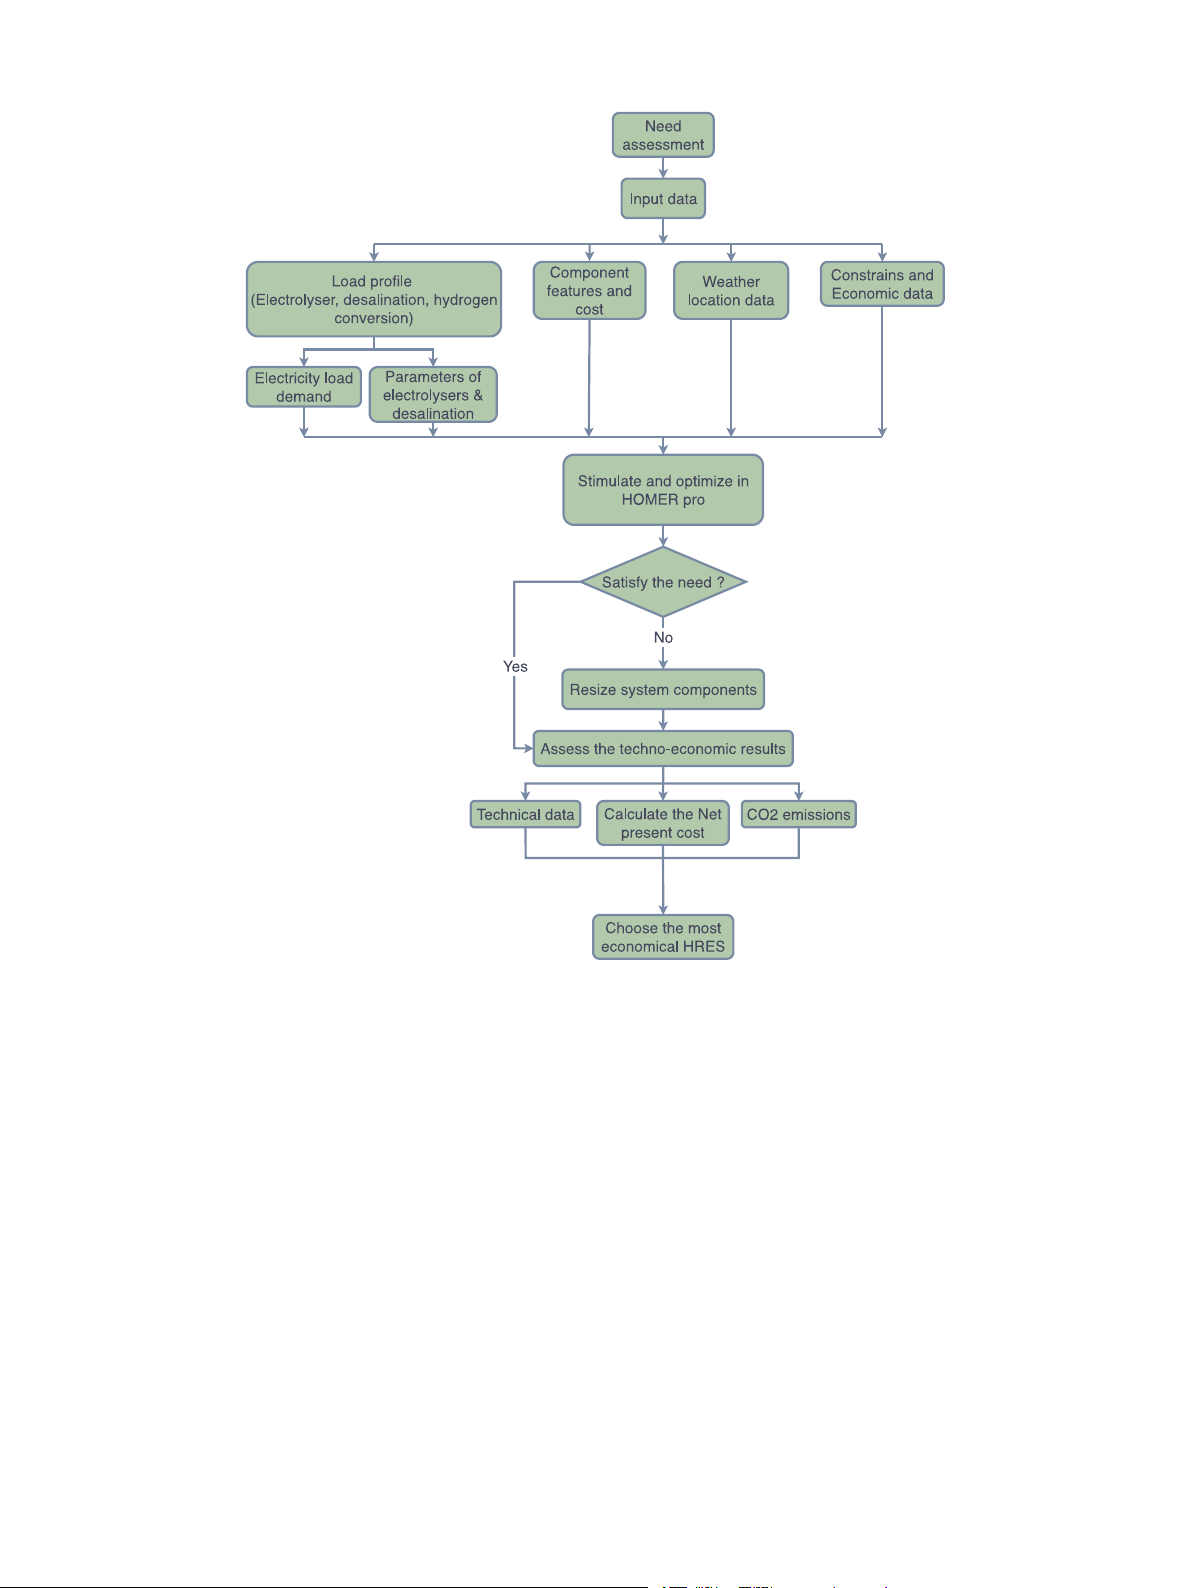
Fig. 1. Graphical methodology.
However, to the best of our knowledge, recent studies on modeling
• Optimizing HRES by HOMER pro.
HRES with HOMER Pro have primarily focused on the domestic pro-
• Estimating the cost of hydrogen transmission involves conversion,
duction of electricity and hydrogen, without considering the potential
intermediate and shipping, and re-conversion of hydrogen.
for exporting hydrogen. These studies have typically involved the pro-
duction of a limited volume of green hydrogen, which is then stored
Fig. 1 presents the methodology principal diagram.
using compressed tanks. The main focus of modeling HRES has been
HOMER optimizes diverse system configurations based on specific
on two objectives: generating electricity and utilizing excess electricity
parameters, such as Net present cost (NPC), LCOE, operating cost-, re- to produce GH
newable fraction (RF) with constraints of minimum renewable fraction
2. Realizing the research gaps from previously published
papers, the main contributions of this paper are summarized as follows:
(MRF), greenhouse gas emissions, and more.
Some specific parameter is defined by HOMER as follows:
• Designing and optimizing a least-cost model that focuses only
on producing hydrogen for export, considering Vietnam’s con-
- NPC: The Net Present Cost (or life-cycle cost) of a component is
straints, for both off-grid and on-grid scenarios.
the present value of all the costs of installing and operating the
• Selecting and comparing three models with the lowest LCOH
component over the project lifetime, minus the present value of 𝑃 ,
lowest initial expenditure, and the most economical off-grid for
all the revenues that it earns over the project lifetime.
producing green hydrogen, respectively.
- LCOE: The Levelized Cost of Energy is the average price of energy
• Calculating the cost of hydrogen for exports to importing coun-
that will be provided by the system.
tries (Japan and Korea) involves optimizing the total produc-
- RF: The Renewable Fraction is the fraction of the energy delivered
tion cost using HOMER Pro. This includes conversion and re-
to the load that originated from renewable power sources.
conversion costs, intermediate storage costs at export and import
terminals, as well as shipping costs.
Using a repetitive algorithm, it identifies the setup with the lowest
• Sensitivity analysis with the model that has the lowest LCOH
costs and highest benefits, considering technical feasibility. See Fig. 2 𝑃 by
reducing the load from 90% to 60%. for the optimization process.
2. Materials and methods
2.0.1. Site selection and renewable sources description
The location of the observed HRES is Truong Long Hoa village,
The methodology used in this paper divided in two main sections:
at a latitude of 9◦39.6′ N and a longitude of 106◦32.8′ E, in Tra 690 D.-C. Ta et al.
International Journal of Hydrogen Energy 65 (2024) 687–703
Fig. 2. Optimization flowchart for HOMER pro.
Vinh province. The meteorological data include the daily solar ra- Electrolyzer
diation (mean 5.01 kWh/m2∕day), wind speed (mean 7.00 m/s), and
Currently, there are various types of electrolysis technologies avail- temperature (27.2 ◦C).
able, both on the laboratory scale and industrial scale. The three major
types of water electrolysers now commercially available are an alkaline
water electrolyzer(AWE), a proton exchange membrane (PEM), and a 2.0.2. Load profile
solid oxide electrolysis cells (SOEC) [20]. On the other hand, anion
HOMER pro lacks the information below:
exchange membrane (AEM) have high potential, but are much less
- The electrolysers’ parameters include design capacity (kg/h),
mature technologies,with only a few companies and original equipment power consumption (kWh/kgH
manufacturers involved in their manufacture and commercialization.
2), and water consumption (l/Nm3kgH2).
- Three options hydrogen storage components (liquid hydrogen,
These are mostly based in Europe [21] Therefore, the advantages and ammonia, and MCH).
disadvantages of the first only three technologies will be described in - Desalination components. Table 2.
In this study, the HRES systems are simulated with a stable power
Therefore, this study intends to utilize the electricity load section
supply consistently always higher than 60%. Additionally, in Vietnam,
in HOMER pro, which includes electrolysers, each hydrogen storage
where green hydrogen technologies are entirely novel, there is a de-
option, and a desalination plant for electricity load demand. When con-
mand for the most technologically mature solutions. Considering the
sidering the economic aspects, the cost and lifetime of the electrolysers
comparison of the three types of electrolysers outlined above, the AWE
and desalination plant are accounted for in the two components. The
electrolyzer is selected for systems. AWE’s established reliability and
capacity factor (CF) first is set up 100% (8760 hours/year) for HOMER
scalability make it a suitable option for this project with high and
pro stimulate and optimize the size of components (power capacity).
consistent electricity loads, also cost-competitiveness.
Then, the other capacity factors which include 60%, 70%, 80%, 90%
The electricity load is 100 MW, comprising 5 modules 20 MW
are stimulated for the best configuration with lowest LCOH𝑃 .
AWE from Thyssenkrupp [31]. Table 3 provides the characteristics 691 D.-C. Ta et al.
International Journal of Hydrogen Energy 65 (2024) 687–703 Table 2
Merits and demerits of AWE, PEM and SOEC. Electrolysis technologies Merits Demerits AWE ∙ Long history and the most
∙ Limited current density (0.2–0.7 technologically mature [22]. A/cm2) [25].
∙ ‘Standard’ for large-scale industrial H2
∙ Frequent maintenance requested (due production [22].
to the use of An alkaline liquid
∙ Low cost components for both electrolyte solution) [25].
electrodes and porous transport layer
∙ Limited production capacity dynamic
materials (normally, nickel (Ni)) [23]. range (15%–100%) [25].
∙ Noble metal-free electrocatalysts [24]. ∙ H2 Purity than other
∙ Lifetime is around 60000 h [21].
power-to-hydrogen option (such as PEM
electrolysers), while consuming more energy [26]. PEM
∙ A widely adopted commercial ∙ Acidic electrolyte [24]. technology [24].
∙ Low operating pressure (up to 50 bar)
∙ Low level of partial load (0%–10% of [25]. the design capacity) [22].
∙ High specific energy consumption
∙ Minimal maintenance request [25].
(between 4.53 and 7.3 kWh/Nm3 ) [25].
∙ Operate at higher temperatures and
densities, with compact designs suitable
∙ High cost of catalysts and electrodes,
for large-scale containerization [27].
due primarily to the expense associated
∙ Lifetime is around 50000–80000 h
with noble metals (mainly platinum) or [21]. iridium [25,27]. SOEC
∙ Extremely high efficiency around 80–90.8%,
∙ Under development, currently only deployed at
potentially surpass all existing electrolysis options
the kW-scale, although some current demonstration in efficiency [28].
projects have already reached 1 MW [21], [24].
∙ High operating temperatures of up to 800–1000
∙ High temperature also cause rapid degradation ◦ C [29].
of cell components, some of which are represented
∙ The potential for reversibility (operating as fuel by brittle ceramics [28]. cell and electrolyzer) [21].
∙ Faces challenges including rapid degradation of
∙ Co-electrolysis of CO2 and water to produce
cell components, leading to low durability and a
syngas (which is the basic building block for the shorter lifetime [30]. chemical industry) [21]. Table 3 Table 4
20 MW AWE model characteristics.
Parameters of desalination plant. Design capacity H2 (Nm3/h) 4000 [31]
Demand of purified water for electrolysers (l/h) 200000 [34] Design capacity (kg/h) 396 [31]
Demand of purified water for electrolysers (m3/day) 480b
Power consumption (DC) kWh/ Nm3 H2) 4.5 [31] CAPEX $/(m3/d) 1500 [34]
Power consumption (DC) kwh/ day)- CF = 100% 432000 [31]
O&M (not included electricity/m3/year) 30a Water consumption (L/Nm3 H2) 1 [31]
Electricity consumption per day 2040 Load 10%–100% [31] Membrane life (years) 5 [36]
H2 product quality after treatment (optional) up to 99.999% [31]
Replacement membrane cost ($/m3) 109b
H2 product pressure at module outlet ≈ 300 mbar [31] a Operating temperature (◦C) Up to 90 ◦C [31] Our assumption. b Lifetime (h) 60000 [21] Our calculation. Capital cost (USD/kW) 750 [21] O&M cost (USD/year) 30a
Stack replacement cost (USD/kW) 300 [32] Desalination a Our assumption.
The process begins by transporting seawater to the Ultra Filtration
From Table 3, We can calculate that 100 MW electrolyzer consume 2160000 kWh/day.
system, followed by pumping it to the reverse osmosis membrane (RO),
and finally passing it through subjecting it to the ion exchange (IX) process.
of each module. As Thyssenkrupp does not disclose the lifetime and
The demand for purified water for the electrolyzer is 20,000 l/h
cost of electrolyzer systems, data will be sourced from the IRENA
(480 m3/day). The CAPEX is $1500/(m3/d) [34]. The O&M (not in-
report [21]. Operational and maintenance (O&M) costs are assumed
cluding electricity/mm3/year) is assumed to be 2% of CAPEX per year.
to be 2% of the initial capital expenditure (CAPEX) per year, with
Overall, RO requires 3.5–5 kWh of energy for each cubic meter of clean
stack replacement costs nominally accounting for 40% of CAPEX [32].
water produced [35]. Therefore, this study chooses the mid value 4.25
In [33], auxiliary equipment’s electricity consumption includes com-
kWh/m3. In [36], the seawater reverse osmosis plant with a capacity of
pressors (1.5%), and other components (1%) such as cooling water,
500 m3/day is in IOS, Israel. The membrane life is 5 years, replacement
tower dryers, deoxidizer, and desalination. However, since this study
cost is 54,000 e, equal to $113.54/m3. Therefore, in this study, with
employs three storage options (LH2, NH3, and LOHC), compressors are
the capacity being 480 m3/day, we set $109/m3. The techno-economic
unnecessary. Desalination parameters are detailed later. Consequently,
parameters are presented in Table 4.
the electricity consumption of cooling water, tower dryers, deoxidizer
is assumed to be 0.5% of electrolyzer systems. Therefore, the elec-
tricity consumption of electrolysers equals 99.5% of the system’s total
Hydrogen conversion electricity demand electricity consumption.
Hydrogen storage electricity demand has three options: LH2, am-
From Table 3, We can calculate that 100 MW electrolyzer consume
monia and LOHC. Table 5 shows the electricity demand for hydrogen 2160000 kWh/day.
storage per day with capacity factor is 100%. 692 D.-C. Ta et al.
International Journal of Hydrogen Energy 65 (2024) 687–703 Table 5
Daily electricity demand for hydrogen conversion and storage with 100% capacity factor. Parameters LH2 NH3 LOHC
Specific electricity consumption for conversion (kWh/kgH2) 11.9 [37] 6.63 [38] 1.7 [1]
Specific energy consumption for storage at export terminal (kWh/ kgH2) 0.042 [18] 0.01 [18] 0 [18]
Annual hydrogen production (tH2) 17 344 17 344 17 344
Daily conversion electricity demand (kWh/day) 565 488 315 006 80 784
Daily storage electricity export demand (kWh/day) 1195.84 475.2 0 Table 6
The techno-economic data assumptions of PV, wind turbine, inverter, and battery. Description Data Ref PV Name
Canadian Solar MaxPower CS6X-325P Abbreviation CS6X-325P Power capacity (kW) 0.325 [40] CAPEX ($/kW) 876.00 [39] O&M ($/kw/year) 13.20 [39] Replacement cost ($/kW) 442.38 [41] Lifetime (year) 25 [43] WT (onshore) Name Enercon E-126 EP3 Abbreviation E-126 P3 Power capacity (kW) 4000 [40] CAPEX ($/kW) 1274.00 [39] O&M ($/year/kW) 30.00 [39] Replacement cost ($/kW) 718.54 [42] Lifetime (year) 25 [40] BESS Type Generic 4hr 1MW Li-Ion Abbreviation 4hr1MWLI Nominal voltage (V) 600 [40] Nominal capacity (kWh) 4220 [40] Power capacity (kW) 1000 [40] Nominal capacity (Ah) 7030 [40] Roundtrip efficiency (%) 90 [40] CAPEX ($/kWh) 482.00 [44] O&M ($//kW/year) 9.00 [45] Replacement cost ($/kWh) 222.43 [41] Lifetime (year) 15 [44] Converter Type Dynapower IPS - 500 Abbreviation Dyn500 Power capacity (kW) 500 [40]
Inverter & Rectifier efficiency (%) 97.00 [40] CAPEX ($/kW) 21.86 [46] O&M ($/kW/year) 8.74a Replacement cost($/kW) 13.12a Lifetime (year) 15 [40] a Our assumption.
Power components description
from grid, eliminating the need for wind turbines, solar PV, converters, and BESS investments.
Solar PV, wind turbine, battery and converter
The data for four components, namely solar PV, wind turbine, Carbon emissions cost
converter, and battery, are presented in Table 6. In the IEA report
Extending the operation time of the HRES can decrease LCOH𝑃 ,
‘‘Renewable power generation costs in 2022’’ [39], the cost of PV
thereby increasing producers’ profitability. However, the capacity fac-
and WT in Asia are 876.00$/kW and 1274.00$/kW. The technical
tors of power plants utilizing solar or wind energy in Vietnam are com-
parameters can be found in the HOMER pro catalog [40]. According
paratively low, ranging from 22% for solar to 30%–37% for wind [47].
to the Ref. [41], the replacement cost for PV and BESS is 50.50%
Consequently, HRES may opt to procure electricity from the grid
and 46.15% of their capital expenditure (CAPEX) respectively. The
(sourced from nearby coal thermal power plants) and/or integrate BESS
combined replacement cost for nacelle and rotor of the wind turbine is solutions.
56.40% of the installed cost, as stated in Ref. [42]. For the converter, it
CO2 Tax is added as a penalty in the grid section of HOMER pro
is assumed that the O&M cost is 2.00% per year, the replacement cost
when HRES plant buying grid from the conventional power plant. The
is 60.00% of the installed cost, and the assumed lifetime is 15 years.
purpose of implementing a carbon tax is given below: Grid
• Exploring the proportion of carbon penalties in the NPC.
In this study, using electricity from grid is divided into two main
• Assessing how carbon tax affects the competitiveness of com-
options. The first option involves utilizing the grid to extend the oper-
parative economic analyses between different types of HRES,
ating time of the HRES plant for hydrogen generation. With the second
including those reliant on the grid (incur the CO2 tax) and those
option - grid only, the electrolysers are operated totally by electricity
operating off-grid, solely utilizing renewable energy sources. 693 D.-C. Ta et al.
International Journal of Hydrogen Energy 65 (2024) 687–703 Table 7
Electricity retail price list- retail price of electricity for manufacturing industries [50]. Time rate/ average price
Purchasing electricity price (VND/kWh)
Purchasing electricity price ($/kWh) Shoulder load 1584 0.065 Off load 999 0.041 Peak load 2844 0.120 Average 1809 0.075
Fig. 3. Scheduled rates purchasing price from grid.
The suggested carbon tax is about VND43,068 ($1.85) per tCO2 on
ratio used to calculate the present value of an annuity (a series of equal
fossil fuels starting from 2022 and increasing at a real rate of 10% per
annual cash flows). The following formula can be used to determine the year [48]. CRF:
∑25 ((1+0.1)25×1.85)
𝐴𝑣𝑒𝑟𝑎𝑔𝑒 𝑝𝑒𝑟 𝑦𝑒𝑎𝑟 = 0 = 8.08 [ $ ]
𝑖(1 + 𝑖)𝑁 25 𝑡CO
𝐶𝑅𝐹 (𝑖, 𝑁 ) = (3) 2
And the proportion of carbon tax penalty in the NPC as follow:
(1 + 𝑖)𝑁 − 1 CO
Where 𝑁 is the number of years (year). A real discount rate is used to 𝑃
2𝑝𝑒𝑛𝑎𝑙𝑡𝑦 CO (1)
2 𝑝𝑒𝑛𝑎𝑙𝑡𝑦 = 𝑁 𝑃 𝐶
convert one-time costs to annual costs. The computer program HOMER Where, CO
pro calculates the annual real discount rate (interest rate) from the
2 penalty is the penalty of carbon emissions tax over the lifetime.
input data of the nominal discount rate and expected inflation rate.
The HOMER pro tool uses a real discount rate to calculate discount
coefficients and annual costs from NPC. The following equation is used HRES with grid
to calculate the real discount rate:
HRES purchases electricity from a grid supplied by the nearby
Duyen Hai 3 coal thermal power plant. The total carbon emissions 𝑖′ − 𝑓 𝑖 = (4)
amount to 3,111,824.00 tons of CO 1 + 𝑓 ′
2, while electricity generation totals
3,050,807.84 MWh. Therefore, with an average consumption of 1 kWh, The LCOH is calculated by:
Duyen Hai 3 releases 1.06 kg of CO2 [49]. Due to the lack of a 𝑁 𝑃 𝐶
direct power purchase agreement, electricity has been bought and sold 𝐿𝐶𝑂𝐻 = ($∕kg) (5) 𝑚𝐻2
through the Vietnam Electricity National Load Dispatch Centre. The Where m
is the total produced hydrogen through the lifetime of
electricity purchasing prices described in Table 7 [50] determine the H2 HRES.
scheduled rates for the grid, as shown in Fig. 3. Furthermore, it is worth
noting that HRES is prohibited from selling excess electricity to the
2.0.4. Scenario simulation
grid. Carbon emission penalty = 8.08 $/ tCO2.
The power plant for generating hydrogen with 10 different systems
Assumption: 60% of the electricity now comes from the Duyen Hai of energy resources below:
3 coal thermal power plant, while the remaining 40% is derived from
surplus electricity produced by nearby renewable farms. Therefore, the (a) Grid only
carbon emission factor is 0.636 (kg𝐶 /kWh). (b) Grid + Wind turbine (c) Grid + Wind + BESS 2.0.3. Economic aspects (d) Grid + Solar PV
In Vietnam, nominal discount rate is 10% [51] and expected infla- (e) Grid + Solar PV + BESS
tion rate is 4.49% [52]. The economic assessment in this study and
(f) Grid + Wind turbine + Solar PV
comparison of alternatives conducted in HOMER are based upon the
(g) Grid + Wind turbine + Solar PV + BESS
NPC and the LCOH. HOMER Pro calculated the NPC as follows: (h) Wind turbine + BESS
𝐶𝑎𝑛𝑛,𝑡𝑜𝑡 (i) Solar PV + BESS 𝐶𝑁𝑃 𝐶 = (2)
𝐶𝑅𝐹 (𝑖, 𝑅
(k) Wind turbine + Solar PV + BESS 𝑝𝑟𝑜𝑗 )
Where C𝑁𝑃 𝐶 is the total annual cost ($); i is the discount rate; is the
After simulating and optimizing HOMER pro, we choose the best config-
lifetime of the system (year). CRF (Capital Recovery Factor) is the
uration with lowest LCOH𝑃 . Then, simulate it with the capacity factors
function to calculate the coefficient of return on investment (ROI) is a are 90%, 80%, 70% and 60%. 694 D.-C. Ta et al.
International Journal of Hydrogen Energy 65 (2024) 687–703
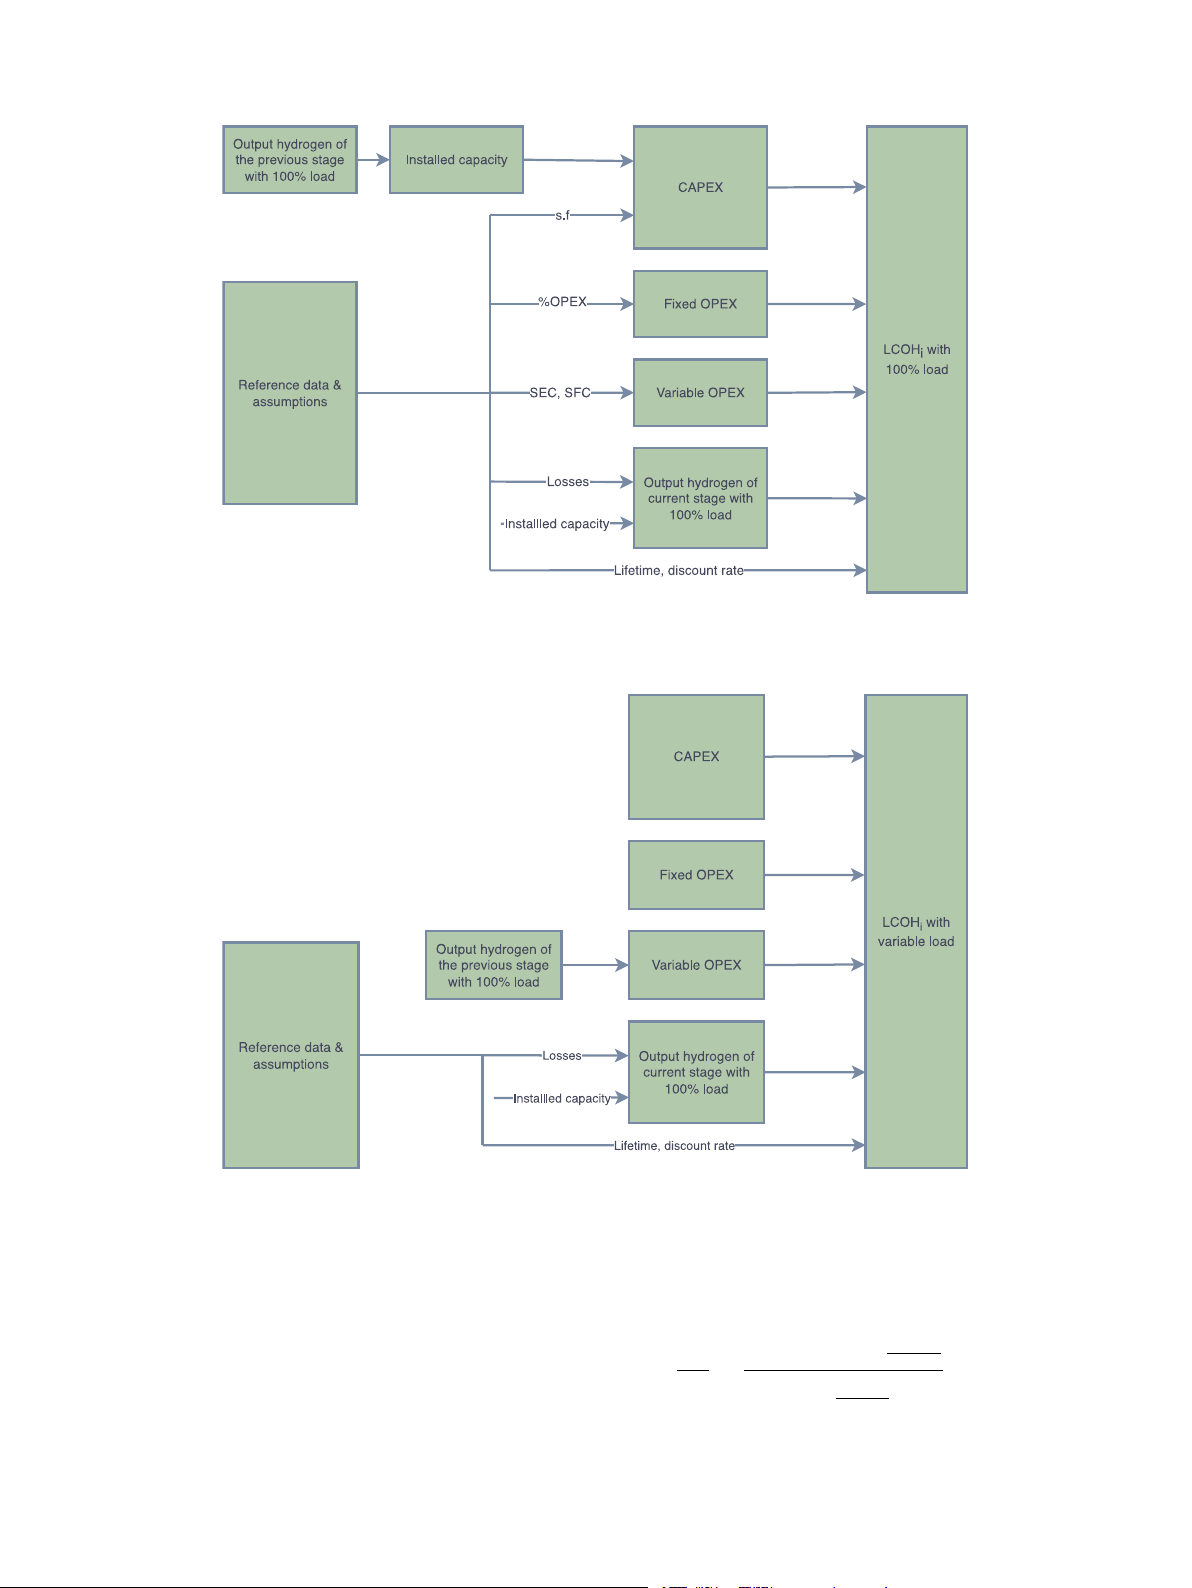
Fig. 4. Graphical methodology of infrastructure and LCOH calculation with 100% load.
Fig. 5. Graphical methodology of LCOH calculation with variable load.
2.1. Estimating conversion/re-conversion, intermediate storage (on import
different stages in the supply chain:
and export side) and shipping cost
𝐿𝐶𝑂𝐻 = LCOH𝑃 + LCOH𝐶 + LCOH𝐸 + LCOH𝑆 + LCOH ) (6)
Fig. 4 shows the CAPEX, OPEX and LCOH calculation model for the
𝐼 + LCOH𝑅($∕kgH2
case where the system operates at 100% load. The LCOH variable load [ ] [ ] ∑ 𝑂𝑃 𝐸𝑋[$]
𝐶𝐴𝑃 𝐸𝑋 $ + 𝑁
modes (decreasing from 90% to 60%) is calculated by keeping constant $ 𝑛=1 (1+𝑖)𝑛 LCOH𝑖 = [ ] (7)
the CAPEX and OPEX fixed cost values, the output values and the input kgH 𝑄 kg 2 ∑𝑁 𝑖 𝐻2
varies according to the corresponding load values, shown in Fig. 5. We 𝑛=1 (1+𝑖)𝑛
assumed the selection of a single ship, and upon each arrival at the
Where, is the overall levelized cost of hydrogen for the whole hydro-
port, all stored hydrogen at the import/export terminal will be loaded
gen supply chain. LCOH𝑃 , LCOH𝐶 , LCOH𝐸, LCOH𝑆 , LCOH𝐼 , LCOH𝑅 are
or unloaded. LCOH is calculated as the cumulative cost throughout the
levelized cost of hydrogen production, conversion, intermediate storage 695 D.-C. Ta et al.
International Journal of Hydrogen Energy 65 (2024) 687–703 Table 8
Techno-economic input data for conversion and re-conversion plant. Unit Conversion plant Re-conversion plant LH2 NH3 LOHC LH2 NH3 LOHC Cost base M$ 1400.00 [1] 453.73 [54] 230.00 [1] 0.017 [1] 460.00 [1] 200.00 [55] Size base tpd 712.33 [1] 388.3 [54] 708.82 [1] 1 [56] 725.34 [1] 913.24 [55] H2 Scaling factor 0.7 [57] 0.7 [58] 0.7a 0.78 [56] 0.7 [58] 0.7 Lifetime Years 20 [37] 25 [1] 30 [1] 10 [59] [60] 30 [1] 20 [1] %OPEX % 4 [1] 2.5 [61] 4 [1] 3 [59] [60] 4 [1] 4 [1] Discount rate % 10 [51] 10 [51] 10 [51] 8 [59] 8 [1] 8 [1] SEC kWh/kg 11.9 [37] 6.63 [38] 1.7 [1] 0.6 [59] [60] 11.2 [1] 15.1 [1] H2 Losses %kg 1.65 [62] 0 0 0 [59] [60] 1–15b [1] 10–2b [1] H2 Electricity price in Japan $/kWh 0.10 [63] Electricity price in Korea $/kWh 0.094 [64] a Our assumption. b
H2 recovery rate—Pressure swing absorption H2 rate.
at export terminal, shipping, intermediate storage at import terminal [ ] [ ] [ ]
and re-conversion, respectively. CAPEX of each stage is computed 𝑄𝐸 𝑡𝐻 = (𝐶 𝑡 − 𝑄 𝑡
) × 𝐶𝑦𝑐𝑙𝑒𝑠 (18) 2 𝐸 𝐻2
𝐸.𝑙𝑜𝑠𝑠𝑒𝑠 𝐻2
utilizing the ‘‘scaling factor’’ approach [53]: [ ] -Ship: ⎞𝑠𝑓 [ ] [ ] [
] ⎛⎜𝐶 tpd𝐻 𝑜𝑟𝑡 2 𝐻2 ⎟ [ ] 𝑄 𝑡
𝐶𝐴𝑃 𝐸𝑋 $ = 𝑆𝑖𝑧𝑒𝑏𝑎𝑠𝑒 tpd 𝐸 𝐻 𝐻 𝑜𝑟𝑡 ⎜ [ ] ⎟ (8) 2 2
𝐻2 ⎜ 𝐶𝑜𝑠𝑡𝑏𝑎𝑠𝑒 $ ⎟ 𝐶𝑆 𝑡𝐻 = (19) ⎝ ⎠ 2
𝐶𝑦𝑐𝑙𝑒𝑠 [ ] [ ] [ ]
OPEX is the sum of OPEX𝑓𝑖𝑥𝑒𝑑 and OPEX𝑣𝑎𝑟𝑖𝑎𝑏𝑙𝑒 : 𝑄𝑆 𝑡𝐻 = (𝐶 𝑡 − 𝑄 𝑡
) × 𝐶𝑦𝑐𝑙𝑒𝑠 (20) 2 𝑆 𝐻2
𝑆.𝑙𝑜𝑠𝑠𝑒𝑠 𝐻2 [ ] [ ] [ ]
𝑂𝑃 𝐸𝑋 $ = 𝑂𝑃 𝐸𝑋𝑓𝑖𝑥𝑒𝑑 $ + 𝑂𝑃 𝐸𝑋𝑣𝑎𝑟𝑖𝑎𝑏𝑙𝑒 $ (9) -Import terminal: [ ] [ ] [ ] 𝑄𝑠 𝑡𝐻 𝑂𝑃 𝐸𝑋 2 𝑓 𝑖𝑥𝑒𝑑
$ = %𝑂𝑃 𝐸𝑋 × 𝐶𝐴𝑃 𝐸𝑋 [%] (10) 𝐶𝐼 𝑡𝐻 = (21) 2
𝐶𝑦𝑐𝑙𝑒𝑠
-OPEX𝑣𝑎𝑟𝑖𝑎𝑏𝑙𝑒 of import/export terminal, conversion/re-conversion plant [ ] [ ] [ ] are calculated as follows: 𝑄 𝑡 = (𝐶 𝑡 − 𝑄 𝑡
) × 𝐶𝑦𝑐𝑙𝑒𝑠 (22) [ ] 𝐼 𝐻2 𝐼 𝐻2
𝐼 .𝑙𝑜𝑠𝑠𝑒𝑠 𝐻2 kWh 𝑂𝑃 𝐸𝑋 -Re-conversion plant:
𝑣𝑎𝑟𝑖𝑎𝑏𝑙𝑒[$] = 𝐶𝑖[𝑡𝑝𝑑] × 𝑆 𝐸𝐶 × 𝐸 kg
𝑝𝑟𝑖𝑐𝑒[$∕kWh] × 365 (11) [ ] H2 [ ] 𝑄𝐼 𝑡𝐻 × 24 2
Where, C𝑖 and SEC𝑖 is installed capacity and specific electricity 𝐶𝑅 tpd𝐻 = (23) 2
𝐶𝑦𝑐𝑙𝑒𝑠 ∗ 𝑡
consumption of import/export terminal or conversion/re-conversion
𝑠𝑡𝑜𝑟𝑎𝑔𝑒 [ℎ]
plant; E𝑝𝑟𝑖𝑐𝑒 is electricity price of the location under consideration. 𝑄 ] = 𝐶 ] × (1 − losses -OPEX 𝑅[𝑡𝐻2 𝑅[tpd𝐻2 𝑅) × 365 (24)
𝑣𝑎𝑟𝑖𝑎𝑏𝑙𝑒 of ship is calculated as follows: [ ] Mjfuel
Where, losses𝐶 and losses𝑅 are the losses per kgH of the conversion 2
OPEXvariable[$] = 𝐶𝑆 [𝑡] × 𝑆𝐹 𝐶
and re-conversion processes, respectively; Q ton.km
𝐸 , Q𝑆 , Q𝐼 are losses per [ ]
cycle of export terminal, ship and import terminal, respectively. $
× 2 × 𝑙[km] × 𝑆𝐹 𝐶 × Cycles (12)
The input techno-economic data for conversion and re-conversion Mjfuel
plant, export and import terminal, ship are shown in Tables 8, 9, and 10 below: 8760 [ℎ] 𝐶𝑦𝑐𝑙𝑒 = (13)
𝑡𝑠𝑡𝑜𝑟𝑎𝑔𝑒 [ℎ]
3. Result and discussion ⎛ ⎞
⎜ 𝑙 [𝑘𝑚] ⎟ 𝑡
HOMER pro simulates all possible combinations for the HRES sys-
𝑠𝑡𝑜𝑟𝑎𝑔𝑒 [ℎ] = ⎜ [
] + 𝑡ℎ𝑎𝑟𝑏𝑜𝑟 [ℎ]⎟ × 2 (14) ⎜ 𝑘𝑚 ⎟
tems and sorts them based on the NPC. The summary of techno- ⎝ 𝑣 ℎ ⎠
economic analysis for system (a) to (k) for HRES with LH2, ammonia
Where, C𝑆 is shipping capacity; SFC is specific fuel consumption;
and LOHC storage systems presented in Table 11, 12, 13 respectively.
Cycles is the number of round-trip per year; t𝑠𝑡𝑜𝑟𝑎𝑔𝑒 is the storage time
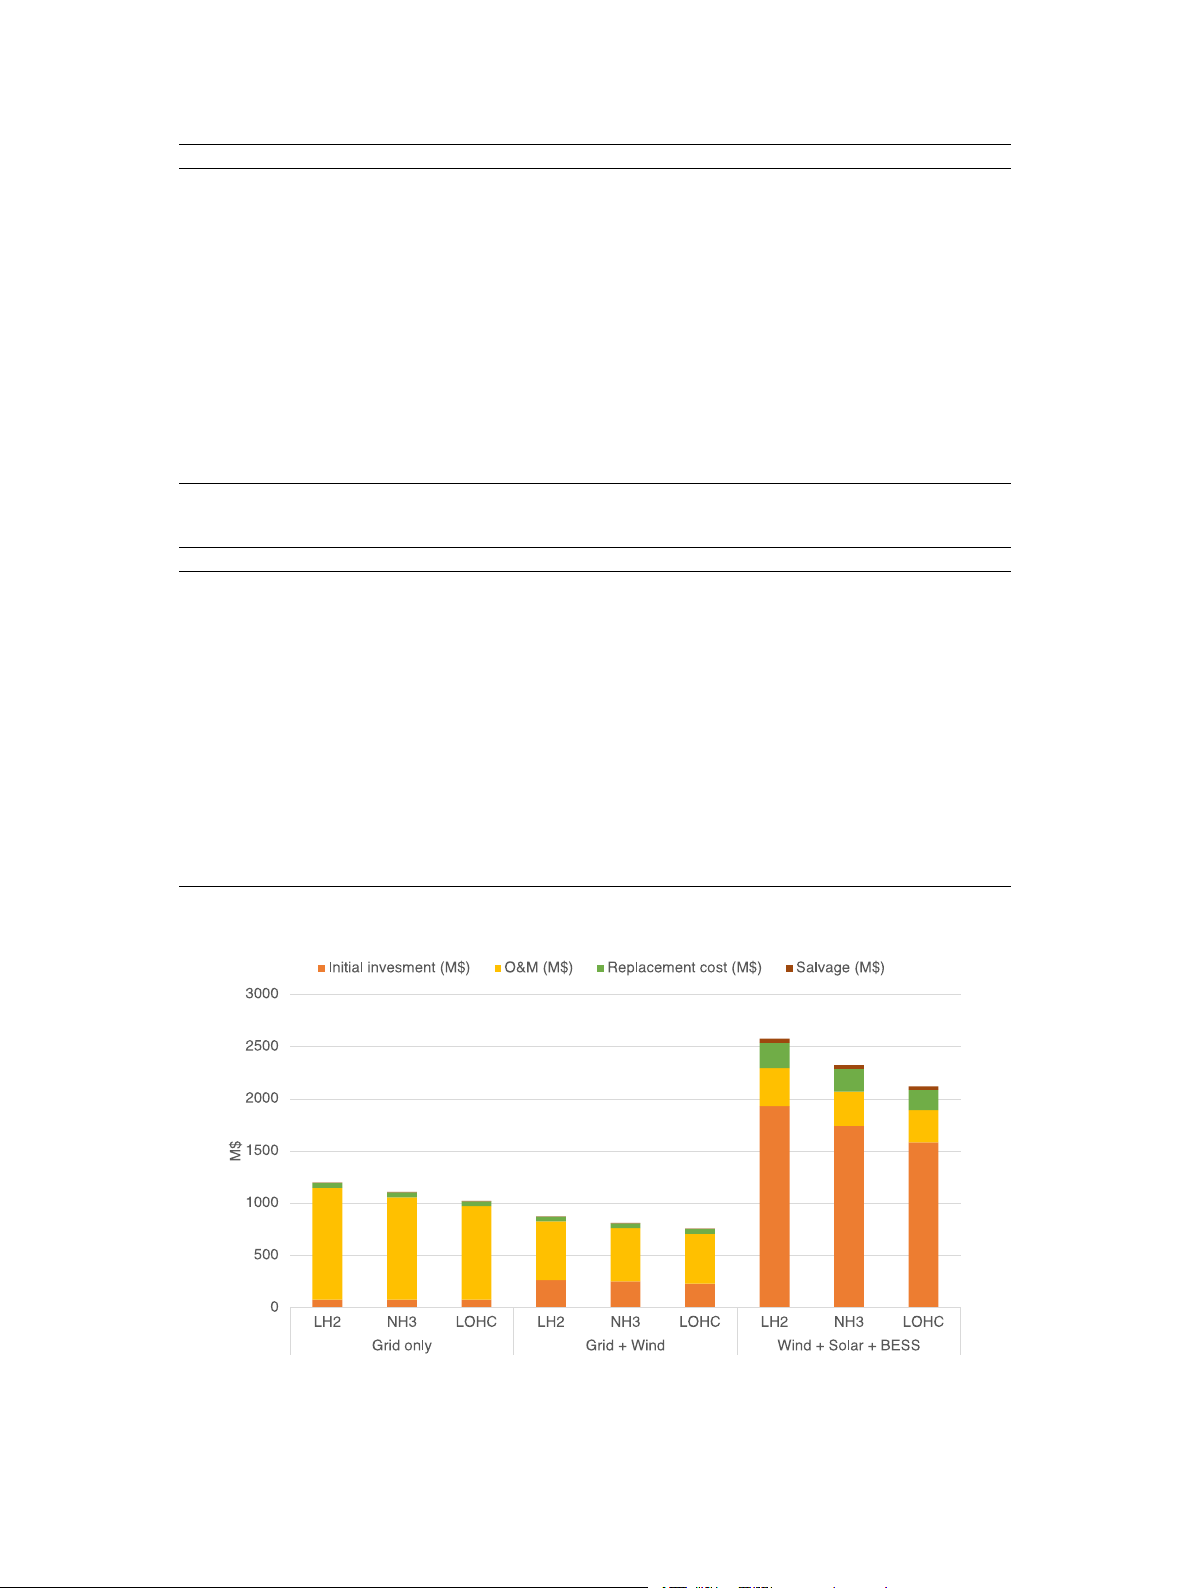
Additionally, Fig. 6 is the cost system breakdown of system (a), (b), and
at the terminal; tℎ𝑎𝑟𝑏𝑜𝑟 is the average time the ship spends at habor; l is
(k). As seen, among three options of storage hydrogen, LOHC storage
sea distance and v is ship’s velocity.
exhibits the lowest daily electricity demand, resulting in the most cost-
Installed capacity and out put calculation:
effective production, while LH2 storage has the highest production cost. - Conversion plant:
Additionally, we evaluated 10 systems from (a) to (k) three criteria [ ] 𝑡 which include: lowest LCOH [ ] 𝐻
𝑃 , lowest initial expenditure and the most 𝑄 2 𝑃 𝑎 economical off-grid system. 𝐶𝐶 tpd𝐻 = (15) 2 365
System (b) (Wind turbines + Grid) achieves the lowest LCOH𝑃 ,
specifically 2.01 $/kg, 1.86 $/kg and 1.73 $/kg with LH2, NH3 and
𝑄𝐶 [𝑡𝐻 ] = 𝐶 ] × (1 − losses
LOHC storage systems respectively. Furthermore, although renewable 2 𝐶 [tpd𝐻2 𝐶 ) × 365 (16)
energy penetration exceeds 55% in all three storage options, the max- -Export terminal: [ ]
imum grid purchase occurs with LH2 storage systems at 435.71 GWh, [ ] 𝑄
while LOHC storage systems require the lowest grid purchase of 366.47 𝐶 𝑡𝐻2
𝑡𝑠𝑡𝑜𝑟𝑎𝑔𝑒 [ℎ] 𝐶𝐸 𝑡𝐻 = × (17) GWh. 2 365 24 696 D.-C. Ta et al.
International Journal of Hydrogen Energy 65 (2024) 687–703 Table 9
Techno-economic input data for export and import terminal. Unit Export terminal Import terminal LH2 NH3 LOHC LH2 NH3 LOHC Cost base M$ 290.00 [1] 68.00 [1] 35.00 [55] 320.00 [1] 97.00 [1] 35.00 [55] Size base t 3190 [1] 6018.65 [1] 2233 [55] 3550 [1] 10007.55 [1] 2233 [55] H2 Scaling factor 1 [57] 1 [57] 1 [57] 1 [57] 1 [57] 1 [57] Lifetime Years 30 [1] 30 [1] 30 [1] 30 [1] 30 [1] 30 [1] %OPEX % 4 [1] 4 [1] 4 [1] 4 [1] 4 [1] 4 [1] SEC kWh/kg 0.042 [18] 0.01 [18] 0 [18] 0.042 [18] 0.01 [18] 0 [18] H2 Discount rate % 10 [51] 10 [51] 10 [51] 8 [1] 8 [1] 8 [1] Losses %/day 0.2 [1] 0 [1] 0 [1] 0.2 [1] 0.04 [1] 0 [1] Table 10
Techno-economic input data for ship. Unit LH2 NH3 LOHC Cost base M$ 412.00 [1] 85.00 [1] 44 [1] Size base t 11000 [1] 9354.5 [1] 2349 [1] H2 Lifetime Years 30 [1] 30 [1] 30 [1] %OPEX % 4 [1] 4 [1] 4 [1] Fuel consumption MJ/ton.km 0.07 [6] 0.07 [6] 0.07 [6] Fuel cost $/MJ 0.01011 [65] 0.01011 [65] 0.01011 [65] Velocity km/h 30 [1] 30 [1] 30 [1] Harbor time h 24a 24a 24a
Sea distance (Vietnam to Kobe port) km 5138b 5138b 5138b
Sea distance (Vietnam to Pyeongtaek) km 4816b 4816b 4816b Losses %/day 0.2 0 0 a Our assumption. b Our estimation. Table 11
Summary of the techno-economic analysis for systems (a) to (k) for HRES with LH2 storage. System (a) (b) (c) (d) (e) (f) (g) (h) (i) (k) PV (MW) – – – 190.26 706.14 73.46 171 – 2191.66 368.87 Wind (MW) – 148 368 – – 72 260 772 – 476 BESS (MW) – – 170 – 338 – 140 520 845 445 Converter (MW) 96.64 99.64 190.01 99.33 110.65 99.94 181.04 322.26 95.68 241.16 Grid purchased (GWh) 1028.68 435.71 98.6 761.46 199.84 592.09 100.58 – – – CO emission (Mton) 654.24 461.85 104.52 807.15 211.83 627.62 106.61 – – – 2 CO penalty (M$) 5.29 3.73 0.84 6.52 1.71 5.07 0.86 – – – 2 RF (%) – 56.40 90.10 23.80 80.00 40.80 90.00 100 100 100 MRF – 40% 90% 20% 80% 40% 90% 100% 100% 100% NPC (B$) 1.19 0.87 1.36 1.86 1.92 1.75 1.23 2.86 4.55 2.49 CO penalty(%) 0.44 0.43 0.06 0.35 0.09 0.29 0.07 – – – 2 Operation cost (M$/year) 81.20 44.10 33.80 66.60 39.50 104.00 27.90 53.80 61.10 41.00 Initial investment (M$) 77.90 266 89 166.67 1380.00 319.35 845.79 2124.99 3720.00 1931.46 O&M (M$) 1079.08 560.71 320.53 858.53 380.59 1384.25 289.69 428.57 499.70 362.64 Replacement cost (M$) 47.13 47.09 216.11 60.31 193.86 47.91 108.42 472.77 413.93 231.23 Salvage (M$) 2.98 3.03 72.69 5.61 32.26 3.43 15.21 163.41 76.14 41.69 LCOE ($/kWh) 0.087 0.064 0.099 0.136 0.140 0.127 0.089 0.209 0.332 0.181 LCOH ($/kg) 2.75 2.01 3.13 4.29 4.44 4.03 2.83 6.60 10.50 5.75 𝑃
Systems (a) (Grid) demonstrates the lowest initial expenditure with
to 0.44%. Therefore, these systems are still economical compared to
77.9 M$ for each storage option. There is only need for investing off-grid systems.
electrolysers, desalination equipments and converters for production
The summary of the techno-economic transmission hydrogen export
plants. However, among the ten systems considered, system (a) regis-
to Japan and Korea is shown in Table 14 .Regarding LH2 is the
ters the highest operational expenditures, reaching 68.5 M$, 74.6 M$,
highest ($3.40, 3.34/ kgH2), whereas LOHC exhibits the lowest trans- and 81.2 M$ for LOHC, NH mission cost ($2.85, 2.74/kgH
3 and LH2 storage systems, respectively,
2), and the middle value is NH3 ($2.98,
with a almost portion of these expenses attributed to grid electricity
2.88/kgH2). LH2 records the highest expenses in conversion, interme-
diate storage, and shipping, but it presents the lowest re-conversion
purchases. Among three green systems also known as off-grid systems
costs. The initial investment for an LH
(h), (j) and (k); system (k) (PV, Wind turbines and BESS) has the lowest
2, conversion plant is twice that of NH LCOH
3 and three times that of LOHC. However, the initial capital
𝑃 , specifically 5.75 $/kg, 5.19 $/kg, and 4.74 $/kg with LH2, expenditures of LH NH
2 of the re-conversion plant are significantly lower
3 and LOHC storage systems respectively. In addition, the installed
than the other two types, accounting for only about 0.6% compared to
PV power capacity consistently surpasses that of the wind turbines.
NH3 and around 1.7% compared to LOHC. Disparities in re-conversion
Notably, the CAPEX in the system (k) is around 7 to 8 times higher
costs between the two export scenarios to Japan and Korea stem from than system (b).
the sea transport distance and purchased electricity for the conversion
The carbon tax penalty is imposed on on-grid HRES configurations
plant in these countries, with the cost differences being relatively small
from (a) to (g). In their system, (a) has the highest penalty, while at $0.08–0.10/kgH2.
the opposite is true for systems (c) and (g). However, the value of
After simulating all the systems run 100% load, we selected system
the penalty accounts for a small fraction of NPC, ranging from 0.07%
(b) due to lowest LCOH𝑃 for further analysis. Fig. 7 show the varies 697 D.-C. Ta et al.
International Journal of Hydrogen Energy 65 (2024) 687–703 Table 12
Summary of the techno-economic analysis for systems (a) to (k) for HRES with NH3 storage. System (a) (b) (c) (d) (e) (f) (g) (h) (i) (k) PV (MW) – – – 176.89 641 86.97 124.08 – 2403.26 437 Wind (MW) – 136 328 – – 60 248 700 – 380 BESS (MW) – – 160 – 307 – 128 473 588 390 Converter (MW) 96.64 99.14 174.96 99.33 104.56 99.97 168.85 305.2 80.74 236.86 Grid purchased (GWh) 936.99 392.46 90.56 690.99 180.92 537.46 90.38 – – – CO emission (Mton) 595.93 416.01 95.99 732.45 191.78 569.71 95.80 – – – 2 CO penalty (M$) 4.82 3.36 0.78 5.92 1.55 4.6 0.77 – – – 2 RF (%) – 56.60 90.00 23.90 80.10 40.80 90.00 100 100 100 MRF – 40% 90% 20% 80% 40% 90% 100% 100% 100% NPC (B$) 1.10 0.81 1.25 1.77 1.76 1.57 1.12 2.62 4.15 2.25 CO penalty(%) 0.44 0.41 0.06 0.33 0.09 0.29 0.07 – – – 2 Operation cost (M$/year) 74.60 40.50 31.30 61.10 36.50 91.40 26.00 49.50 56.10 37.10 Initial investment (M$) 77.89 251.15 823 935.47 1263.32 315.92 764.41 1936.29 3373.04 1741.28 O&M (M$) 979.70 511.26 293.85 783.26 349.48 1209.51 267.83 394.10 520.92 328.46 Replacement cost (M$) 47.13 47.09 201.39 60.31 180.36 47.78 103.14 433.74 302.24 217.32 Salvage (M$) 2.98 3.03 65.84 5.61 29.57 3.36 14.15 148.58 53.87 36.92 LCOE ($/kWh) 0.088 0.065 0.101 0.142 0.142 0.126 0.090 0.210 0.333 0.182 LCOH ($/kg) 2.54 1.86 2.89 4.09 4.07 3.62 2.59 6.03 9.56 5.19 𝑃 Table 13
Summary of the techno-economic analysis for systems (a) to (k) for HRES with LOHC storage. System (a) (b) (c) (d) (e) (f) (g) (h) (i) (k) PV (MW) – – – 190.26 706.14 73.46 171 – 2136.84 430.45 Wind (MW) – 120 336 – – 56 220 696 – 352 BESS (MW) – – 152 – 264 – 123 470 532 332 Converter (MW) 96.64 99.38 176.34 98.84 110.49 98.95 220.43 303.67 35.99 240.93 Grid purchased (GWh) 851.33 366.47 90.15 625.28 162.22 481.81 82.13 – – – CO emission (Mton) 541.45 388.46 955.59 662.79 171.95 510.72 87.01 – – – 2 CO penalty (M$) 4.37 3.14 0.77 5.36 1.39 4.13 0.70 – – – 2 RF (%) – 55.70 90.10 23.50 90.2 41.1 90.00 100 100 100 MRF – 40% 90% 20% 80% 40% 90% 100% 100% 100% NPC (B$) 1.02 0.75 1.25 1.69 1.61 1.46 1.04 2.60 3.72 2.06 CO penalty(%) 0.43 0.42 0.06 0.32 0.09 0.28 0.07 – – – 2 Operation cost (M$/year) 68.50 37.90 31.40 55.9 33.5 84.2 24.8 49.3 50.50 34.50 Initial investment (M$) 77.89 230.78 816.81 919.93 1153.92 299.66 699.46 1925.06 3029.77 1581.81 O&M (M$) 895.00 476.44 296.43 712.58 323.39 1111.12 252.52 392.097 463.99 312.75 Replacement cost (M$) 47.13 47.09 199.99 60.24 161.72 47.73 101.28 431.404 277.65 192.16 Salvage (M$) 2.98 3.03 66.35 5.60 25.86 3.33 13.78 147.72 48.97 31.9 LCOE ($/kWh) 0.090 0.0670 0.101 0.150 0.144 0.130 0.092 0.210 0.332 0.182 LCOH ($/kg) 2.35 1.73 2.88 3.72 3.36 2.40 6.00 6.60 8.58 4.74 𝑃
Fig. 6. Hydrogen production system cost breakdown. 698 D.-C. Ta et al.
International Journal of Hydrogen Energy 65 (2024) 687–703 Table 14
Summary of the techno-economic analysis for hydrogen transmission in two scenarios: export to Japan and Korea (100% load). Unit Export to Japan Export to Korea LH2 NH3 LOHC LH2 NH3 LOHC Conversion Installed capacity tpdH2 47.52 47.52 47.52 47.52 47.52 47.52 Initial capital expenditures M$ 2140.41 104.29 41.70 210.41 104.29 41.70 Operation cost M$/year 8.42 2.61 4.37 8.42 2.61 4.37 Annual hydrogen converted ktH2/year 17.06 17.34 17.33 17.06 17.34 17.33
Levelised cost of hydrogen conversion $/kgH2 1.94 0.81 0.51 1.94 0.81 0.51 Export terminal Installed capacity tH2 760.5 773.36 772.14 718.69 730.52 729.7 Initial capital expenditures M$ 69.14 8.74 12.10 65.34 8.26 11.44 Operation cost M$/year 2.77 0.35 0.29 2.61 0.33 0.46
Annual hydrogen loaded onto the ship ktH2/year 16.19 16.90 16.99 16.02 16.70 16.80
Levelised cost of hydrogen storage at export terminal $/kgH2 0.62 0.08 0.10 0.64 0.07 0.10 Ship Installed capacity tH2 735.75 768.22 772.14 696.59 726.26 729.69 Initial capital expenditures M$ 27.56 6.98 14.46 26.09 6.6 13.67 Operation cost M$/year 1.22 0.98 2.71 1.15 0.91 2.52
Annual hydrogen transported by ship ktH2/year 16.11 16.90 16.99 15.95 16.7 16.79
Levelised cost of hydrogen transportation $/kgH2 0.23 0.09 0.23 0.22 0.09 0.22 Import terminal Installed capacity tH2 732.49 768.22 722.14 693.52 726.26 726.69 Initial capital expenditures M$ 66.03 7.45 12.10 62.51 7.04 11.44 Operation cost M$/year 2.71 0.39 0.49 2.56 0.37 0.46
Annual hydrogen dispensed from import terminal ktH2/year 15.59 16.79 16.99 15.46 16.60 16.78
Levelised cost of hydrogen storage at import terminal $/kgH2 0.55 0.06 0.09 0.52 0.06 0.09 Re-conversion Installed capacity tpdH2 43.55 46.9 47.45 43.71 46.94 47.45 Initial capital expenditures M$ 0.43 67.64 25.23 0.43 67.67 25.23 Operation cost M$/year 0.97 21.88 27.16 0.91 20.74 24.36 Annual re-converted hydrogen ktH2/year 15.90 14.41 15.28 15.95 14.42 14.51
Levelised cost of hydrogen re-conversion $/kgH2 0.06 1.94 1.92 0.06 1.86 1.82
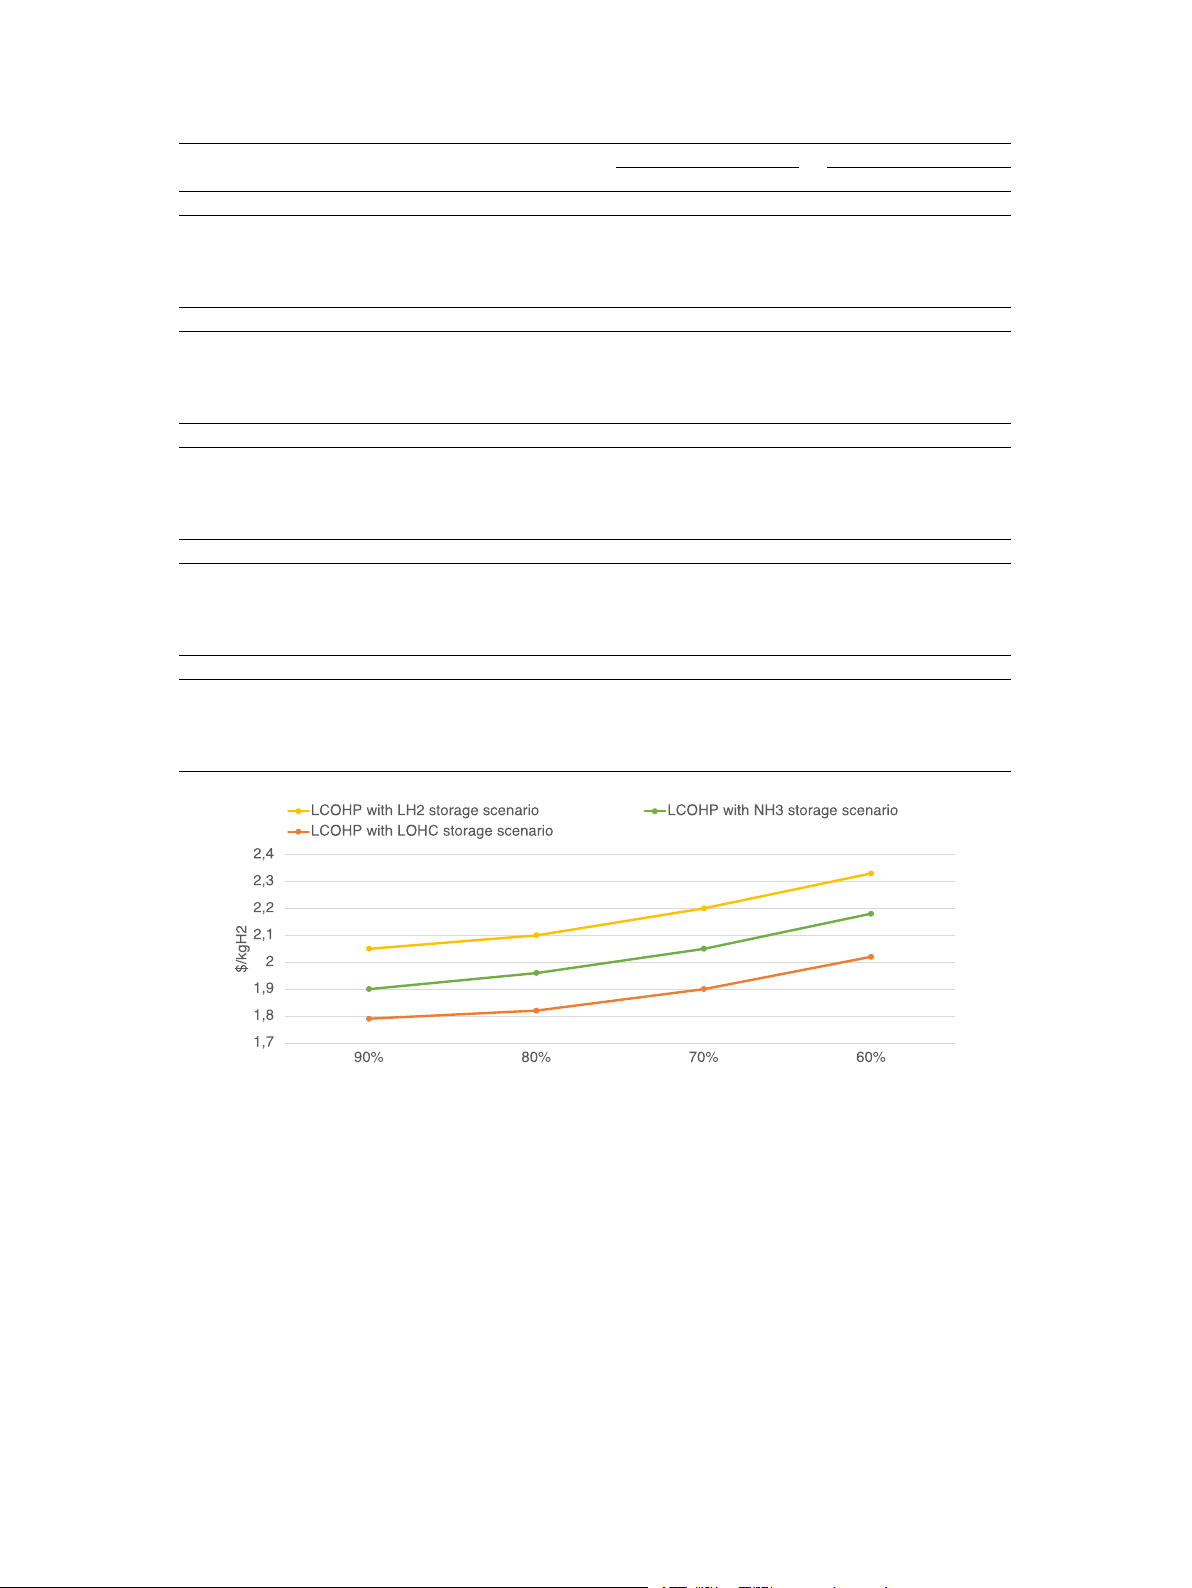
Fig. 7. Hydrogen production cost with reduction load. of LCOH •
𝑃 with three kind of storages. The results for loads of 90%,
Shipping: The shipping cost also rise highest when the ship carries
80%, 70% and 60% are presented in Table 15 for export to Japan
LH2 due to high its CAPEX. Furthermore, there is only a minimal
and Table 16 for export to Korea. Additionally, Fig. 8 and Fig. 9 show
difference in shipping costs between Japan and Korea. LCOH • Import terminal: LH
𝑇 𝑜𝑡𝑎𝑙 for Japan and Korea, respectively.
2 continually increase tremendously higher
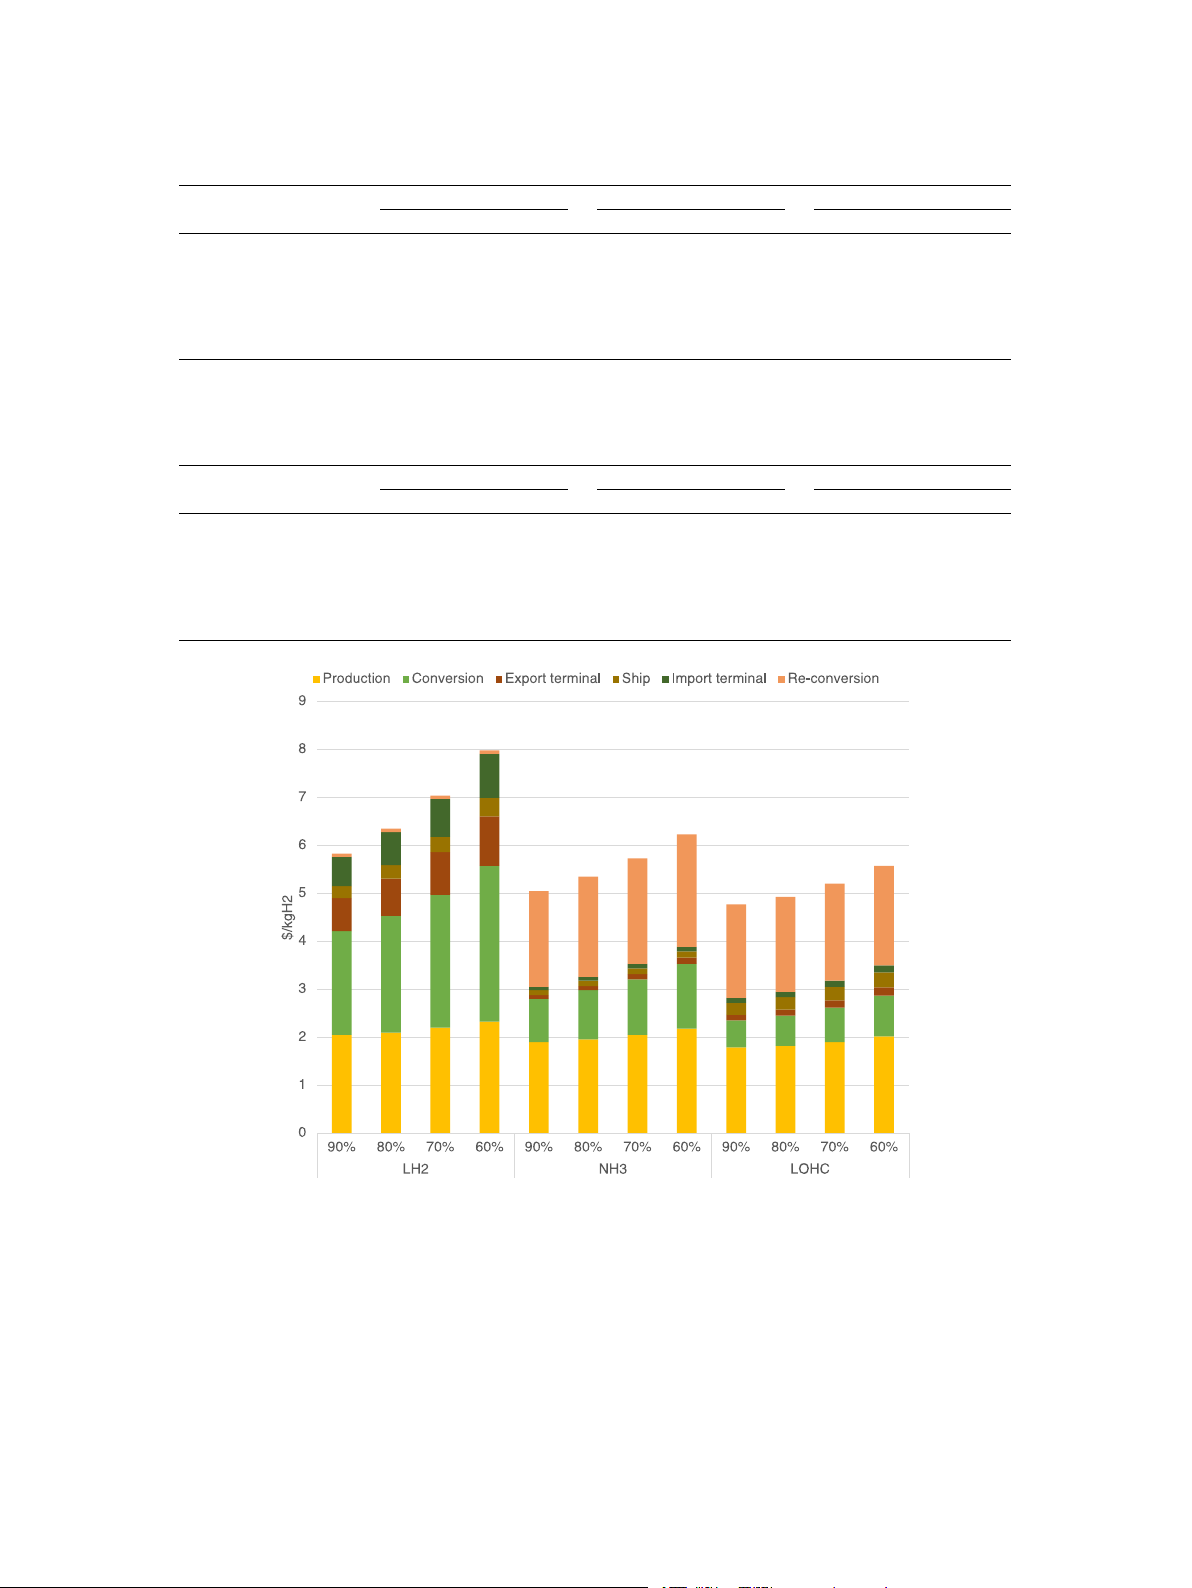
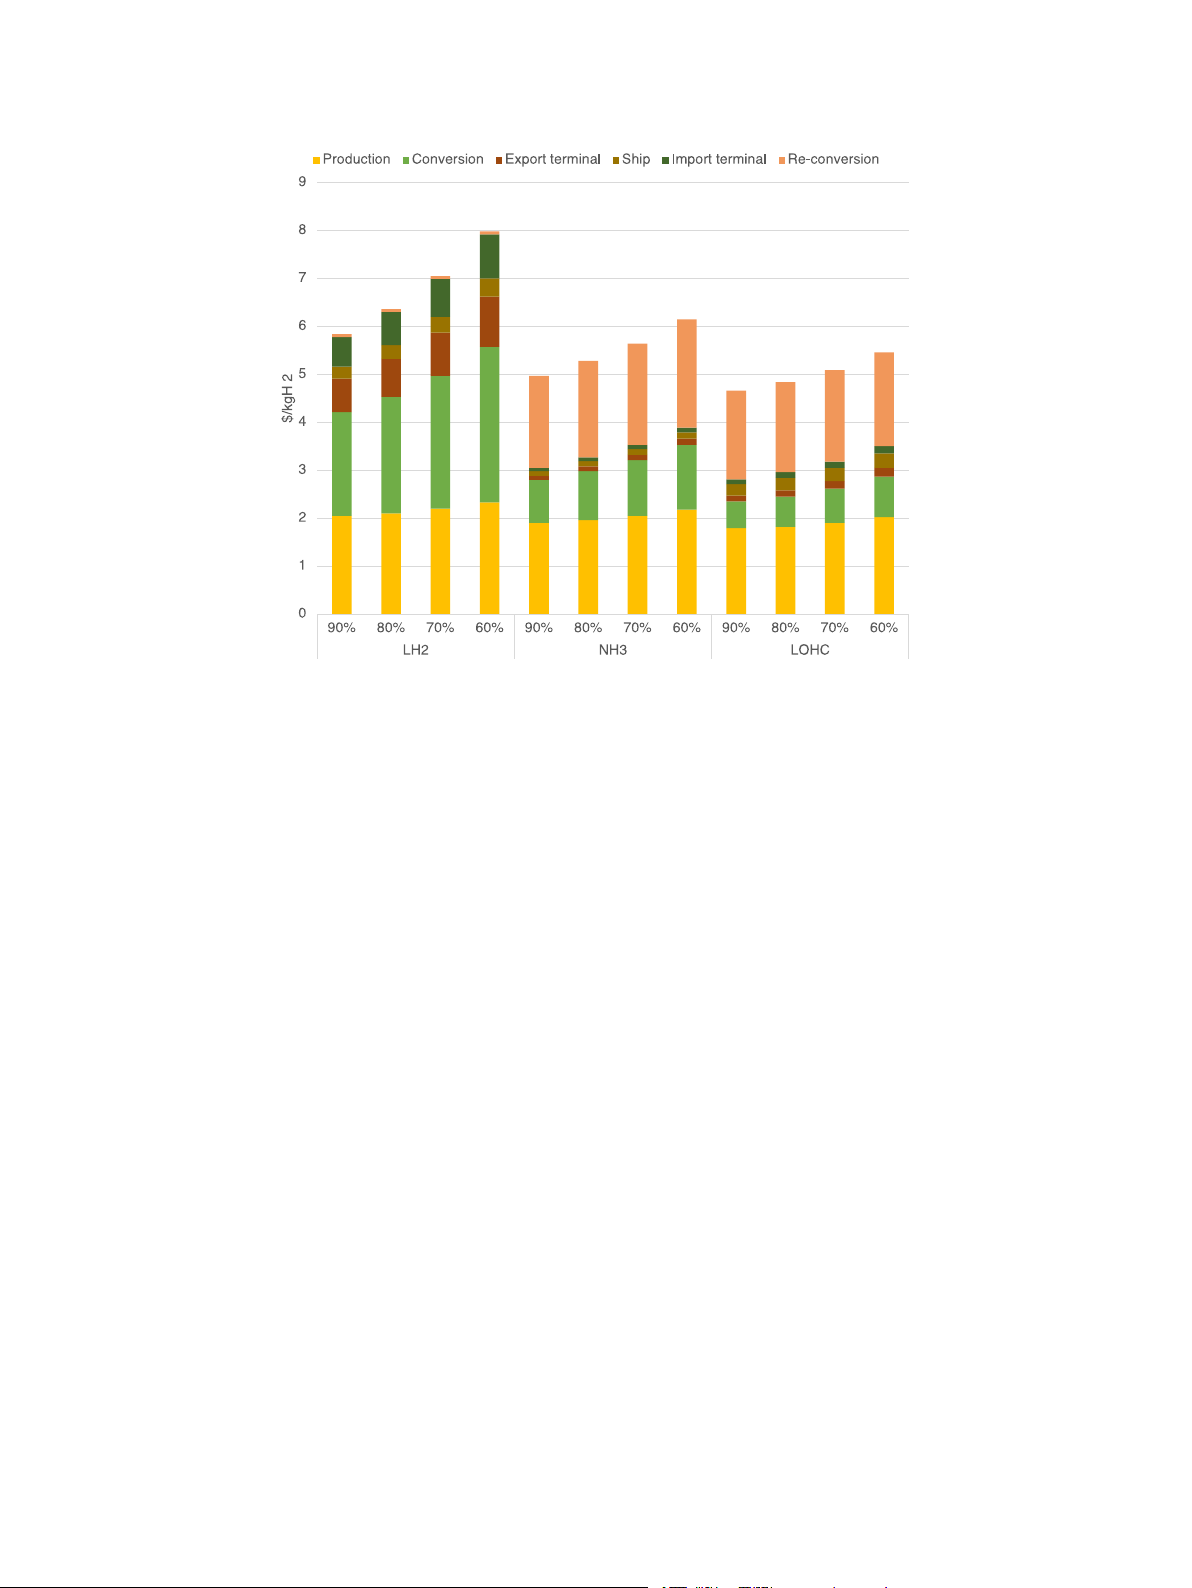
In general, as the load decreases, there is an increase in the LCOH
compared to the others and there is no clear gap between Japan 𝑇 𝑜𝑡𝑎𝑙 . The details are shown below: and Korea.
• Re-conversion: While the cost of LH2 rise tiny due to lowest • At Vietnam:
CAPEX, NH3 and LOHC rise significantly higher with $0.37/kgH2
- Production cost rise relatively small around $0.25/kgH2. and $0.12/kgH2.
- At the conversion plant, a significant difference is noticeable,
primarily stemming from the notably higher capital expenditure 4. Conclusion
(CAPEX) at the LH2 facility. As a result, a substantial difference
is observed at the LH2 plant, with an increase of $1.21/kgH2,
In this paper, we selected three options for hydrogen storage, in-
while NH3 and LOHC show respective increases of $0.48/kgH2
cluding LH2, NH3 and LOHC, then compared them. Next, a techno- and $0.4/kgH2.
economic analysis was performed for 10 hybrid renewable energy
- The same trend is seen at the export terminal where the biggest
systems (HRES) for each hydrogen storage system, both on-grid and off- change in LH2 facility.
grid. Then, we evaluated the techno-economic hydrogen transmission 699 D.-C. Ta et al.
International Journal of Hydrogen Energy 65 (2024) 687–703 Table 15
Cost for each step of hydrogen transmission with variable load (export to Japan). Unit LH2 NH3 LOHC 90% 80% 70% 60% 90% 80% 70% 60% 90% 80% 70% 60% Production $/kgH2 2.05 2.10 2.20 2.33 1.90 1.96 2.05 2.18 1.79 1.82 1.90 2.02 Conversion $/kgH2 2.16 2.43 2.77 3.24 0.90 1.02 0.11 0.13 0.12 0.13 0.15 0.17 Export terminal $/kgH2 0.69 0.78 0.89 1.04 0.08 0.09 0.11 0.13 0.25 0.26 0.28 0.31 Ship $/kgH2 0.25 0.28 0.32 0.38 0.10 0.11 0.12 0.13 0.25 0.26 0.28 0.31 Import terminal $/kgH2 0.61 0.69 0.79 0.92 0.07 0.08 0.09 0.10 0.10 0.11 0.13 0.15 Re-conversion $/kgH2 0.07 0.07 0.07 0.07 2.00 2.09 2.20 2.34 1.95 1.98 2.02 2.07 Total LCOH $/kgH2 5.83 6.35 7.04 7.98 5.05 5.35 5.73 6.23 4.77 4.93 5.20 5.57 Table 16
Cost for each step of hydrogen transmission with variable load (export to Korea). Unit LH2 NH3 LOHC 90% 80% 70% 60% 90% 80% 70% 60% 90% 80% 70% 60% Production $/kgH2 2.05 2.10 2.20 2.33 1.90 1.96 2.05 2.18 1.79 1.82 1.90 2.02 Conversion $/kgH2 2.16 2.43 2.77 3.24 0.90 1.02 1.16 1.35 0.56 0.63 0.72 0.85 Export terminal $/kgH2 0.70 0.79 0.90 1.05 0.08 0.10 0.11 0.13 0.12 0.13 0.15 0.18 Ship $/kgH2 0.25 0.29 0.33 0.38 0.10 0.11 0.12 0.13 0.24 0.26 0.28 0.30 Import terminal $/kgH2 0.62 0.69 0.79 0.92 0.07 0.08 0.90 0.10 0.10 0.12 0.13 0.15 Re-conversion $/kgH2 0.06 0.06 0.06 0.06 1.92 2.01 2.11 2.26 1.85 1.88 1.91 1.96 Total LCOH $/kgH2 5.84 6.36 7.05 7.98 4.97 5.28 5.64 6.15 4.66 4.84 5.09 5.46
Fig. 8. LCOH with load reduction (in case export to Japan).
in three main stages: conversion, shipping, and re-conversion. We also
• The carbon tax penalty is small, utilizing electricity from grid still
selected the most economical system and analyzed how the LCOH is has the lower cost.
affected by changes in load demand (from 60% to 90%). It was found
• Regarding transmission hydrogen, LH2, NH3 and LOHC rank 1st, that:
2nd and 3rd in LCOH, respectively. LH2 has the highest LCOH
and CAPEX in conversion and storage at both the export and
• LOHC exhibits the lowest LCOH due to low electricity demand for
import terminals. Regarding shipping costs, NH3 is the most
storage and low CAPEX at conversion.
cost-effective while LH2 and LOHC are nearly equal. In the re-
• Among 10 proposed systems, system (b) (WT+ Grid) demon-
conversion stage, NH3 leads with the highest LCOH, followed by
strates the lowest LCOH𝑃 . System (k) (PV + WT + BESS) which is
LOHC and finally, LH2 come in the last.
off-grid system, produce the lowest cost of green hydrogen among
• A gradual reduction in the load from 90% to 60% results in an
three systems (j), (h) and (k).
increase of LCOH for all three candidates. In both export scenarios 700 D.-C. Ta et al.
International Journal of Hydrogen Energy 65 (2024) 687–703
Fig. 9. LCOH with load reduction (in case export to Korea).
to Japan and Korea, LH2 record the most significant rise in LCOH, References
accounting for approximately $2.00/kg. Meanwhile, in the case of NH
[1] Gul T, Turk D. The future of hydrogen. International Energy Agency; 2019,
3 and LOHC, their LCOH only see a marginal increase of about
$1.30 and $0.90/kg, respectively.
https://www.iea.org/reports/the-future-of-hydrogen.
[2] Decision 500/QD-TTg 2023 national power development master plan for the
2021 - 2030 period, with a vision to 2050. 2023, https://thuvienphapluat.
Declaration of competing interest
vn/van-ban/Thuong-mai/Quyet-dinh-500-QD-TTg-2023-Quy-hoach-phat-trien-
dien-luc-quoc-gia-2021-2030-tam-nhin-2050-566461.aspx, [Last Acessed 20 December 2023].
The authors declare that they have no known competing finan-
[3] The Vietnamese government. Decision 893/QD-TTg 2023 National Energy
cial interests or personal relationships that could have appeared to
Master Plan for the 2021–2030 period. 2023, https://thuvienphapluat.vn/van-
influence the work reported in this paper.
ban/Tai-nguyen-Moi-truong/Quyet-dinh-893-QD-TTg-2023-Quy-hoach-tong-
the-nang-luong-quoc-gia-2021-2030-tam-nhin-2050-573960.aspx, [Last Acessed 20 December 2023]. Acknowledgments
[4] Tuong M. Vietnam firm breaks ground for country’s first green hydrogen plant. 2023,
https://theinvestor.vn/vietnam-firm-breaks-ground-for-countrys-
This research did not receive any specific grant from funding agen-
first-green-hydrogen-plant-d4333.html, The investor VAFIE magazine.
[5] Vy H. John Cockerill to develop hydrogen factory in Tra Vinh. 2023,
cies in the public, commercial, or not-for-profit sectors.
https://vir.com.vn/john-cockerill-to-develop-hydrogen-factory-in-tra-vinh-
Firstly, the two authors name Dang-Chuong TA and Hoang-Thanh
101998.html, Vietnam Investment Review.
LE would like to extend our deepest gratitude to their supervisor
[6] Renewable energy and energy efficiency in Viet Nam – Assessment of
Assoc.Prof Hoang-Luong PHAM whose invaluable guidance and advice green hydrogen export potential of Viet Nam. Tech. rep., Deutsche
made this work possible. His guidance and advice carried them through Gesellschaft für Internationale Zusammenarbeit (GIZ) GmbH; 2022,
https://gizenergy.org.vn/wp-content/uploads/eng-ptxrenewable-energy-and-
all the stages of writing this project.
energy-efficiency-in-viet-nam11-2-1.pdf.
With heartfelt appreciation to the team at Vietnam Initiative for
[7] Žigman D, Tomiša T, Osman K. Methodology presentation for the configuration
Energy Transition (VIET SE), the author Dang-Chuong TA wishes to
optimization of hybrid electrical energy systems. Energies 2023;16(5):2158. http:
extend thanks for the invaluable knowledge and learning opportunities
//dx.doi.org/10.3390/en16052158.
[8] Abdin Z, Mérida W. Hybrid energy systems for off-grid power supply and
acquired during the research internship. Your guidance and support
hydrogen production based on renewable energy: A techno-economic anal-
have significantly contributed to shaping my understanding of Viet-
ysis. Energy Convers Manage 2019;196:1068–79. http://dx.doi.org/10.1016/j.
nam’s energy outlook. Wishing all former staff at VIET SE continued enconman.2019.06.068. good health.
[9] Barhoumi EM, Salhi MS, Okonkwo PC, Ben Belgacem I, Farhani S, Zghaibeh M, et
Furthermore, we are immensely thankful to Dr. Mohammad Amin
al. Techno-economic optimization of wind energy based hydrogen refueling sta-
tion case study Salalah city Oman. Int J Hydrogen Energy 2023;48(26):9529–39.
Vaziri Rad for his dedicated guidance in utilizing HOMER Pro software
http://dx.doi.org/10.1016/j.ijhydene.2022.12.148. over the past year.
[10] Dokhani S, Assadi M, Pollet BG. Techno-economic assessment of hydrogen
Lastly, we would like to acknowledge and give their warmest
production from seawater. Int J Hydrogen Energy 2023;48(26):9592–608. http:
thanks to Mr. Van-Long PHAN for his dedication in providing valuable
//dx.doi.org/10.1016/j.ijhydene.2022.11.200.
[11] Statista Search Department. Number of hydrogen fueling stations for road
recommendations during the manuscript’s draft phase, guiding us in
vehicles worldwide as of 2022, by country. 2022, https://www.statista.com/
manuscript writing using LaTeX, and offering tips for the publication
statistics/1026719/number-of-hydrogen-fuel-stations-by-country/, [Last Acessed process.
20 December 2023]. Infographic. 701 D.-C. Ta et al.
International Journal of Hydrogen Energy 65 (2024) 687–703
[12] Wijayanta AT, Oda T, Purnomo CW, Kashiwagi T, Aziz M. Liquid hydrogen,
[32] Yates J, Daiyan R, Patterson R, Egan R, Amal R, Ho-Baille A, et al. Techno-
methylcyclohexane, and ammonia as potential hydrogen storage: Comparison
economic analysis of hydrogen electrolysis from off-grid stand-alone photo-
review. Int J Hydrogen Energy 2019;44(29):15026–44. http://dx.doi.org/10.
voltaics incorporating uncertainty analysis. Cell Rep Phys Sci 2020;1(10):100209. 1016/j.ijhydene.2019.04.112.
http://dx.doi.org/10.1016/j.xcrp.2020.100209.
[13] Aziz M, Oda T, Kashiwagi T. Comparison of liquid hydrogen, methylcyclo-
[33] A One-GigaWatt green-hydrogen plant: Advanced design and total installed-
hexane and ammonia on energy efficiency and economy. Energy Procedia capital costs. Tech. rep., Institute for Sustainable Process Technology
2019;158:4086–91. http://dx.doi.org/10.1016/j.egypro.2019.01.827, Innovative (ISPT); 2022,
https://ispt.eu/media/Public-report-gigawatt-advanced-green-
Solutions for Energy Transitions. electrolyser-design.pdf.
[14] Niermann M, Timmerberg S, Drünert S, Kaltschmitt M. Liquid organic hydrogen
[34] Caldera U, Breyer C. Learning curve for seawater reverse osmosis desalination
carriers and alternatives for international transport of renewable hydrogen.
plants: Capital cost trend of the past, present, and future. Water Resour Res
Renew Sustain Energy Rev 2021;135:110171. http://dx.doi.org/10.1016/j.rser.
2017;53(12):10523–38. http://dx.doi.org/10.1002/2017WR021402. 2020.110171.
[35] Cherif H, Belhadj J. Chapter 15 - Environmental life cycle analysis of water
[15] Heuser P-M, Ryberg DS, Grube T, Robinius M, Stolten D. Techno-economic
desalination processes. In: Gude VG, editor. Sustainable desalination handbook.
analysis of a potential energy trading link between Patagonia and Japan based
Butterworth-Heinemann; 2018, p. 527–59. http://dx.doi.org/10.1016/B978-0-
on CO2 free hydrogen. Int J Hydrogen Energy 2019;44(25):12733–47. http://dx. 12-809240-8.00015-0.
doi.org/10.1016/j.ijhydene.2018.12.156, Special Issue on Selected Contributions
[36] Avlonitis S, Kouroumbas K, Vlachakis N. Energy consumption and mem-
from the European Hydrogen Energy Conference 2018. Málaga, Spain. March
brane replacement cost for seawater RO desalination plants. Desalination 14th - 16th.
2003;157(1):151–8. http://dx.doi.org/10.1016/S0011-9164(03)00395-3, Desali-
[16] Armijo J, Philibert C. Flexible production of green hydrogen and ammonia
nation and the Environment: Fresh Water for all.
from variable solar and wind energy: Case study of Chile and Argentina. Int
[37] Cardella UF. large-scale hydrogen liquefaction under the aspect of economic vi-
J Hydrogen Energy 2020;45(3):1541–58. http://dx.doi.org/10.1016/j.ijhydene.
ability [Ph.D. thesis], Technische Universität München; 2018, https://mediatum. 2019.11.028.
ub.tum.de/doc/1442078/1442078.pdf.
[17] Ishimoto Y, Voldsund M, Nekså P, Roussanaly S, Berstad D, Gardarsdottir SO.
[38] Wang L, Xia M, Wang H, Huang K, Qian C, Maravelias CT, et al. Greening
Large-scale production and transport of hydrogen from Norway to Europe and
ammonia toward the solar ammonia refinery. Joule 2018;2(6):1055–74. http:
Japan: Value chain analysis and comparison of liquid hydrogen and ammonia
//dx.doi.org/10.1016/j.joule.2018.04.017.
as energy carriers. Int J Hydrogen Energy 2020;45(58):32865–83. http://dx.doi.
[39] Renewable power generation costs in 2022. Tech. rep., eBook Partnership,
org/10.1016/j.ijhydene.2020.09.017.
International Renewable Energy Agency IRENA; 2023, https://www.irena.org/
[18] Hong X, Thaore VB, Karimi IA, Farooq S, Wang X, Usadi AK, et al. Techno-enviro-
Publications/2023/Aug/Renewable-Power-Generation-Costs-in-2022.
economic analyses of hydrogen supply chains with an ASEAN case study. Int J
[40] HOMER pro Components Library. 2024, https://homerenergy.com/products/pro/
Hydrogen Energy 2021;46(65):32914–28. http://dx.doi.org/10.1016/j.ijhydene.
docs/3.15/components_library.html, [Last Acessed 24 February 2024]. 2021.07.138.
[41] Guo Y, Xiang Y. Cost–benefit analysis analysis of photovoltaic-storage investment
[19] Gallardo FI, Monforti Ferrario A, Lamagna M, Bocci E, Astiaso Garcia D,
in integrated energy systems. Energy Rep 2022;8:66–71. http://dx.doi.org/10.
Baeza-Jeria TE. A techno-economic analysis of solar hydrogen production by
1016/j.egyr.2022.02.158, ICPE 2021 - The 2nd International Conference on
electrolysis in the north of Chile and the case of exportation from Atacama Desert Power Engineering.
to Japan. Int J Hydrogen Energy 2021;46(26):13709–28. http://dx.doi.org/10.
[42] Stehly T, Duffy P. 2020 cost of wind energy review. Tech. rep., National
1016/j.ijhydene.2020.07.050, European Fuel Cell Conference & Exhibition 2019.
Renewable Energy Lab.(NREL), Golden, CO (United States); 2021, https://www.
[20] Grigoriev S, Fateev V, Bessarabov D, Millet P. Current status, research trends,
nrel.gov/docs/fy22osti/81209.pdf.
and challenges in water electrolysis science and technology. Int J Hydrogen En- [43] Canadian Solar maxpower CS6X-325P 325W Poly solar panel. 2023,
ergy 2020;45(49):26036–58. http://dx.doi.org/10.1016/j.ijhydene.2020.03.109,
https://www.solaris-shop.com/canadian-solar-maxpower-cs6x-325p-325w-
Progress in Hydrogen Production and Utilization.
poly-solar-panel/, [Last Acessed 23 December 2023]. [21] Green hydrogen cost reduction: Scaling up electrolysers to meet the
[44] Cole W, Frazier AW, Augustine C. Cost projections for utility-scale battery stor- 1.5◦ C climate goal. International Renewable Energy Agency; 2020,
age: 2021 update. Tech. rep., National Renewable Energy Lab.(NREL), Golden,
https://www.irena.org/-/media/Files/IRENA/Agency/Publication/2020/Dec/
CO (United States); 2021, https://www.nrel.gov/docs/fy21osti/79236.pdf.
IRENA_Green_hydrogen_cost_2020.pdf.
[45] He G, Ciez R, Moutis P, Kar S, Whitacre JF. The economic end of life of
[22] Mittelsteadt C, Norman T, Rich M, Willey J. Chapter 11 - PEM electrolyzers
electrochemical energy storage. Appl Energy 2020;273:115151. http://dx.doi.
and PEM regenerative fuel cells industrial view. In: Moseley PT, Garche J,
org/10.1016/j.apenergy.2020.115151.
editors. Electrochemical energy storage for renewable sources and grid balancing.
[46] Bi Directional PCS 50KW 100KW 150KW 200KW 250KW 500KW 630KW
Amsterdam: Elsevier; 2015, p. 159–81. http://dx.doi.org/10.1016/B978-0-444-
on/off grid Hybrid Inverter. 2023, https://www.alibaba.com/product-detail/ 62616-5.00011-5.
Bi-Directional-PCS-50KW-100KW-150KW_11000003409064.html?s=p, [Lass Ac-
[23] Saba SM, Müller M, Robinius M, Stolten D. The investment costs of electrolysis cessed 14 October 2023].
– A comparison of cost studies from the past 30 years. Int J Hydrogen Energy
[47] Breu M, Castellano A, Frankel D, Rogers M. Exploring an alternative
2018;43(3):1209–23. http://dx.doi.org/10.1016/j.ijhydene.2017.11.115.
pathway for Vietnam’s energy future. 2019, https://ntnuopen.ntnu.no/ntnu-
[24] Shiva Kumar S, Lim H. An overview of water electrolysis technologies for
xmlui/bitstream/handle/11250/2623195/no.ntnu%3Ainspera%3A2525165.pdf?
green hydrogen production. Energy Rep 2022;8:13793–813. http://dx.doi.org/ sequence=1&isAllowed=y. 10.1016/j.egyr.2022.10.127.
[25] Gambou F, Guilbert D, Zasadzinski M, Rafaralahy H. A comprehensive survey
[48] Do TN, Burke PJ. Carbon pricing in Vietnam: Options for adoption. Energy Clim
of alkaline electrolyzer modeling: Electrical domain and specific electrolyte
Change 2021;2:100058. http://dx.doi.org/10.1016/j.egycc.2021.100058.
conductivity. Energies 2022;15(9). http://dx.doi.org/10.3390/en15093452.
[49] Nghien cuu, xay dung he so phat thai (EF) cua luoi dien Viet Nam nam
[26] Sheffield J, Martin K, Folkson R. 5 - electricity and hydrogen as energy vectors
2018. Tech. rep., Center for ozone layer protection and low carbon economic
for transportation vehicles. In: Folkson R, editor. Alternative fuels and ad-
development; 2018, https://vepg.vn/wp-content/uploads/2020/09/1788226219_
vanced vehicle technologies for improved environmental performance. Woodhead
Bao-cao-cuoi-cung-EF-2018-FINAL_Signed.pdf.
Publishing; 2014, p. 117–37. http://dx.doi.org/10.1533/9780857097422.1.117. [50] Bieu gia ban le dien, gia ban le dien cho cac nganh san xuat.
[27] Nguyen T. White paper - Hydrogen production cost by anion-exchange membrane
2023, https://www.evn.com.vn/c3/evn-va-khach-hang/Bieu-gia-ban-le-dien-9-
water electrolysis. Tech. rep., Ionomr; 2020, https://ionomr.com/wp-content/
79.aspx, [Last Accessed 25 October 2023].
uploads/2020/06/Hydrogen-Production-Cost-by-AEM-White-Paper-2.pdf.
[51] Viet Nam energy outlook report 2021. 2022, https://vepg.vn/wp-content/
[28] Patonia A, Poudineh R. Cost-competitive green hydrogen: How to lower
uploads/2022/06/Vietnam-Energy-Outlook-Report-2021-English.pdf.
the cost of electrolysers? Tech. rep., The Oxford insitute for energy stud-
[52] Vietnam inflation rate. 2023, https://tradingeconomics.com/vietnam/inflation-
ies; 2022, https://www.oxfordenergy.org/publications/cost-competitive-green- cpi, Trading economics.
hydrogen-how-to-lower-the-cost-of-electrolysers/.
[53] Zauner A, Rosenfeld D, Tichler R. Analysis on future technology options and
[29] Ursua A, Gandia LM, Sanchis P. Hydrogen production from water electrolysis:
on techno-economic optimization. Store Go 2019;7:2–89, https://erig.eu/wp-
Current status and future trends. Proc IEEE 2012;100(2):410–26. http://dx.doi.
content/uploads/2023/02/2019-07-04_STOREandGO_D7.7_accepted.pdf.
org/10.1109/JPROC.2011.2156750.
[54] Bartels JR. A feasibility study of implementing an Ammonia Economy. Iowa
[30] Koponen J. Review of water electrolysis technologies and design of renewablehy- State University; 2008,
https://dr.lib.iastate.edu/server/api/core/bitstreams/
drogen production systems [Master’s thesis], Lappeenranta University of Tech-
c0443ee4-2e07-4213-9dbd-ee251dad41ec/content.
nology; 2015, https://lutpub.lut.fi/bitstream/handle/10024/104326/MScThesis_
[55] Lanphen S. Hydrogen import terminal: providing insights in the cost of supply JKK.pdf?sequence=2.
chain elements of various hydrogen carriers for the import of hydrogen [Ph.D. [31] Large-scale water electrolysis for green hydrogen production.
thesis], MsC thesis, TU Delft, Delft; 2019, https://repository.tudelft.nl/islandora/ Tech. rep., Thyssenkrupp,
https://ucpcdn.thyssenkrupp.com/_binary/
object/uuid%3Ad2429b05-1881-4e42-9bb3-ed604bc15255.
UCPthyssenkruppBAISUhdeChlorineEngineers/en/products/water-electrolysis-
[56] Hydrogen delivery scenario analysis model (HDSAM). Argonne National
hydrogen-production/210622-gH2-product-brochure.pdf.
Laboratory, https://hdsam.es.anl.gov/index.php?content=hdsam. 702 D.-C. Ta et al.
International Journal of Hydrogen Energy 65 (2024) 687–703
[57] Amos WA. Costs of storing and transporting hydrogen. Tech. rep., Golden, CO
[62] Stolzenburg K, Mubbala R. Hydrogen liquefaction report. 2013, https://www.
(United States: National Renewable Energy Lab.(NREL); 1999, https://www.nrel.
idealhy.eu/uploads/documents/IDEALHY_D3-16_Liquefaction_Report_web.pdf, gov/docs/fy99osti/25106.pdf.
Integrated design for demonstration of efficient liquefaction of hydrogen
[58] Humphreys KK. Project and cost engineers’ handbook. CRC Press; 2004, http: (IDEALHY), FCH JU.
//dx.doi.org/10.1201/9780849390388.
[63] Otsuka A. Regional data on electricity consumption and electricity prices
[59] Reuß M, Grube T, Robinius M, Preuster P, Wasserscheid P, Stolten D. Seasonal
in Japan. Data Brief 2023;50:109467. http://dx.doi.org/10.1016/j.dib.2023.
storage and alternative carriers: A flexible hydrogen supply chain model. Appl 109467.
Energy 2017;200:290–302. http://dx.doi.org/10.1016/j.apenergy.2017.05.050.
[64] South Korea industry faces biggest electricity price hike since 1980. 2022,
[60] Reuß M, Grube T, Robinius M, Stolten D. A hydrogen supply chain with spatial
https://asia.nikkei.com/Business/Energy/South-Korea-industry-faces-biggest-
resolution: Comparative analysis of infrastructure technologies in Germany. Appl
electricity-price-hike-since-1980, Nikkei Asia.
Energy 2019;247:438–53. http://dx.doi.org/10.1016/j.apenergy.2019.04.064.
[65] Nolan Ruas Rego Canha A, Dogliani P. Tool to assess the cost of hydrogen
[61] Sekkesæter Ø. Evaluation of concepts and systems for marine transportation
considering its supply chain:A case study of Germany, France and Spain
of hydrogen [Ph.D. thesis], Master Thesis, NTNU, Trondheim, Norwegen;
until 2030 [Master’s thesis], KTH Royal Institute of Technology; 2023,
2019, https://ntnuopen.ntnu.no/ntnu-xmlui/bitstream/handle/11250/2623195/
https://upcommons.upc.edu/bitstream/handle/2117/390514/finalthesis.pdf?
no.ntnu%3Ainspera%3A2525165.pdf?sequence=1&isAllowed=y. sequence=2&isAllowed=y. 703
Document Outline
- An assessment potential of large-scale hydrogen export from Vietnam to Asian countries: Techno-economic analysis, transport options, and energy carriers' comparison
- Introduction
- Materials and Methods
- Site selection and renewable sources description
- Load profile
- Electrolyzer
- Desalination
- Hydrogen conversion electricity demand
- Power components description
- Solar PV, wind turbine, battery and converter
- Grid
- Carbon emissions cost
- HRES with grid
- Economic aspects
- Scenario simulation
- Estimating conversion/re-conversion, intermediate storage (on import and export side) and shipping cost
- Site selection and renewable sources description
- Result and discussion
- Conclusion
- Declaration of competing interest
- Acknowledgments
- References
Tài liệu liên quan:
-

Bộ não của Phật - Sách kĩ năng sống
9 5 -

Enhancing consumer online purchase intention through gamification in China: Perspective of cognitive evaluation theory
44 22 -
Tạp chí quản lý môi trường - Gamification: Dự đoán hiệu quả của các yếu tố thiết kế trò chơi đa dạng nhằm thúc đẩy hành vi tiết kiệm năng lượng của người dùng một cách nội tại
114 57 -

An Investigation into the Influence of Embodied Agents on the Social Presence Between Humans in Virtual Reality Rowing
90 45 -

At the Speed of the Heart: Evaluating Physiologically-Adaptive Visualizations for Supporting Engagement in Biking Exergaming in Virtual Reality
82 41