Ảnh hưởng của giá dầu | Kinh tế vi mô | Đại học Khoa học Xã hội và Nhân văn, Đại học Quốc gia Thành phố HCM
Trường Đại học Khoa học Xã hội và Nhân văn cung cấp nhiều môn học phong phú như Ngôn ngữ học đối chiếu, Phong cách học, Kinh tế học Vi mô, Lịch sử Việt Nam, Xã hội học, Tâm lý học, Văn hóa học và Ngữ văn Trung Quốc. Các môn học này giúp sinh viên phát triển kiến thức chuyên môn, kỹ năng phân tích và nghiên cứu, chuẩn bị tốt cho công việc và nghiên cứu sau khi ra trường.
Môn: Kinh tế học - Kinh tế vi mô 16 tài liệu
Trường: Trường Đại học Khoa học Xã hội và Nhân văn, Đại học Quốc gia Thành phố Hồ Chí Minh 1.2 K tài liệu
Tác giả:


Preview text:
Zaher and Maayan, J Glob Econ 2015, 3:2 DOI: DOI: 10.4172/2375-4389.1000136 Journ al of Globa l Econo mics Research Article Open Access
The Impact of Global Oil Prices on the Israel’s GDP Per Capita: An Empirical Analysis
Zaher Z1* and Maayan S2
Department of Economics, University of Haifa, Israel Abstract
This paper investigates the relationship between the global oil price and Israel economy based on a quarterly time
series data from 1988:Q3 to 2013:Q4, using the method of Vector Error Correction Model (VECM) by using a number
of lags for six endogenous variables and a dummy variable. The results show that there is no signi昀椀cant impact of oil price
shocks on Israel GDP. It’s found that the global oil price is exogenous to Israeli economy and that Israel is not
materially affected by oil prices and the economy is not affected in times of rising oil prices.
Keywords: Global oil prices; Empirical analysis; Israel nal
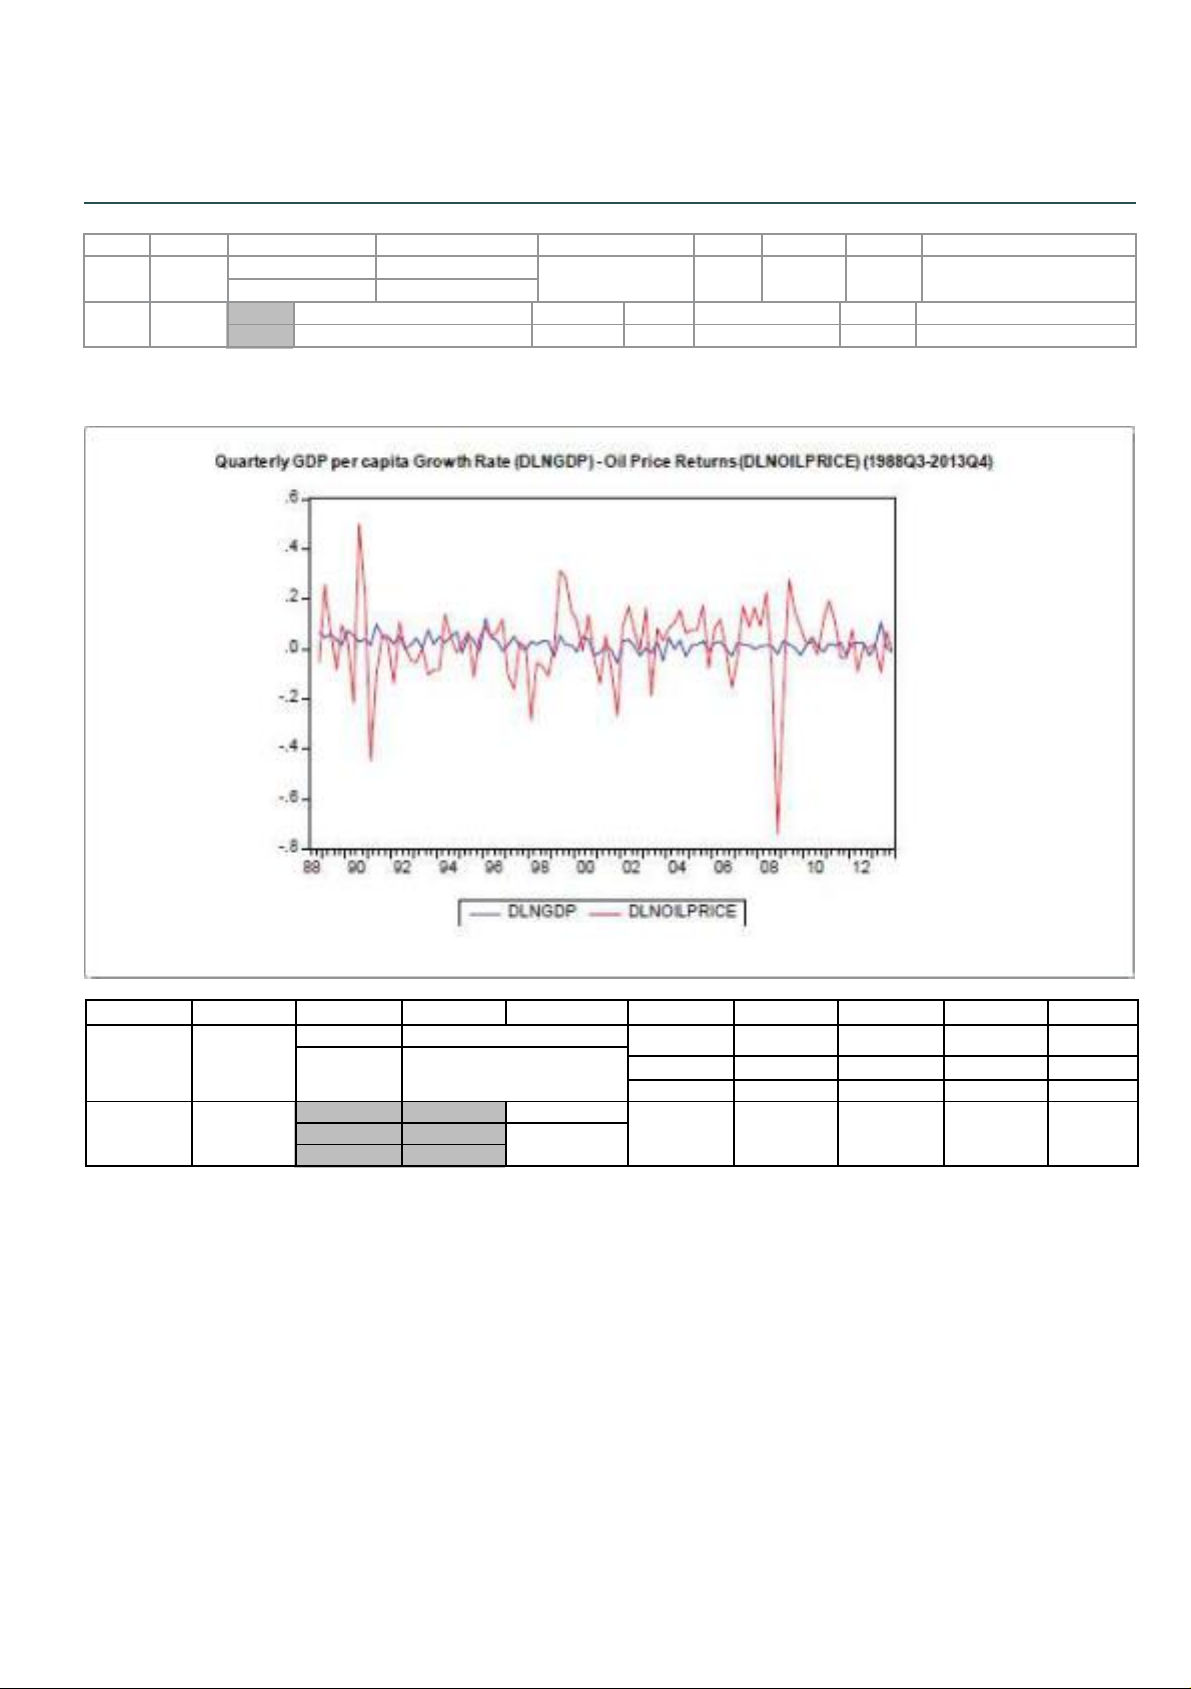
imports to Israel (Figure 2). e gure above shows a large amount of
energy consumption; OPEC cartel
imported petroleum products during the 90’s, compared to a Introduction
relatively low amount of coal imported. Since 2000 there is an
interesting trend when coal import increase, oil imports maintains a
A large amount of researchers have investigated the relationship
permanent trend and falling slightly. is trend may be related to high
between oil price shocks and economic activities of developed countries
oil prices that prevailed in early 2000 that led Israel to use coal as a
since the rst oil crisis of 1970’s, but only a few studies have mentioned
substitute for oil in these years. However, over the last twenty
Israel. In fact, a study that examines the connections between global oil
years, oil continues to be the main energy source in Israel.
prices to economic growth focuses on Israel haven’t conducted yet. As of
2009, Israel’s oil supply estimated at 1940 billion barrels. e implication of
this fact is that Israel signi cantly dependent on foreign energy suppliers, in
order to provide its energy needs. However, in 2009 Israel imported
petroleum products accounted for approximately 59% of Israel nal energy
consumption. Israel imports most of its oil consumption from Russia, Mexico
and Africa. In the Last twenty years, states located along the Caspian Sea,
especially Azerbaijan and Kazakhstan have become large energy providers
for Israel. ese countries provide Israel oil barrels type “Brent” that produced
primarily in the North Sea [1]. Import of oil is a signi cant expense to the
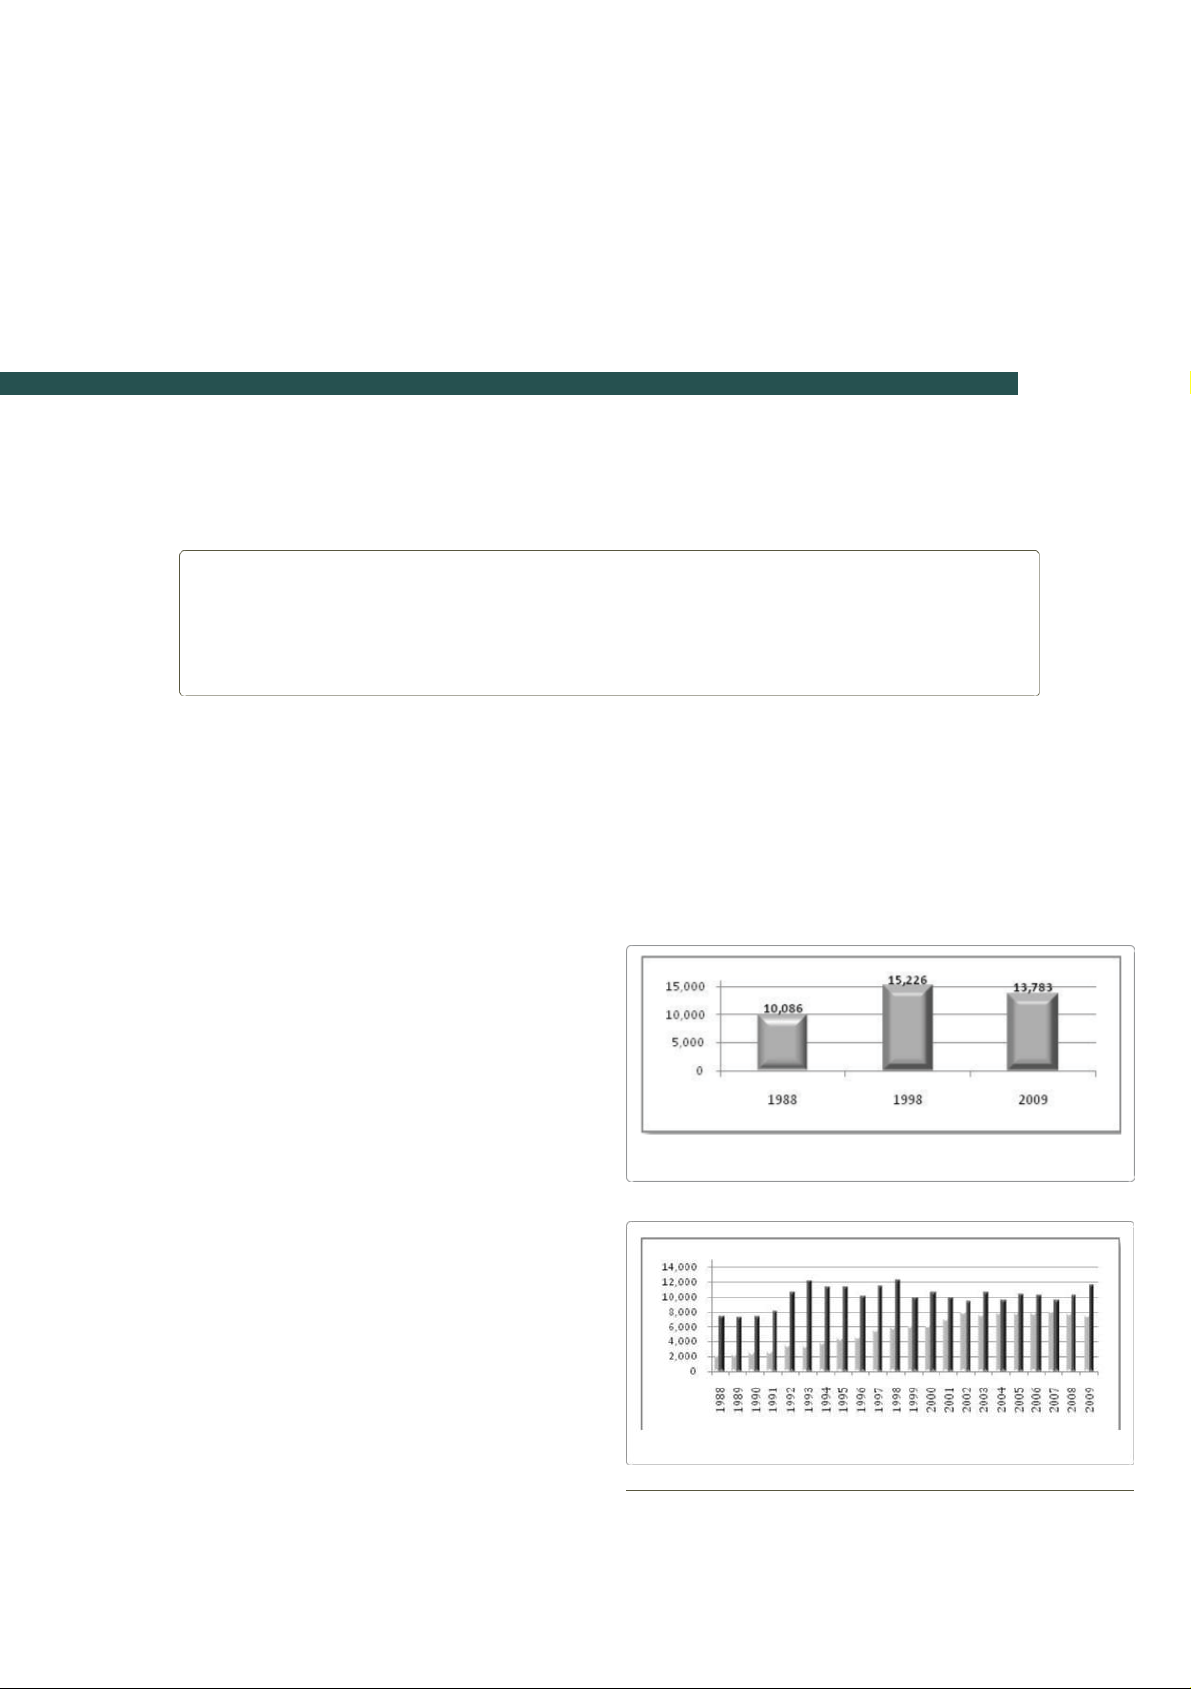
Figure 1: Israel imports of petroleum products (thousands of tons) Central
State of Israel, and changes in oil price have may cause implications on Bureau of Statistics.
Israel’s entire economy. In fact, one
-dollar increase in the price of an oil
barrel results an additional expense of 65 million dollars annually to the
Israeli economy [2]. Additionally, in the early 90’s, attempts were made to
discover oil reserves in Israel, but were badly depleted reservoirs around
the Dead Sea and the Mediterranean coast. In order To deal with this
situation, Israel, like many countries that consume imported energy
products, formulated energy policy. is policy encourages local production of
energy products such as natural gas, solar energy, wind power and
integration of these types of energies for local industrial use. Additional goal
of this policy is to increase oil inventory accumulation and preservation.
Moreover, the Di culty of nding oil in Israel and the import dependency has
brought Israel a great interest in searching for an alternative energy source
such as natural gas. Indeed, in 2005, Israel signed an agreement for the
Figure 2: Oil and coal imports (thousands of tons).
transfer of gas from El-Arish in Egypt to Ashkelon via an underwater
pipeline. e agreement committed Egypt to supply gas amount of 60 billion
cubic feet to Israel. In addition, many gas Drilling were established along the
*Corresponding author: Zaher Z, Department of Economics, University of Haifa,
coast of Israel [1] (Figure 1). is gure shows a comparison of importing
Israel, Tel: +972 4-824-0111; E-mail: zaher.89@gmail.com
petroleum products over three decades in Israel. A er an increase in oil
Received November 15, 2014; Accepted April 13, 2015; Published April 23, 2015
Import in the 90’s, the trend was reversed and Israel import Petroleum
products declined in the 2000’s. Perhaps this trend can be attributed to gas
Citation: Zaher Z, Maayan S (2015) The Impact of Global Oil Prices on the
Israel’s GDP Per Capita: An Empirical Analysis. J Glob Econ 3: 136.
transfer agreement signed with Egypt in 2005. Another reason may be due doi:10.4172/2375-4389.1000136
to the rise of oil prices in the early 2000’s, which led to a decline in oil
Copyright: © 2015 Zaher Z, et al. This is an open-access article distributed under
the terms of the Creative Commons Attribution License, which permits
unrestricted use, distribution, and reproduction in any medium, provided the
original author and source are credited. J Glob Econ
ISSN: 2375-4389 Economics, an open access journal
Volume 3 • Issue 2 • 1000136 lOMoAR cPSD| 41487147
Citation: Zaher Z, Maayan S (2015) The Impact of Global Oil Prices on the Israel’s GDP Per Capita: An Empirical Analysis. J Glob Econ 3: 136. doi:10.4172/2375-4389.1000136 Page 2 of 7
Development of oil prices during the years 1960-2012
organizations have tried to assess the implications of oil price shocks on
GDP and economic policies of di erent countries. Many studies have been
In September 1960, oil producing countries in the Middle East
conducted on this topic and found a connection between GDP growth and
established OPEC cartel. e purpose of the cartel was to ensure fair prices
oil price shocks. In recent years, there have been many studies on the
for oil producing countries, through coordination between them. e
relationship between oil prices and the global economy of di erent countries.
organization includes all Persian Gulf oil producers: Saudi Arabia, Iran, Iraq,
ese papers revealed di erent results regarding the relationship between oil
Kuwait, United Arab Emirates and Qatar. In 1973, during Yom Kippur war,
price shocks and the economy of various countries [6]. A comprehensive
the oil cartel countries boycotted Western countries due to their support of
study examining nine industrialized countries, OECD members, found that
Israel during the war, and later the organization decided to raise the price of
there is a connection between oil price shocks and GDP growth. Countries
an oil barrel. During the 70’s, OPEC cartel dictated rising oil prices, without
were divided to oil importer countries including United States, Japan,
setting output quotas. e increase in oil prices during the 70’s and early 80’s
Canada, France, Italy, Germany and the European Union, and oil exporting
started the global energy crisis. Rising oil prices and the economic crisis
countries, including Britain and Norway. e results were expected to di er in
that attacked Western countries led to a series of an e ciency measures in
oil-importing and oil-exporting countries. e research hypothesis was that
these countries. Political power concentrated in the Gulf region, led to the
since oil is a basic input in manufacturing many products, mainly in the
search and discovery of oil in the North Sea as well as experience in the
industry, the rising oil costs will lead directly to an increase in production
development of alternative energy sources. ese steps led to solve the crisis
processes, which cause a reduction in products produced by rms. In
in the late 80’s. Indeed, oil prices fell from 40$ at peak to 7$ per barrel in
addition, the products getting more expensive cause a decrease in
1986. In the next years oil prices continued to be volatile [2]. During 1999,
disposable income of consumers and reduce investment. Moreover, volatility
the price of oil increased from 12.5$ to $ 27 per barrel. e dramatic price
in oil prices also a ect the capital markets, exchange rates and in ation, and
increase was primarily due to increasing demand for oil from industrial
all of these in turn also e ect on real economic activity in the economy. e
countries in Asia. e world’s major oil importers, including the United States
results were partly predictable and partly surprising. For oil importer
exerted pressure to increase OPEC’s quotas in attempt to lower the price of
countries it’s found that a decrease in oil prices has a positive and similar e
oil, but even a er increasing the quota, the price of oil continued to rise.
ect in all countries except Japan. In the case of an increase in oil prices in
Rapid development of Asian countries and the increase in demand for oil
the short term the e ect is negative, while Japan is a ected positively. Among
caused demand to rise faster than the supply and allowed the rise in oil
the oil importers countries in the article, the rise in oil prices a ects mostly on
prices. Additionally, oil production in the North Sea and Russia was a ected
the U.S. economy. In fact, it was found that increase of 100% in oil price
by the increased prices of the OPEC cartel, which became the world’s
causes a loss of 3.2% of GDP to U.S. among oil exporter’s countries,
dominant oil supplier. As an emergency measure U.S. government
primarily the United Kingdom; the results obtained are not expected. UK
announced the release of its oil inventories in order to lead a decline in
GDP fell by 1% when oil prices increased by 100%, while a decline of 100%
prices, which continued to rise [3]. Over the past decade, until July 2008,
in oil prices cause 6% growth in GDP. In general, more pronounced e ects
there was a continuous increase in oil prices. e average oil price of the
were found when oil prices are rising, and mostly among oil-importing
OPEC cartel in July 2008 was 131$ per barrel, the highest price so far. e
countries [7]. A research conducted in 2010 on the relationship between oil
main reason for the high price was a rapid growth in the global economy,
prices and the macroeconomic of China, found an impact of oil prices on
which resulted in a substantial increase in demand from East Asian
China’s GDP. e study examined the impact of oil prices on China, and also
countries. Another reason is speculation on the price of oil and the fear from
examined whether China’s economy, evolving rapidly, have an impact on
harming the Gulf oil resources in the case of a con ict between the United
the global oil prices. e results found are in contrast to most developed
States and Iran. Rising oil prices caused in ation in various countries. At the
countries studied in the past. It was found that GDP growth in China
end of 2008, the trend reversed, and the price of oil dropped to 38$. is was
positively correlated with oil prices. In fact, a 100% increase in world oil
followed by a decline in oil demand and expectations of negative growth of
prices, causing China’s GDP growth of 9%. Possible explanation for these
the global economy following the sub - prime crisis in United States. In
results is the monetary policy of China’s government, resistant to shocks
2009, oil prices rebounded and the price was 58$ per barrel
such as those of oil prices. As for the hypothesis that China’s economy a
ects oil prices, it’s found that the world oil price is still exogenous to Chinese
economy and China’s economy can’t impact oil prices because of the fact
[4]. In early 2010 the price has stabilized around $70 per barrel, and
that China is still largely dependent on imports of oil from foreign countries
later that year jumped to 97$ per barrel. Oil prices continued to rise
[8]. Similar research was conducted in Spain in order to study the
until the mid-2011 and reached a peak of 120$, due to a decrease in oil
relationship between oil prices, GDP and in ation at 17 districts of the state
production in the North Sea. In the second half of 2011 and 2012 the
in 2011. e research hypothesis was that a strong relationship between
oil price was volatile ranging from 100$-115$ per barrel, while the end
Spain’s economy and oil prices shocks will be found, since in 2008 the
of 2012 the price of oil barrel type “Brent” was 108$ [5].
demand for oil and its products in Spain accounted for 46.9% of the total Literature Review
demand, and most of it came from imports. e results obtained indicate that
Spain continues to be signi cantly dependent on oil and its products
Organization of the Petroleum Exporting Countries (opec) a
compared to other European countries. Although previous papers have
permanent, international organization headquartered in Vienna,
shown that the e ect of uctuations in oil prices on industrialized countries is
Austria, was established in Baghdad, Iraq on 10-14 September 1960.
diminishing since 1970, this article found a re-impact of these shocks on the
Its mandate is to “coordinate and unify the petroleum policies” of its
economy of Spain. Moreover, it was found that the e ect of oil prices on the
members and to “ensure the stabilization of oil markets in order to
manufacturing industry in Spain is very strong, as it’s the main consumer of
secure an e cient, economic and regular supply of petroleum to
petroleum in the country [9]. Another study, published in 2011 and deals
consumers, a steady income to producers, and a fair return on capital
with the economy of Turkey, support the
for those investing in the petroleum industry. e oil crisis in the 70’s and
the subsequent recession led to a numerous studies on the relationship
between uctuations in oil prices and macroeconomics. Global research J Glob Econ
ISSN: 2375-4389 Economics, an open access journal
Volume 3 • Issue 2 • 1000136 lOMoAR cPSD| 41487147
Citation: Zaher Z, Maayan S (2015) The Impact of Global Oil Prices on the Israel’s GDP Per Capita: An Empirical Analysis. J Glob Econ 3: 136. doi:10.4172/2375-4389.1000136 Page 3 of 7
results presented in previous articles. Turkey is a small open economy
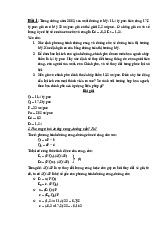
distributions of D (LNGDP) and D (LNOILPRICE) using the quarterly
that is highly dependent on imports of energy sources like oil and gas,
data during the period 1988:Q3-2013:Q4 (Figure 3). Now, we will
and imports about two-thirds of the total energy consumption of the
investigate the simple linear regression model between D(LNGDP) and
country. Conclusions arise from the study shows that in general the e
D(LNOILPRICE) by using the two following models (Table 2) shows the
ect of oil price shocks on the economy of Turkey is broad and negative,
results for the two estimated models (Model 3and Model 4). In this
as expected. In fact, uctuations in oil prices a ect the economy not only
case, it is noticed that the estimation results of both models coe cients
through direct channels, but also through indirect channels. For an
are all non-signi cant except for the intercept in model
example, it’s found that the increase in oil prices leads to a rise in
(3). In addition, the coe cients of determination R² is very low what
prices of imported goods and the increasing burden of external debt of
indicates a bad adjustment of this model. Hence, we can conclude
Turkey, which in turn a ect, negatively, on GDP growth in the country
that the relation between the economic growth and the oil price
[10]. Despite the ndings presented above, a study from 2010, which
cannot be a direct linear regression model. Due to this conclusion
examined the weakening relationship between macroeconomics and global
we are required to think of a model containing more than two
oil prices, brought interesting results. e ndings revealed that since the 80’s
variables for measuring the impact of oil price on the Israeli
we experience slow shocks and weaker relationship to oil prices comparing
economic growth such as VAR (Vector Autoregressive) model.
to shocks occurred in the 70’s. e weakening of the uctuations in oil prices VAR model
allow rms and households adjust to oil prices gradually and thus the
damage to the economy is decreasing. However, when the researchers
e VAR model had become one of the leading approaches
focused on the rise of oil prices, it was found that despite the weakening of
employed in analysis of the dynamic economic systems, especially
oil price shocks, their impact on the macro-economy in many countries have
in research about the interactions between oil price shocks and
increased steadily since the early 80’s
macro-economic [8]. Recent empirical papers guide us to establish
[11]. Finally, a study conducted in 2010, about the relationship
rstly, the possible existence of relationship between GDP growth
between shocks in oil prices to Middle East countries including Israel,
rate, oil price, interest rate, exchange rate, number of employees
found that Israel and other countries such as Bahrain, Egypt, Morocco,
and the average wage. And secondly, the possible existence of bi-
Tunisia and Jordan, are not materially a ected by oil prices and their
directional causality between these variables, consequently, the
economies is not signi cantly a ected in times of rising oil prices [12].
VAR model appears to be an appropriate estimation Tool for our
Our research hypothesis that a weak relationship between Israel
study. Consider the following VAR model of order (p):
economy and oil prices shocks will be found, since in 2009 Israel p
imported petroleum products amounting to 59% of its nal energy Y = c + Y + ε t ∑φi t − i t
consumption, and most of it come from imports. i =1
Methodology and Empirical Results
where Yt=(Y1t, Y2t…Ynt) is a nx1 vector of endogenous variables,
while Yt-1 is the corresponding lag terms of order i. ϕ
Simple linear regression model
i is the nxn matrix
of autoregressive coe cients of vector Yt-i for i=1,2,…,p. c=(c1,c2,…cn)
First, we will examine the simple linear regression model between
is the nx1 intercept vector of the VAR model. εt=(ε1t, ε2t,… εnt)’
D (LNGDP) and LN (OILPRICE) by using the two following models:
is the nx1 vector of White Noise Process.
D(LNGDP) = a + B*LN(OILPRICE) + u
Identi cation of variables: e VAR model we propose to build,
takes into account six variables in natural logarithms and a D(LNGDP) = B*LN(OILPRICE) + u
dummy variable represented by a series covering the quarterly
D(LNGDP) = a + B*D(LNOILPRICE) + u
period 1988:Q3 – 2013:Q4 constructed as follows:
D(LNGDP) = B*D(LNOILPRICE) + u
Gross domestic product per capita (denoted by GDP). e
Central Bureau of Statistics of Israel publishes the GDP data
We start to investigate the linear relationship of oil prices and
quarterly and seasonally adjusted measured in USD.
economic growth. In order to do so, we consider rstly a Linear
Regression Model (LRM) between these two factors with, particularly,
Oil price (denoted by OILPRICE). We choose the UK Brent
the GDP per capita as endogenous variable and the oil price as
crude oil price speci ed in dollars as a proxy of the world oil
price and also because it’s the main type of oil Israel imports. e
exogenous variable, and we will note that the two variables are
data was derived from the EIA website in monthly frequency
measured in natural logarithms to reduce heteroscedasticity. In the
and transferred into quarterly frequency.
second stage, we conserve the same type of model and with a change
of the logarithmic oil price by oil price logarithmic variations. Table 1
Interest rate (denoted by INT). e e ective interest rate a ects the
shows the results for the two estimated models (Model 1 and Model 2).
interest rates that the commercial banks determine to the public,
ese results indicate statistically signi cant coe cients for the two cases
and thus a ects the level of investment in the economy. In addition,
at the 5% level. e coe cient of determination, noted R², is very low
it is a monetary tool of the central bank of Israel to control the
(0.06) for the model containing intercept (a). is fact indicates a bad
amount of money in the economy and thus a ect the GDP of Israel.
adjustment of these models, whereas in the cases of model without
We choose the e ective interest rate determined each month by the
intercept (a), the coe cient of determination is completely negative that
central Bank of Israel, and publishes in it’s website since 1988:Q3
is impossible because it must be always given by 0 < R² <1. is
and transferred it into quarterly frequency.
argument means that the oil price in level (LNOILPRICE) doesn’t have
signi cant e ect on the economic growth, but rather the oil price returns
Exchange rate ILS-Dollar (denoted by EXCH). Exchange rate is an
D (LNOILPRICE). As a result, several researchers have used therea er
indicator received from nancial and capital markets, and an important
the oil price returns D (LNOILPRICE) instead of the oil price
factor in determining the monetary policy of the State of Israel.
(LNOILPRICE). Considering this implication, we propose the
Moreover, it a ects many sectors in Israel and in particular on the J Glob Econ
ISSN: 2375-4389 Economics, an open access journal
Volume 3 • Issue 2 • 1000136 lOMoAR cPSD| 41487147
Citation: Zaher Z, Maayan S (2015) The Impact of Global Oil Prices on the Israel’s GDP Per Capita: An Empirical Analysis. J Glob Econ 3: 136. doi:10.4172/2375-4389.1000136 Page 4 of 7 a LNOILPRICE R- squared D-W AIC SC HQC Model 0.059556* -0.010991* D(LNGDP) 0.064539 2.11923 -4.13072 -4.07894 -4.10976 (1) (3.948305) (-2.613470) Model 0.005277* -0.082764 1.817266 -4.004292 -3.978399 -3.993810 D(LNGDP) (2) (5.849725)
Table 1: Estimation results for model (1) and model (2). Model (1) includes an intercept, Model (2) presents without intercept. T-statistics are given in parentheses.
*Indicates the parameters are signi昀椀cant at the 5% level. R²: coef昀椀cient of determination, d: Durbin Watson statistic, AIC: Akaike Information Criterion, SC: Schwarz
Criterion, HQC: Hannan-Quinn Criterion.
Figure 3: Quarterly GDP per capita Growth Rate (DLNGDP) - Oil Price Returns (DLNOILPRICE) (1988Q3-2013Q4). a D(LNOILPRICE) R-squared D-W AIC SC HQC 0.020477* 0.022731 0.012592 1.945231 -4.076679 -4.024894 -4.055715 Model (3) D(LNGDP) (6.538369) (1.123621) 0.039911 Model (4) D(LNGDP) -0.413791 1.351795 -3.737534 -3.711641 -3.727052 (1.671209)
Table 2: Estimation results for model (3) and model (4). Model (3) includes an intercept. Model (4) presents without intercept. T-statistics are given in parentheses.
*indicates statistical signi昀椀cance at the 5% level. R²: coef昀椀cient of determination, D-W: Durbin Watson statistic, AIC: Akaike Information Criterion, SC: Schwarz Criterion, HQC: Hannan-Quinn Criterion.
industry in the country, which in turn is an important component of
e Central Bureau of Statistics of Israel in monthly frequency
Israel’s GDP. e data was derived from the website of the central bank
and transferred into quarterly frequency measured in ILS.
of Israel in monthly frequency and transferred into quarterly frequency.
Dummy variable (denoted by WAR). is is a dummy variable that
Number of employees (denoted by EMP). e number of employees
receives the value 1 or 0. We chose to de ne the dummy variable as
is the key to assessing the economic system in Israel and to measure
military con icts or wars in Israel. When there is a military con ict the
the standard of living. Higher employment rates led to tax revenues
variable is getting the value 1, otherwise, gets the value 0. is variable
that allow enlargement of public expenditure on education, health,
has not been used in previous studies we reviewed, but we chose to
social services and security. All of these increase the GDP of the
include it in our model and check whether it has an e ect on GDP per
country. e data was derived from the website of Central Bureau of
capita, since the state of Israel is in the Middle East, it’s given to a great
Statistics of Israel in monthly frequency and transferred into quarterly
military tension, which is o en accompanied by terror incidents and
frequency Speci ed in thousands.
military con icts over the years. All of these events may have a negative impact on GDP (Table 3).
Average Wage (denoted by WAGE). is statistic is an indicator of
Unit Root Test (ADF Test): e nal results of the stationary will
changes in salary and economic growth. e data was derived from J Glob Econ
ISSN: 2375-4389 Economics, an open access journal
Volume 3 • Issue 2 • 1000136 lOMoAR cPSD| 41487147
Citation: Zaher Z, Maayan S (2015) The Impact of Global Oil Prices on the Israel’s GDP Per Capita: An Empirical Analysis. J Glob Econ 3: 136. doi:10.4172/2375-4389.1000136 Page 5 of 7
be found in Table 4. Based on the Augmented Dickey-Fuller test
is a VECM (Vector Error Correction Model) by using a number
we conclude that the rst di erence of GDP, OILPRICE, WAGE, of lag equal to 2.
EMP, EXCH and INT are stationary in I (0) so in level, I (1).
VECM estimation: e VECM estimation gives us the co-
Johansen co-integration test: In this test, the rst step tries to
integrated vector which can be written as follows
determine the number of lag used to estimate later the VAR model. In order
LNGDP(-1) = -1.97802 - 0.05067*LNOILPRICE(-1) –
to do this, we estimate a number of autoregressive processes by xing a 1.48774*LNWAGE(-1) + 0.12097*LNINT(-1) –
length of lag by keeping only the lag which is minimized by the criteria FPE
0.35642*LNEXCH(-1) + 0.70819*LNEMP(-1)
(Final Prediction Error), AIC (Akaike), SC (Schwarz) and HQ (Hannan-
Quinn) and which is maximized by the criterion LR (Likelihood Ratio). D(LNGDP) = C(1)*(LNGDP(-1) -1.97802 -
According to Table 5, we conclude that FPE and AIC criteria lead us to 0.05067*LNOILPRICE(-1) – 1.48774*LNWAGE(-1) +
choose the lag number equal to 2. A er this step, we pass to investigate the
0.12097*LNINT(-1) – 0.35642*LNEXCH(-1) + 0.70819*LNEMP(-1)) + C(2)*D(LNGDP(-1)) + C(3)*D(LNGDP(-2)) +
unrestricted co-integration rank test based on the trace statistic (Table 6) C(4)*D(LNOILPRICE(-1)) + C(5)*D(LNOILPRICE(-2)) +
which helps us to determine the existence of the co-integration relation by C(6)*D(LNWAGE(-1)) + C(7)*D(LNWAGE(-2)) +
using the approach of Johansen (1988). e results presented in Table 6
C(8)*D(LNINT(-1)) + C(9)*D(LNINT(-2)) + C(10)*D(LNEXCH(-
reveal the existence of a co-integration relation (in the long-run the variables 1)) + C(11)*D(LNEXCH(-2)) + C(12)*D(LNEMP(-1)) +
move together) between the variables of the model and lead us to run a
C(13)*D(LNEMP(-2)) + C(14) + C(15)*WAR. restricted VAR model that Dependent Variable V1 GDP
Quarterly IL Real GDP per capita price Explanatory Variables V2 OIL Price
Quarterly UK brent Oil Price in US Dollars V3 INT Quarterly IL effective rate V4 Exch
Quarterly Exchange Rate ILS –US V5 EMP
Quarterly Number of Employees in IL V6 WAGE Quarterly IL Average Wage V7 WAR Dummy Variable
Table 3: List of variables used in the analysis of fundamental factors affecting IL real GDP per capita prices and returns. Level GDP OILPRICE WAGE EMP EXCH INT Intercept & Trend -2.936471 -2.802775 -1.824772 -1.415815 -1.463702 -3.825480 Intercept -4.928854 -0.410148 -3.129298 -1.357319 -3.261111 -0.552589 None 6.360143 1.252204 0.507791 10.01518 0.806177 -1.256657 Decision non-stationary non-stationary non-stationary non-stationary non-stationary non-stationary 1st Difference Intercept & Trend -11.52643* -8.847866* -3.555053* -8.615808* -8.321831* -7.909091* Intercept -2.193053* -8.851690* -1.644133* -8.597221* -7.536033* -7.891871* None -1.541593* -8.709262* -1.862996* -1.180717* -7.346471* -7.800551* Decision stationary stationary stationary stationary stationary stationary Classi昀椀cation I(1) I(1) I(1) I(1) I(1) I(1)
Table 4: Unit root test (ADF test) results. Lag LogL LR FPE AIC SC HQ 0 346.4365 NA 2.88E-11 -7.243329 -7.080991 -7.177757 1 1069.332 1338.125 1.30E-17 -21.85812 -20.72175 -21.39911 2 1129.815 104.2369* 7.78e-18* -22.37904* -20.26864* -21.52659* 3 1152.716 36.5443 1.05E-17 -22.10034 -19.01592 -20.85446 4 1190.908 56.06972 1.05E-17 -22.14699 -18.08854 -20.50767
Table 5: Identi昀椀cation of optimal number of lags.
Hypothesized No. of CE(s) Eigenvalue Trace Statistic 0.05 Critical Value Prob.** 1 None * 0.372987 132.8604 125.6154 0.0168 2 At most 1 0.267307 87.58199 95.75366 0.1203 3 At most 2 0.207240 57.41228 69.81889 0.1972 4 At most 3 0.159539 34.88553 47.85613 0.3962 5 At most 4 0.093466 18.02648 29.79707 0.7704 6 At most 5 0.058649 8.508176 15.49471 0.4154
Table 6: Unrestricted co-integration rank test (Trace). J Glob Econ
ISSN: 2375-4389 Economics, an open access journal
Volume 3 • Issue 2 • 1000136 lOMoAR cPSD| 41487147
Citation: Zaher Z, Maayan S (2015) The Impact of Global Oil Prices on the Israel’s GDP Per Capita: An Empirical Analysis. J Glob Econ 3: 136. doi:10.4172/2375-4389.1000136 Page 6 of 7
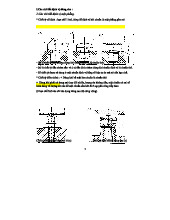
Long-run causality: According to Table 7, C (1) is the coe
distribution is positive skewed (longer in the right side) and with
cient of the co-integrated model indicating the speed of adjustment
excess kurtosis (leptokurtic distribution) meaning that more of
towards long-run equilibrium. Since it’s not negative and signi cant
the variance is the result of infrequent extreme deviations. As to
at 5% level, we conclude that there is no long-run causality running
the Jarque-Bera test, it is signi cant at level 5%, meaning that
from the explanatory variables to GDP. Meaning that, all
the residuals are not normally distributed. However, we can still
explanatory variables don’t have an in uence on the dependent
accept this model because the coe cients are consistent.
variable such as LN (OILPRICE) in the long-run. And we can note
for no improvement in the result of the relationship between GDP
Granger causality test: At this level, we can con rm our result
and oil price when we compare this results with the results found in
which consists to refuse the direct linear relationship between GDP and
the simple LRM (Linear Regression Model).
oil price because when we look at Table 8 below, we conclude that the
Short-run causality: To test whether the explanatory
GDP is Granger Caused only by the number of employees in the labour
variables can short-run cause D (LNGDP) or not, we shall use
market. Meaning that, the past values of LN (EMP) can forecast the
Wald-Test on the following coe cients:
future values of LN (GDP). Hence, we don’t have a Granger Causality H1: C (4) = C(5)=0
direction between LN (GDP) and LN (OILPRICE). Because of that, it’s
make sense to have a weakening e ect in the direct relationship. H2: C (6) = C(7)=0 Conclusion H3: C (8) = C(9)=0 H4: C (10) = C(11)=0
e question regarding the impact of oil price shocks on economic
growth presents di erent results between the models and the variables H5: C (12) = C(13)=0
selected. Because of that, we developed a VAR model which investigates H6: C (15) = 0
the relationship between these two factors GDP and Oil price. Our results
showed that the use of a Simple LRM (Linear Regression Model) can
Our results accept all null hypotheses, meaning that all coe cients
present a non-signi cant coe cients or a bad adjustment in the direct
are equal to zero thus indicating the absence of the individually short-
run causality of the explanatory variables. However, jointly the
relationship, and present also a weakening e ect in the direct relationship.
variables can have in uence on the dependent variable because F-
For this reason, we decided to use the VECM (Vector Error Correction
Statistic is signi cant. We assume that, the reason for the diagnosis
Model) by introducing other factors that may have a high relationship with
divergence in the use of these two criteria, which arrives o en in the
Israel economic growth and the oil price, a step which may improve our
reality are due to a small sample and less data.
results. However, consistent ndings in our results such as to [12] caused to
reject our research hypothesis, indicating no relationship between these two
Diagnostic checking: Whether our model where D (LNGDP) is a
dependent variable has any statistical error or not, we can note that R-
factors, meaning that the oil price change doesn’t impact the economic
squared value is low (0.33). is fact indicates a bad adjustment of the model
growth and that Israel is not materially a ected by oil prices and the
because normally if R-squared is less than (0.60) we cannot accept the
economy is not a ected in times of rising oil prices. Hence, we conclude that
model. However, F-statistic is signi cant at the level 1% meaning that our
the impact of increasing oil price on economic growth depends on a
data in the model is tted well. According to the Residual diagnostics, it
thorough comprehension of this topic and an ability to choose the best
appears to have desirable results in the absence of serial correlation and
appropriate model for this purpose. us, the results can be di erent between
heteroskedasticity in the residuals. e Figure 4 above indicates the histogram
working papers and still deserves further attention in future research.
of the residuals. We conclude that the ����� Std. Error t-Statistic Prob. C(1) 0.110533 0.024560 4.500542 0.0000* C(2) -0.364607 0.126045 -2.892677 0.0049* C(3) -0.349841 0.126862 -2.757648 0.0071* C(4) -0.002381 0.021120 -0.112749 0.9105 C(5) -0.011460 0.022582 -0.507504 0.6131 C(6) 0.098778 0.150879 0.654685 0.5145 C(7) 0.147525 0.151188 0.975776 0.3320 C(8) -0.011304 0.015685 -0.720673 0.4731 C(9) 0.008560 0.015217 0.562521 0.5753 C(10) 0.082630 0.092343 -0.894819 0.3734 C(11) 0.125032 0.091583 1.365234 0.1758 C(12) 0.384204 0.384137 1.000177 0.3201 C(13) -0.024760 0.377183 -0.065646 0.9478 C(14) 0.030731 0.006288 4.876006 0.0000* C(15) -0.008425 0.006288 -1.339942 0.1839 R-squared F-statistic Prob(F-stat) AIC SC 0.332168 2.984296 0.000968 -4.214297 -3.821097
Table 7: VECM estimation results. J Glob Econ
ISSN: 2375-4389 Economics, an open access journal
Volume 3 • Issue 2 • 1000136 lOMoAR cPSD| 41487147
Citation: Zaher Z, Maayan S (2015) The Impact of Global Oil Prices on the Israel’s GDP Per Capita: An Empirical Analysis. J Glob Econ 3: 136. doi:10.4172/2375-4389.1000136 Page 7 of 7 Series: Residuals Sample 1989Q2 2013Q4 Observations 99 Mean -2.05e-18 Median -0.000397 Maximum 0.088922 Minimum -0.062367 Std. Dev. 0.025412 Skewness 0.517293 Kurtosis 4.188413 Jarque-Bera 10.24111 Probability 0.005973
Figure 4: Histogram - Normality Test. Dependent Variable Independent Variable LNGDP LNOILPRICE LNWAGE LNEMP LNEXCH LNGDP 1.114833 5.664090 8.04180* 5.356541 2.562816 LNOILPRICE 5.720575 1.813386 5.04738 8.57693* 16.42055* LNWAGE 0.300262 2.166962 2.85663 13.16937* 0.726834 LNEMP 7.895147* 13.55195* 1.037069 1.623316 5.464483 LNEXCH 1.098804 8.546248* 1.196839 3.52055 0.524769 LNINT 1.498012 3.130053 3.097587 3.23757 0.183040 ALL 13.19964 32.38770* 17.66179 14.5990 37.16691* 48.21006*
Table 8: VEC Granger Causality Test. References
9. Gomez A, Montanes A, Dolores M (2011) The Impact of Oil Price Shocks On
The Spanish Economy. Energy Economics 33: 1070-1081.
1. Bahgat G (2010) Israel’s Energy Security: The Caspian Sea and the Middle
East. Israel Affairs 16: 406- 415.
10. Aydin L, Acar M (2011) Economic Impact of Oil Price Shocks on the Turkish
Economy in the Coming Decades: A Dynamic CGE Analysis. Energy Policy
2. Even S (1998) Possible trends in the global oil and meanings strategies to 39: 1722-1731.
Israel. Tel Aviv: Jaffe Center for Strategic Studies.
11. Naccache T (2010) Slow Oil Shocks and the “Weakening of Oil Price-Macro
3. Rivlin P (2000) Oil Market: Current Situation and Expectations. Strategic
economy Relationship”. Energy Policy 38: 2340-2345. Assessment 3: 21-23.
12. Berument H, Ceylan NB, Dogan N (2010) The Impact of Oil Price Shocks on
the Economics Growth of Selected Middle East and North Africa Countries. J
4. Even S, Feldman N (2009) Global economic crisis and its impact on countries Engy 31: 149-176.
in the region and Israel. Strategic assessment of Israel 155-171.
5. Chakarova V (2013) Oil Supply Crisis: Cooperation and Discord in the West.
Plymouth: Library of Congress.
6. Feldman N (2007) What is the true power of the Iranian “oil weapon”?
Strategic Assessment 10: 72-80.
7. Rodriguez JR, Sanchez M (2005) Oil Price Shocks and Real GDP Growth:
Empirical Evidence for Some OECD Countries. Applied Economics 37: 201-228.
8. Du L, Yanan H, Wei C (2010) The Relationship between Oil Price Shocks and
China’s Macro-Economy: An Empirical Analysis. Energy Policy 38: 4142-4151. J Glob Econ
ISSN: 2375-4389 Economics, an open access journal
Volume 3 • Issue 2 • 1000136 The impact of oil price
Nguyên Lý Kinh Tế Vĩ Mô (Đại học Khoa học Xã hội và Nhân
văn, Đại học Quốc gia Thành phố Hồ Chí Minh)
Tài liệu liên quan:
-
Bài tập Kinh tế vi mô | Trường Đại học Khoa học Xã hội và Nhân văn, Đại học Quốc gia Thành phố Hồ Chí Minh
27 14 -
ĐỒ GÁ Chi Tiết Định Vị: Hướng Dẫn Sử Dụng và Cấu Tạo
39 20 -
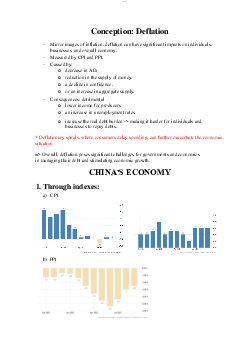
Deflation in China | Kinh tế Vi mô | Đại học Khoa học Xã hội và Nhân văn, Đại học Quốc gia Thành phố HCM
309 155 -
Khảo sát Burger King | Kinh tế học Vi mô | Đại học Khoa học Xã hội và Nhân văn, Đại học Quốc gia Thành phố HCM
333 167