Bài tập Kiểm soát quy trình đóng gói và sản xuất ốc vít | Môn Quản trị chất lượng dịch vụ - Đại học Sư phạm Kỹ thuật Thành phố Hồ Chí Minh
Bài tập Kiểm soát quy trình đóng gói và sản xuất ốc vít Môn Quản trị chất lượng dịch vụ. Tài liệu được sưu tầm gồm 2 trang, giúp bạn ôn tập tốt hơn. Mời các bạn đón xem.
Môn: Quản trị chất lượng dịch vụ 11 tài liệu
Trường: Trường Đại học Sư phạm Kỹ thuật Thành phố Hồ Chí Minh 4.3 K tài liệu
Tác giả:
Preview text:
lOMoAR cPSD| 58794847 Bài tập 1:
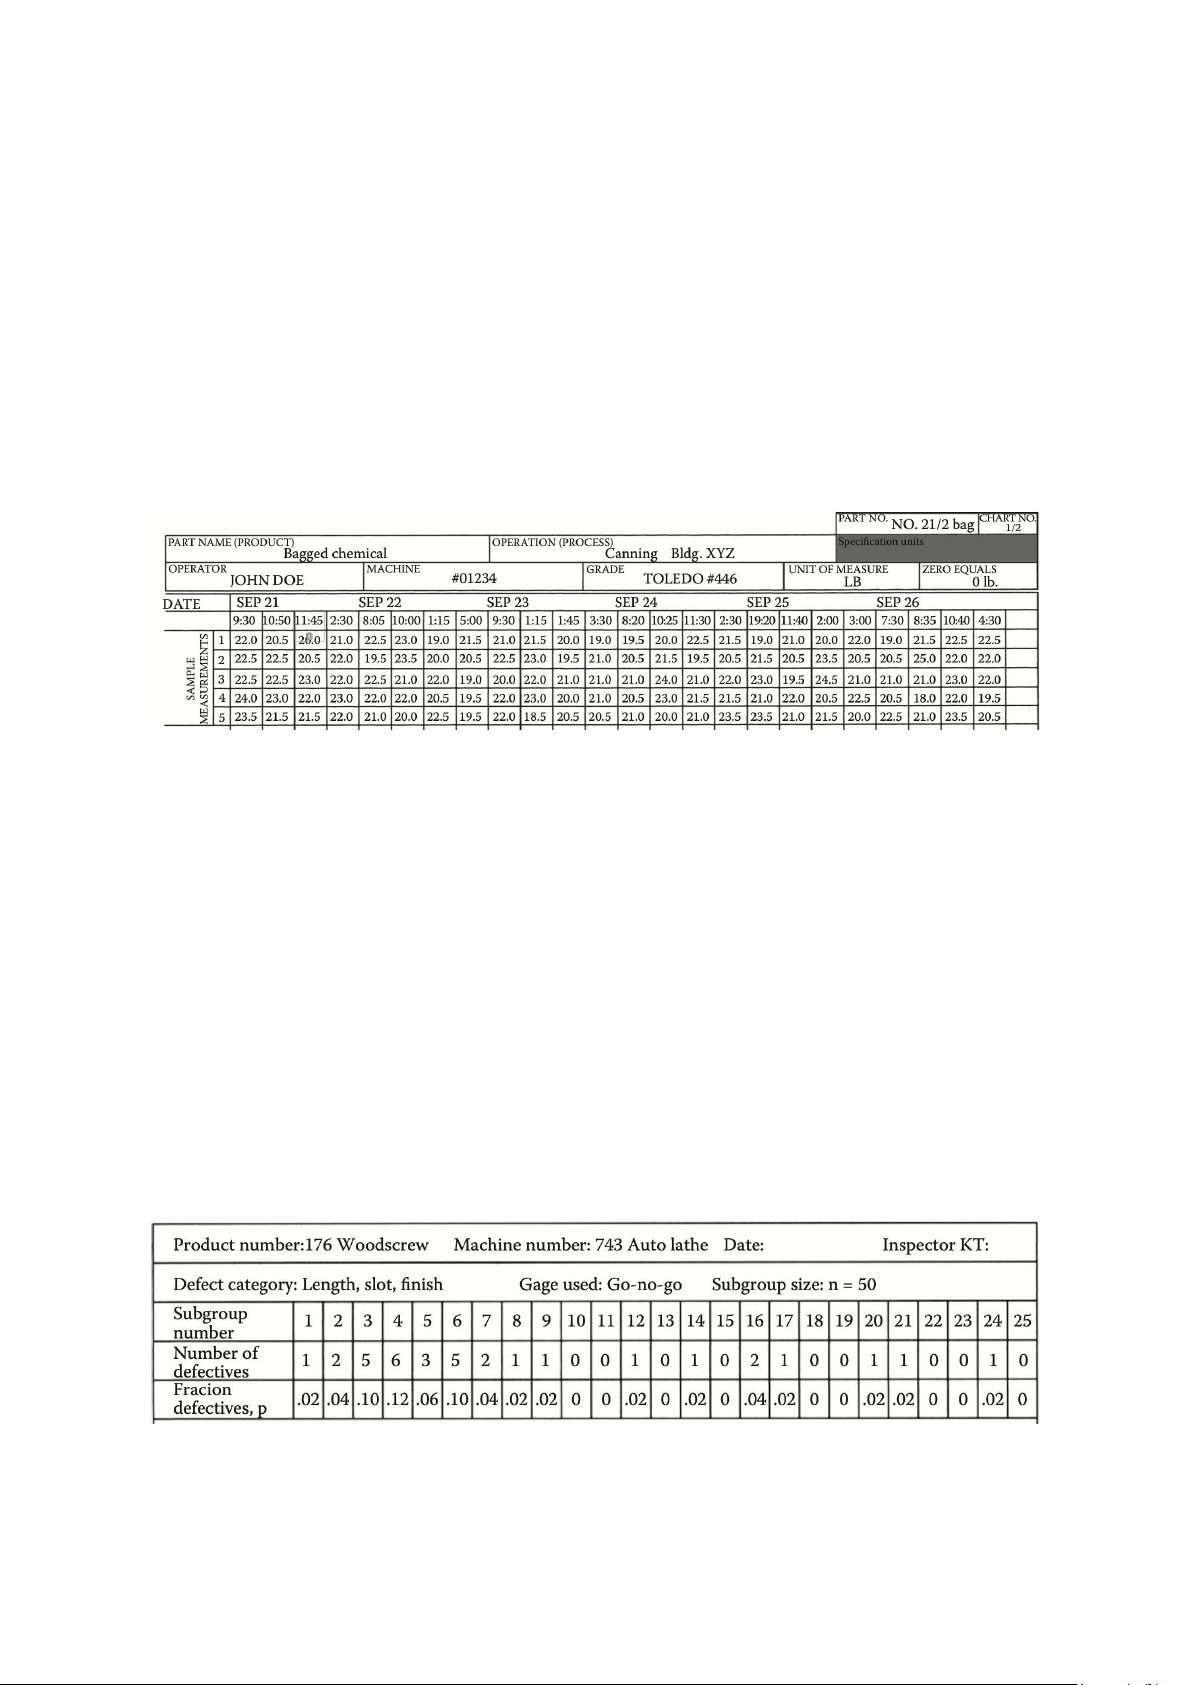
The process to be controlled is a filling operation in a packaging shop where a
powder chemical is filled in bags. The net weight of the chemicals in the filled
bags is to be controlled using control charts so that the average and variability of
the net weight of all the filled bags remain consistent. The data are shown in
Figure 1 on a standard control chart form. In this example, 24 samples of five
bags each were collected at approximately one-hour intervals.
Let’s use the X- and R-charts to control the average and variability of the filling operation.
Figure 1 The net weight of the chemical in the filled bags Bài tập 2:
The data from exercise 1. Calculate the limits for the X and S-charts. Bài tập 3:
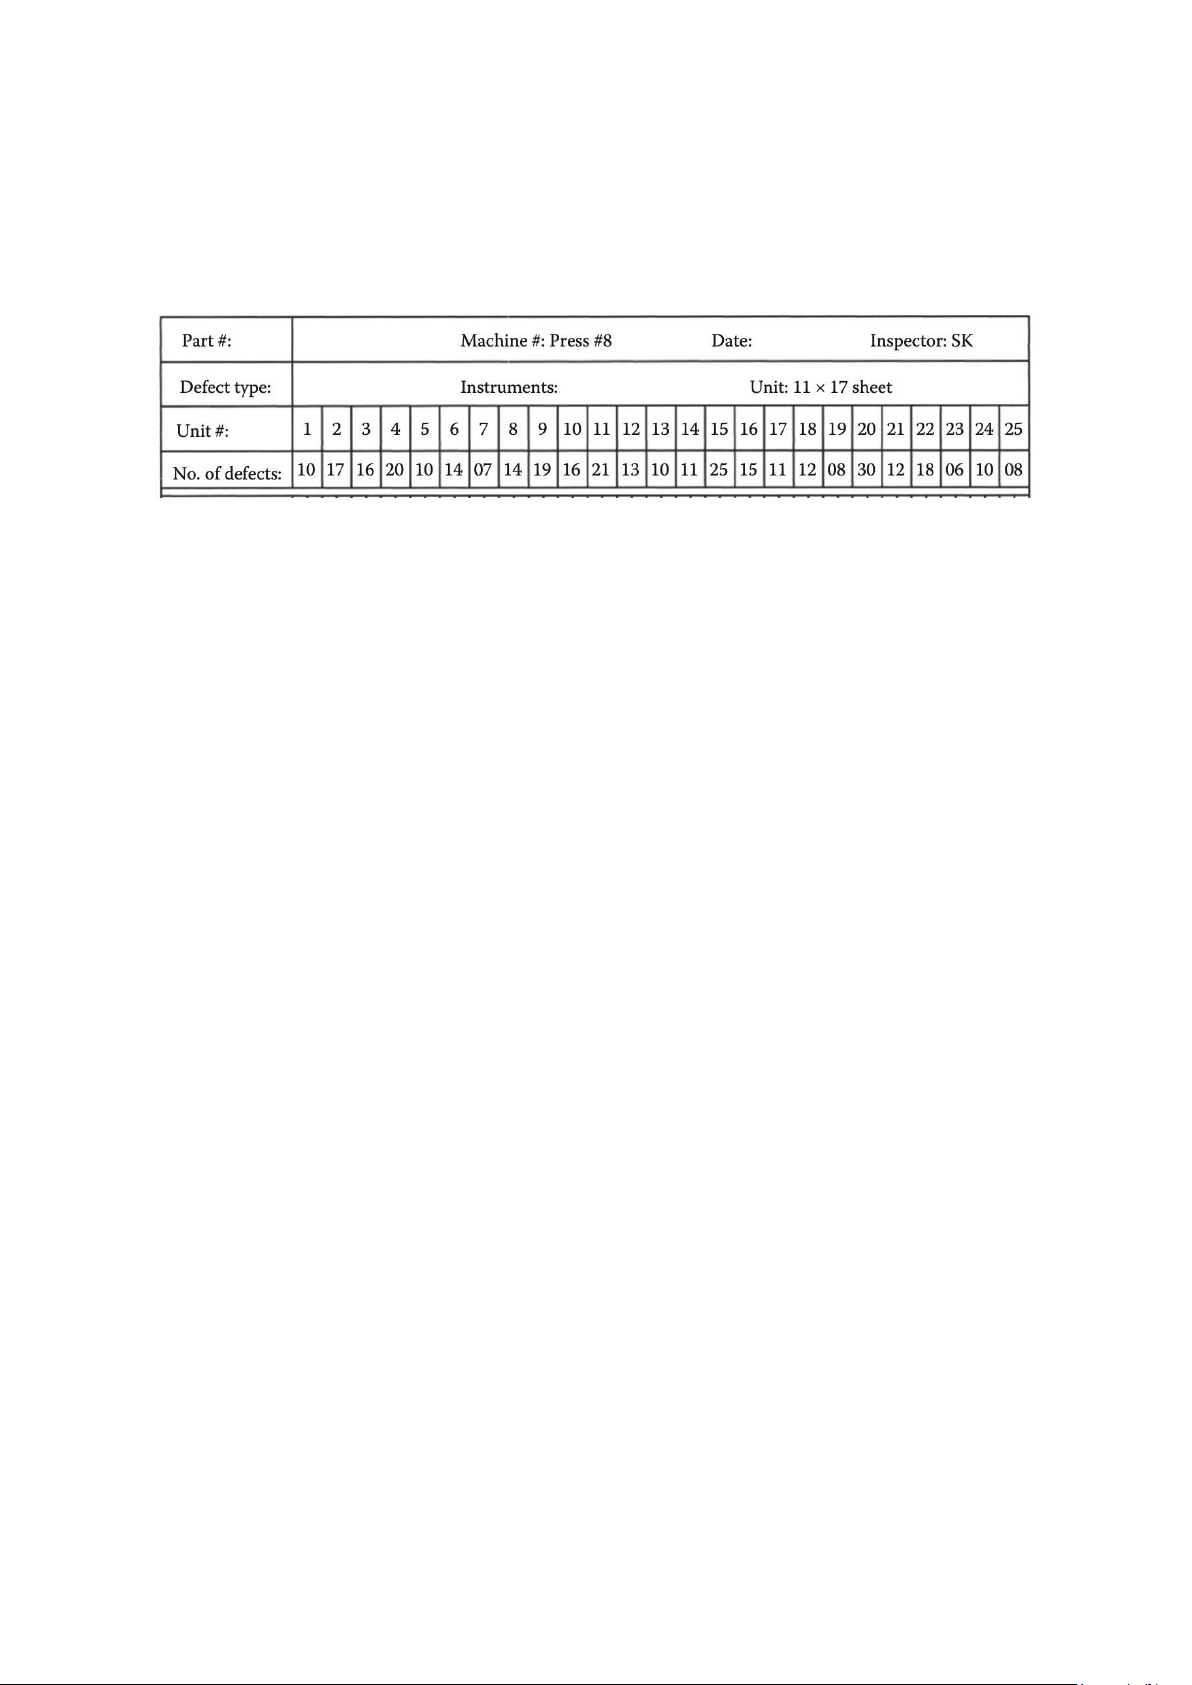
The process was an automatic lathe-producing wood screws. Samples of 50
screws were taken every half-hour, and the screws were gaged for length, the
diameter of the head, and slot position and were also visually checked for the
finish. The number rejected in each sample for any reason was recorded, as shown
in Figure 2. Prepare a control chart (P-chart) to monitor the fraction defectives in the process. Bài tập 4: lOMoAR cPSD| 58794847
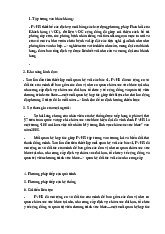
The process is a laminating press that puts plastic lamination on printed art sheets,
which are later cut and finished into a credit card-type product. The number of
defects such as bubble, tear or chicken scratches on the laminated sheets is to be
controlled by counting the number per sample sheet. Prepare a control chart (C-
chart ) to control the defects per sheet.
Tài liệu liên quan:
-

Chương 2 thiết Kế, Đánh Giá Chất Lượng Dịch Vụ môn quản trị chất lượng dịch vụ | Trường Đại học Sư phạm Kỹ thuật Thành phố Hồ Chí Minh
29 15 -
Bài tập Môn Quản trị chất lượng dịch vụ | Đại học Sư phạm Kỹ thuật Thành phố Hồ Chí Minh
116 58 -
Bảng Câu Hỏi Nghiên Cứu Nâng Cao Chất Lượng Dịch Vụ Agribank Vĩnh Long | Môn Quản trị chất lượng dịch vụ - Đại học Sư phạm Kỹ thuật Thành phố Hồ Chí Minh
80 40 -
Bài 8: Hệ Thống Quản Lý Chất Lượng ISO và Six Sigma | Môn Quản trị chất lượng dịch vụ - Đại học Sư phạm Kỹ thuật Thành phố Hồ Chí Minh
145 73