Banking Risk Analysis Midterm Notes | Môn Finance - Banking - Trường Đại học Quốc tế, Đại học Quốc gia Thành phố Hồ Chí Minh
Banking Risk Analysis Midterm Notes Môn Finance - Banking. Tài liệu được sưu tầm gồm 36 trang, giúp bạn ôn tập tốt hơn. Mời các bạn đón xem.
Môn: Finance - Banking (MFBO19) 10 tài liệu
Trường: Trường Đại học Quốc tế, Đại học Quốc gia Thành phố Hồ Chí Minh 1.9 K tài liệu
Tác giả:


Preview text:
lOMoAR cPSD| 58562220 CHAPTER1
1. To calculate the expected returns and standard deviations of returns for the given investment, we
can use the following formulas:
- Expected Return (ER) = Σ (Probability * Return)
- Standard Deviation (SD) = √[Σ (Probability * (Return - Expected Return)^2)] Let's
calculate the expected returns and standard deviations step by step:
Calculate the expected return:
ER = (0.1 x 40%) + (0.2 x 30%) + (0.35 x 15%) + (0.25 x -5%) + (0.1 x -15%)
ER = 0.04 + 0.06 + 0.0525 - 0.0125 - 0.015 ER = 0.125 or 12.5% Therefore,
the expected return on the investment is 12.5%.
Calculate the standard deviation: 𝑆𝐷 =
0. 1 * (40% − 12. 5%)2 + 0. 2 * (30% − 12. 5%)2 + 0. 35 * (15% − 12. 5%)2 + 0. 25 * (− 5% − 12. 5%)2 + 0. 1 * (− 15% − 12. 5%)2 𝑆𝐷 =
0. 00729 + 0. 00578 + 0. 00022 + 0. 00756 + 0. 00299
𝑆𝐷 = 0. 1706604817 𝑜𝑟 17. 07%
Therefore, the standard deviation of returns for the investment is 17.07%. In summary:
● The expected return on the investment is 12.5%.
● The standard deviation of returns for the investment is 17.07%.
2. Now, for a portfolio with two investments having the same return distribution and a correlation
of ρ=0.15\rho = 0.15ρ=0.15 between them, we can calculate:
Expected Return of the Portfolio, E(Rp ): Since the portfolio is split equally, the expected return is simply: E(𝑅 )=E(R) 𝑃
Standard Deviation of the Portfolio, σ : Using the formula for the standard deviation of a portfolio 𝑝 with two assets: 2 2 2 2 σ = ω σ + ω σ + 2ω ω σ σ ρ 𝑝 1 1 2 2 1 2 1 2
where ω = ω = 0. 5, σ = σ = σ , 𝑎𝑛𝑑 ρ = 0. 15 1 2 1 2 Let's calculate this. lOMoAR cPSD| 58562220
The expected return for the portfolio remains 12.5%, and the standard deviation of returns is approximately 12.94%.
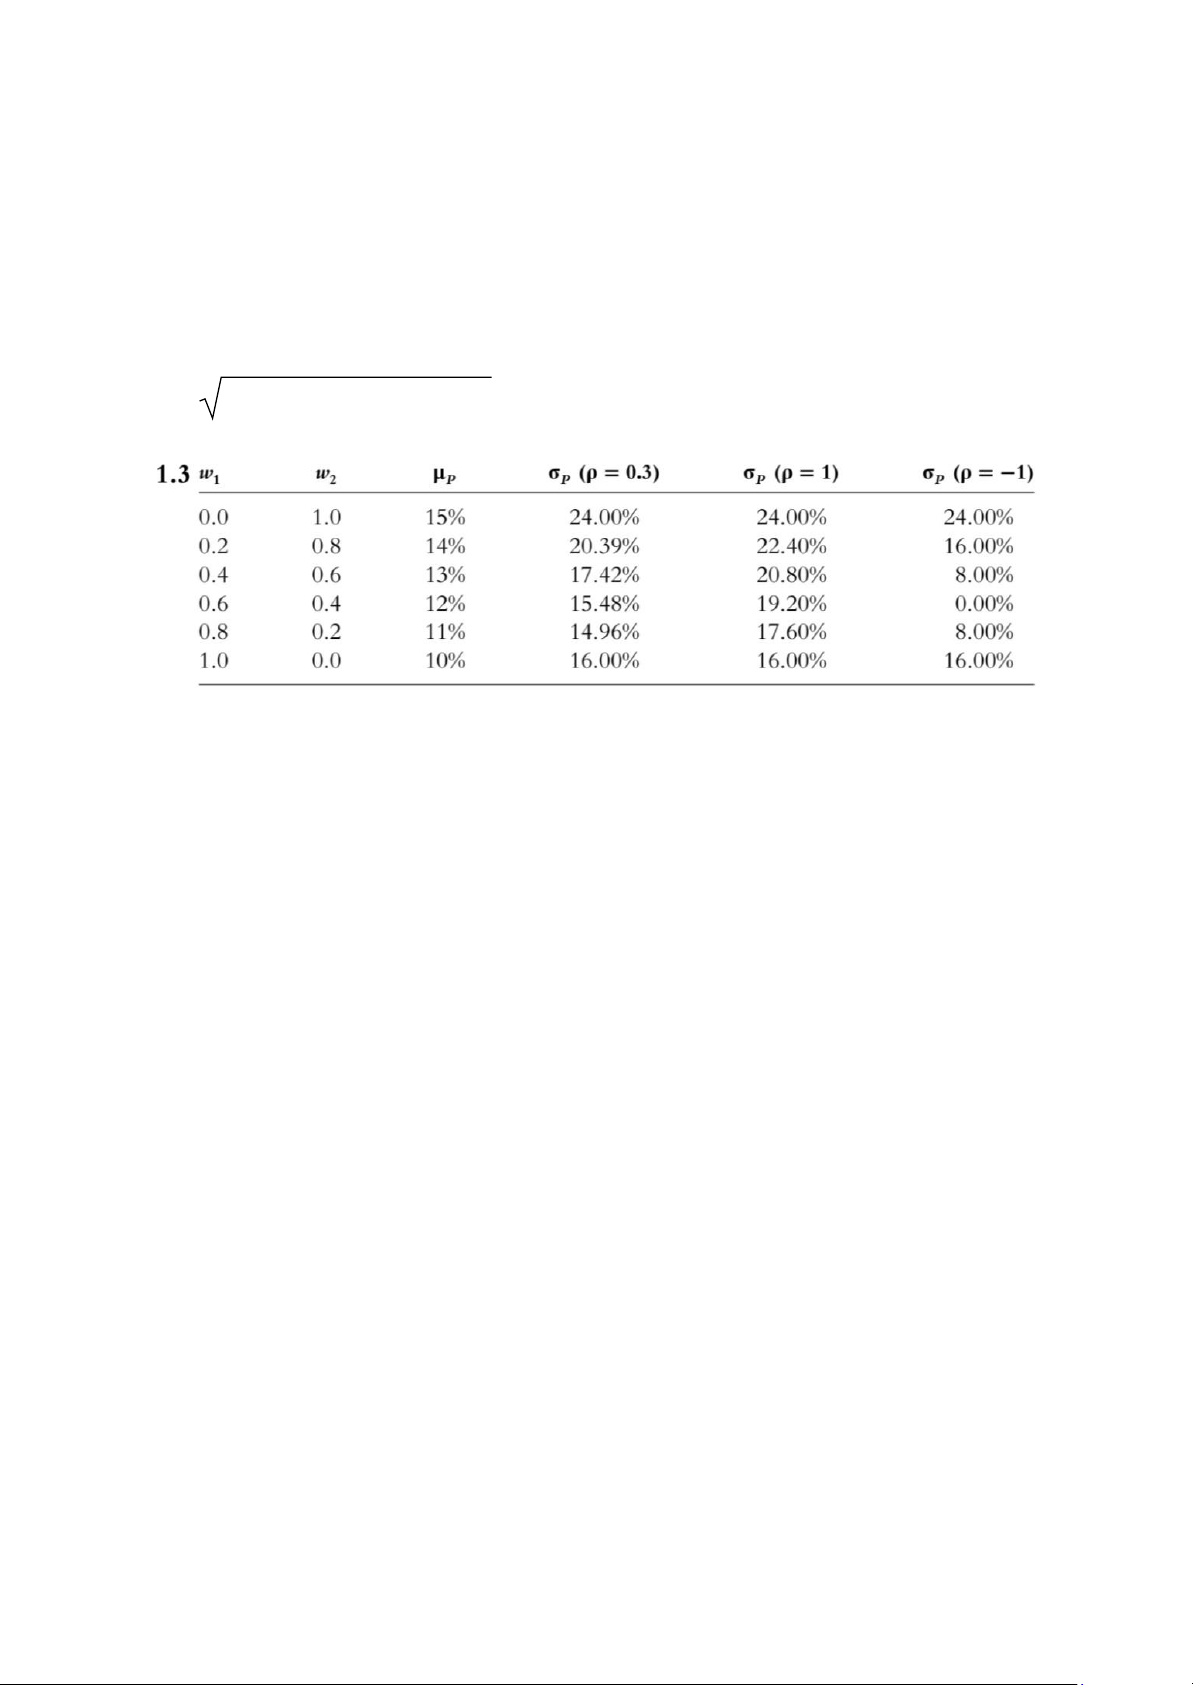
3. Original Data (Correlation = 0.2):
● Investment 1: Expected Return = 10%, Standard Deviation = 16%
● Investment 2: Expected Return = 15%, Standard Deviation = 24%
Using the portfolio standard deviation formula: 2 2 2 2 σ σ +ω σ +2ω 𝑝 = ω 1 1 2 2 1 ω 2 σ 1 σ 2 ρ Interpretation: ● Correlation = 0.3:
The risk-return combinations are similar to the original scenario (Correlation = 0.2). The curve shifts
slightly upwards, indicating slightly higher potential returns for a given level of risk. This is because a
higher positive correlation means the investments tend to move in the same direction, leading to slightly
more diversification benefits. ● Correlation = 1.0:
The risk-return combinations are identical to the original scenario. This is because when the correlation
is perfectly positive, the investments move in perfect tandem, and there is no diversification benefit.
The portfolio risk is simply a weighted average of the individual asset risks.
● Correlation = -1.0:
The risk-return combinations are significantly different from the original scenario. The curve shifts
downwards, indicating lower potential returns for a given level of risk. This is because a perfectly
negative correlation means the investments move in opposite directions, providing maximum
diversification benefits. The portfolio risk can be significantly lower than the weighted average of individual asset risks. 4.
Systematic Risk: This market-wide risk can't be diversified away and is influenced by broad economic
factors, such as interest rates, inflation, and political instability. It's particularly important to equity
investors because it affects the overall market and portfolio performance, regardless of individual stock selection. lOMoAR cPSD| 58562220
Nonsystematic Risk: This company-specific or industry-specific risk can be mitigated through
diversification. Since it’s unique to individual firms or sectors, it can often be managed by holding a diversified portfolio.
Bankruptcy: Both types of risk can potentially lead to bankruptcy. Nonsystematic risk, due to company-
specific factors like poor management or high debt, is an immediate threat to individual companies.
However, a prolonged or extreme systematic risk (like a severe recession) can also threaten the survival
of even well-managed companies. 5.
We assume that investors trade off mean return and standard deviation of return. For a given mean
return, they want to minimize the standard deviation of returns. All make the same estimates of means,
standard deviations, and coefficients of correlation for returns on individual investments. Furthermore,
they can borrow or lend at a risk-free rate. The result is that they all want to be on the “new efficient
frontier” in Figure 1.4. They choose the same portfolio of risky investments combined with borrowing
or lending at a risk-free rate. 6.
To calculate the expected return on an investment using the Capital Asset Pricing Model (CAPM), we use the following formula:
Expected Return = Risk-free Rate + Beta * (Market Risk Premium) Where:
- Risk-free Rate is the return on a risk-free investment (given as 6%).
- Beta is a measure of the investment's volatility relative to the market (given for each case).
- Market Risk Premium is the difference between the expected market return and the risk-free rate (12% - 6% = 6%).
Now let's calculate the expected return for each beta: a) Beta = 0.2
Expected Return = 6% + 0.2 * 6% = 7.2% b) Beta = 0.5
Expected Return = 6% + 0.5 * 6% = 9% c) Beta = 1.4
Expected Return = 6% + 1.4 * 6% = 14.4% lOMoAR cPSD| 58562220
Therefore, the expected returns for the investments with betas of 0.2, 0.5, and 1.4 are 7.2%, 9%, and 14.4%, respectively.
7. “Arbitrage pricing theory is an extension of the capital asset pricing model.”
Capital Asset Pricing Model (CAPM): CAPM provides a framework to determine the expected return
on an asset based on its systematic risk (beta). It assumes that the relationship between risk and return
is linear, driven primarily by market risk and the risk-free rate. CAPM is grounded in the idea of a
market portfolio that includes all risky assets.
Arbitrage Pricing Theory (APT): APT is a more flexible alternative to CAPM. While CAPM focuses
on a single factor (market risk), APT allows for multiple factors that can affect asset returns. These
factors can include macroeconomic variables (such as inflation rates, interest rates, GDP growth) or
specific characteristics related to the asset itself.
Extension: The statement suggests that APT builds on the foundational ideas of CAPM but expands its
applicability by accommodating a broader range of factors influencing asset prices. Unlike CAPM,
which requires specific assumptions about market efficiency and investor behavior, APT is less
restrictive and allows for the incorporation of various risks, making it more applicable to diverse financial contexts.
8. “The capital structure decision of a company is a trade-off between bankruptcy costs and the tax advantages of debt.”
Capital Structure: Refers to the mix of debt and equity financing used by a company to fund its operations and growth.
Trade-off: When making capital structure decisions, companies must balance two primary factors:
- Tax Advantages of Debt: Interest payments on debt are tax-deductible, which lowers the
overall tax burden for the company. This creates an incentive for firms to use debt financing.
- Bankruptcy Costs: Increasing debt levels heighten the risk of financial distress and potential
bankruptcy. Bankruptcy can lead to significant costs, including legal fees, loss of reputation, and operational disruptions.
Decision-Making: Companies must evaluate the benefits of using debt (tax shields) against the risks
and costs associated with high debt levels (bankruptcy risk). The optimal capital structure is achieved at
the point where the marginal tax advantage of debt is balanced with the marginal cost of financial distress.
9. What is meant by risk aggregation and risk decomposition? Which requires an in-depth
understanding of individual risks? Which requires a detailed knowledge of the
correlations between risks?
Risk Aggregation: This refers to the process of combining various individual risks into a single overall
risk assessment. This is often done to understand the total risk exposure of an organization or portfolio.
It focuses on the cumulative effect of different risks and how they contribute to overall risk. lOMoAR cPSD| 58562220
Risk Decomposition: This involves breaking down total risk into its constituent parts to understand the
specific sources of risk better. It allows for a detailed analysis of each risk factor, identifying which
contributes the most to overall risk. Requirements:
Risk Aggregation: This process requires a detailed knowledge of the correlations between risks.
Understanding how different risks interact with each other (e.g., whether they are positively or
negatively correlated) is crucial for accurately assessing the combined risk exposure.
Risk Decomposition: This requires an in-depth understanding of individual risks. Knowing the
characteristics, likelihood, and potential impacts of each specific risk is essential for effective decomposition. 10.
Operational risk is complex and multifaceted, making both risk decomposition and risk aggregation
important, but for different reasons. Here's an analysis of each approach concerning operational risk: Risk Decomposition
Best for Understanding Individual Risks:
● Identification and Assessment: Decomposing operational risk allows a bank to identify
specific sources of operational risk, such as employee fraud, technology failures, natural
disasters, and compliance issues. This level of detail is crucial for understanding the nature and
potential impact of each risk type.
● Tailored Mitigation Strategies: By breaking down operational risks, a bank can develop
targeted strategies to mitigate each risk effectively. For example, fraud prevention measures
may differ significantly from disaster recovery plans.
● Performance Metrics: Decomposing risks can help banks establish metrics to monitor and
manage individual risks, allowing for better governance and accountability. Risk Aggregation
Best for Assessing Overall Risk Exposure:
● Holistic View: Aggregating operational risks provides a comprehensive view of the bank's total
exposure to operational risk. It considers how different risks might combine to create significant overall risk exposure.
● Correlation Consideration: Risk aggregation allows banks to assess correlations between
different operational risks, helping to identify scenarios where multiple risks might materialize
simultaneously, leading to larger losses.
● Capital Allocation: Understanding the aggregated risk is essential for effective capital
allocation and regulatory compliance. It helps banks determine how much capital they need to
hold against potential operational losses. Conclusion lOMoAR cPSD| 58562220
While both approaches are valuable, risk decomposition may be more effective for managing
operational risk in the initial stages, as it allows banks to gain a detailed understanding of the various
operational risks they face and implement targeted mitigation strategies. Once these risks are identified
and understood, risk aggregation becomes crucial for assessing the overall risk exposure and ensuring
that the bank is adequately prepared for potential large losses arising from operational failures. 11.
The given solution is correct. Here's a breakdown of the steps: 1. Define the problem:
● We want to find the probability that the bank's profit exceeds -4% of its assets.
● This is because if the profit is greater than -4%, it will be enough to cover the 4% equity and
leave the bank with a positive equity position.
2. Standardize the value:
● We need to convert the profit level of -4% to a Z-score, which measures how many standard
deviations away from the mean it is. ● Z-score = (X - μ) / σ ● In this case: ○ X = -0.04 (profit level) ○ μ = 0.006 (mean profit)
○ σ = 0.015 (standard deviation of profit)
● Calculating the Z-score: Z = (-0.04 - 0.006) / 0.015 = -3.067
3. Find the probability:
● We want to find the probability that the Z-score is greater than -3.067.
● This is equivalent to finding the area under the standard normal curve to the right of Z = -3.067.
● Using a standard normal distribution table or a calculator, we find: P(Z > -3.067) ≈ 0.9989
4. Interpret the result:
● This means there is a 99.89% probability that the bank's profit will be greater than -4% of assets,
ensuring a positive equity position at the end of the year.
Therefore, the probability of the bank having a positive equity at the end of the year is 99.89%.
12. Why Banks Are Regulated More Than Other Companies
Banks are allowed to accept deposits from the general public.Companies in retailing and manufacturing are not.
Banks are heavily regulated due to their unique role in the economy and the potential systemic risks they pose:
- Systemic Risk: Banks are interconnected with the broader financial system. A failure of a major
bank can have a domino effect, leading to a financial crisis that impacts the entire economy. lOMoAR cPSD| 58562220
- Protection of Depositors: Banks hold public deposits, and depositors rely on the safety of their
funds. Regulations ensure that banks have sufficient reserves to cover potential losses and safeguard depositors' money.
- Financial Stability: Banks' risky activities can destabilize the financial system. Regulations
impose limits on risky investments and require banks to maintain adequate capital buffers to absorb potential losses.
- Consumer Protection: Banks provide essential financial services to individuals and businesses.
Regulations protect consumers from unfair practices, predatory lending, and other harmful activities.
13. Bankruptcy Costs in Business Snapshot 1.1
Based on Business Snapshot 1.1, the company incurred the following bankruptcy costs: Direct Costs:
- Legal and Professional Fees: These include fees paid to lawyers, accountants, and other
professionals involved in the bankruptcy proceedings. The snapshot mentions $10 million per month in professional fees.
- Administrative Costs: These costs are associated with running the bankruptcy process, such
as court fees, filing fees, and other administrative expenses. Indirect Costs:
- Loss of Sales: Customers may be hesitant to do business with a company in bankruptcy, leading
to a decline in sales and revenue.
- Loss of Key Employees: Key employees may leave the company due to uncertainty and job
insecurity, impacting the company's operations and future prospects.
- Damaged Reputation: Bankruptcy can tarnish a company's reputation, making it harder to
attract customers, suppliers, and investors in the future.
- Increased Cost of Capital: The company may face higher interest rates on loans and other
forms of financing due to increased risk.
These costs can significantly erode a company's value and make it difficult to recover from bankruptcy.
14. Hedge Fund Manager's Return
To calculate the hedge fund manager's return, we can use the Capital Asset Pricing Model (CAPM):
Expected Return (without alpha) = Risk-Free Rate + Beta * Market Risk Premium Given:
● Risk-Free Rate = 5% (0.05) ● Beta = 0.6
● Market Risk Premium = Market Return - Risk-Free Rate = 10% - 5% = 5% (0.05) ● Alpha = 4% (0.04) lOMoAR cPSD| 58562220
Plugging these values into the CAPM formula:
Expected Return = 0.05 + 0.6 * 0.05 = 8%
Expected Return (without alpha) + Alpha = 8% + 4% = 12%
Therefore, the hedge fund manager earned a return of 12%.
15. Alternative Risk-Return Combinations
To visualize the alternative risk-return combinations, we can create a chart similar to Figure 1.2.
However, we need to calculate the portfolio expected return and standard deviation for different
weightings of the two investments. Steps:
- Define Weights: Assign different weights to the two investments, ensuring that the weights sum
to 1. For example, you could use weights like (0, 1), (0.2, 0.8), (0.4, 0.6), (0.6, 0.4), (0.8, 0.2), and (1, 0).
- Calculate Portfolio Expected Return: Use the weighted average of the individual expected returns.
- Calculate Portfolio Standard Deviation: Use the formula for portfolio standard deviation,
considering the correlation between the two investments.
- Plot the Points: Plot the calculated expected return and standard deviation pairs on a graph.
Note: The exact calculations and plot will depend on the specific software or tools used. However, the
general approach involves calculating the portfolio statistics for different weightings and then plotting the results.
16. Standard Deviation of Portfolios on the Efficient Frontier
To find the standard deviation of portfolios on the efficient frontier, we would typically use a portfolio
optimization model or software. These tools allow us to input the expected returns, standard deviations,
and correlation between the market and risk-free assets. By specifying the desired expected return, the
optimizer can calculate the corresponding standard deviation.
17. Equity Requirement for Positive Equity
To determine the required equity level, we need to find the Z-score corresponding to the desired
probability and then calculate the corresponding profit level.
a) 99% Sure of Positive Equity:
- Find the Z-score for a 99% probability (using a Z-table or calculator): Z = 2.33.
- Calculate the required profit level: Profit = Mean + Z * Standard Deviation.
- Set the equity level equal to the negative of the required profit level.
b) 99.9% Sure of Positive Equity:
Follow the same steps as in (a), but use the Z-score for a 99.9% probability (approximately 3.09). lOMoAR cPSD| 58562220
18. Hedge Fund Manager's Claim
The hedge fund manager's claim of good performance in a difficult market is partially justified. A beta
of 0.2 indicates that the portfolio is less sensitive to market movements compared to a portfolio with a
beta of 1.0. Therefore, the portfolio would be expected to underperform the market, but not by as much as a higher-beta portfolio.
However, it's important to consider other factors, such as the manager's fee structure and the specific
investment strategy employed. If the manager charged high fees or took on excessive risk, the
performance might not be as impressive as it appears.
To evaluate the manager's performance more comprehensively, it's necessary to compare the portfolio's
returns to a relevant benchmark, such as a low-volatility index fund or a peer group of similar funds.
Additionally, analyzing the manager's investment decisions, risk management practices, and overall
investment philosophy can provide further insights into their performance. CHAPTER2 1.
The U.S. banking system has indeed become more concentrated over time. This trend is primarily due
to factors like deregulation, technological advancements, and economic cycles.
As you mentioned, the total number of banks decreased significantly from 14,483 in 1984 to 5,060 in
2017. This consolidation led to larger banks acquiring smaller ones, resulting in a smaller number of
larger, more powerful institutions. 2.
Community banks in the United States:
State-Level Restrictions on Branch Banking:
● Unit Banking Laws: Many states enacted laws that prohibited banks from opening multiple
branches within a state. These laws limited the geographic scope of banks' operations,
preventing them from expanding and consolidating.
Federal-Level Restrictions:
● McFadden Act of 1927: This federal law further restricted bank branching by prohibiting
national banks from operating branches across state lines. This limitation reinforced the
dominance of small, local banks.
These restrictive policies, both at the state and federal levels, created a fragmented banking system
dominated by small, community banks. These banks were often closely tied to local communities and
played a crucial role in providing financial services to individuals and small businesses.
However, as these restrictions were gradually relaxed over time, particularly with the passage of the
Riegle-Neal Interstate Banking and Branching Efficiency Act of 1994, the U.S. banking industry
underwent significant consolidation, leading to a decline in the number of small, community banks. lOMoAR cPSD| 58562220
3. The main risk is that interest rates will rise so that, when deposits are rolled over, the bank has
to pay a higher rate of interest. The result will be a reduction in the bank’s net interest income. There is also liquidity risk.
4. DLC’s loss is more than its equity capital, and it would probably be liquidated. The subordinated
long-term debt holders would incur losses on their $5 million investment. The depositors should get their money back.
5. Net Interest Income is a key financial metric for banks and other financial institutions. It
represents the difference between the interest income a bank earns from its assets (like loans)
and the interest expense it pays on its liabilities (like deposits). In simpler terms:
● Interest Income: The money a bank earns from lending money to customers.
● Interest Expense: The money a bank pays to customers for holding their deposits.
Net Interest Income = Interest Income - Interest Expense
A higher net interest income indicates that the bank is effectively managing its interest rate risk and
generating profits from its core lending and borrowing activities.
6. Credit risk primarily affects loan losses.Non-interest income includes trading gains and
losses.Market risk therefore affects non-interest income. It also affects net interest income if
assets and liabilities are not matched.Operational risk primarily affects non-interest expense.
7. A private placement is a new issue of securities that is sold to a small number of large
institutional investors. A public offering is a new issue of securities that is offered to the general
public. In a best efforts deal,the investment bank does as well as it can to place securities with
investors, but does not guarantee that they can be sold. In a firm commitment deal, the
investment bank agrees to buy the securities from the issuing company for a particular price and
attempts to sell them in the market for a higher price. 8.
The bidders when ranked from the highest price bid to the lowest are: H, C, F,A, B, D, E, and G.
The price paid by investors is $100. Here's how the shares are allocated:
● H, C, and F: These bidders get their full order filled at $100 per share.
● A: Half of A's order is filled at $100 per share, so A receives 10,000 shares.
The remaining bidders (B, D, E, and G) do not receive any shares as the auction clears at $100 and their
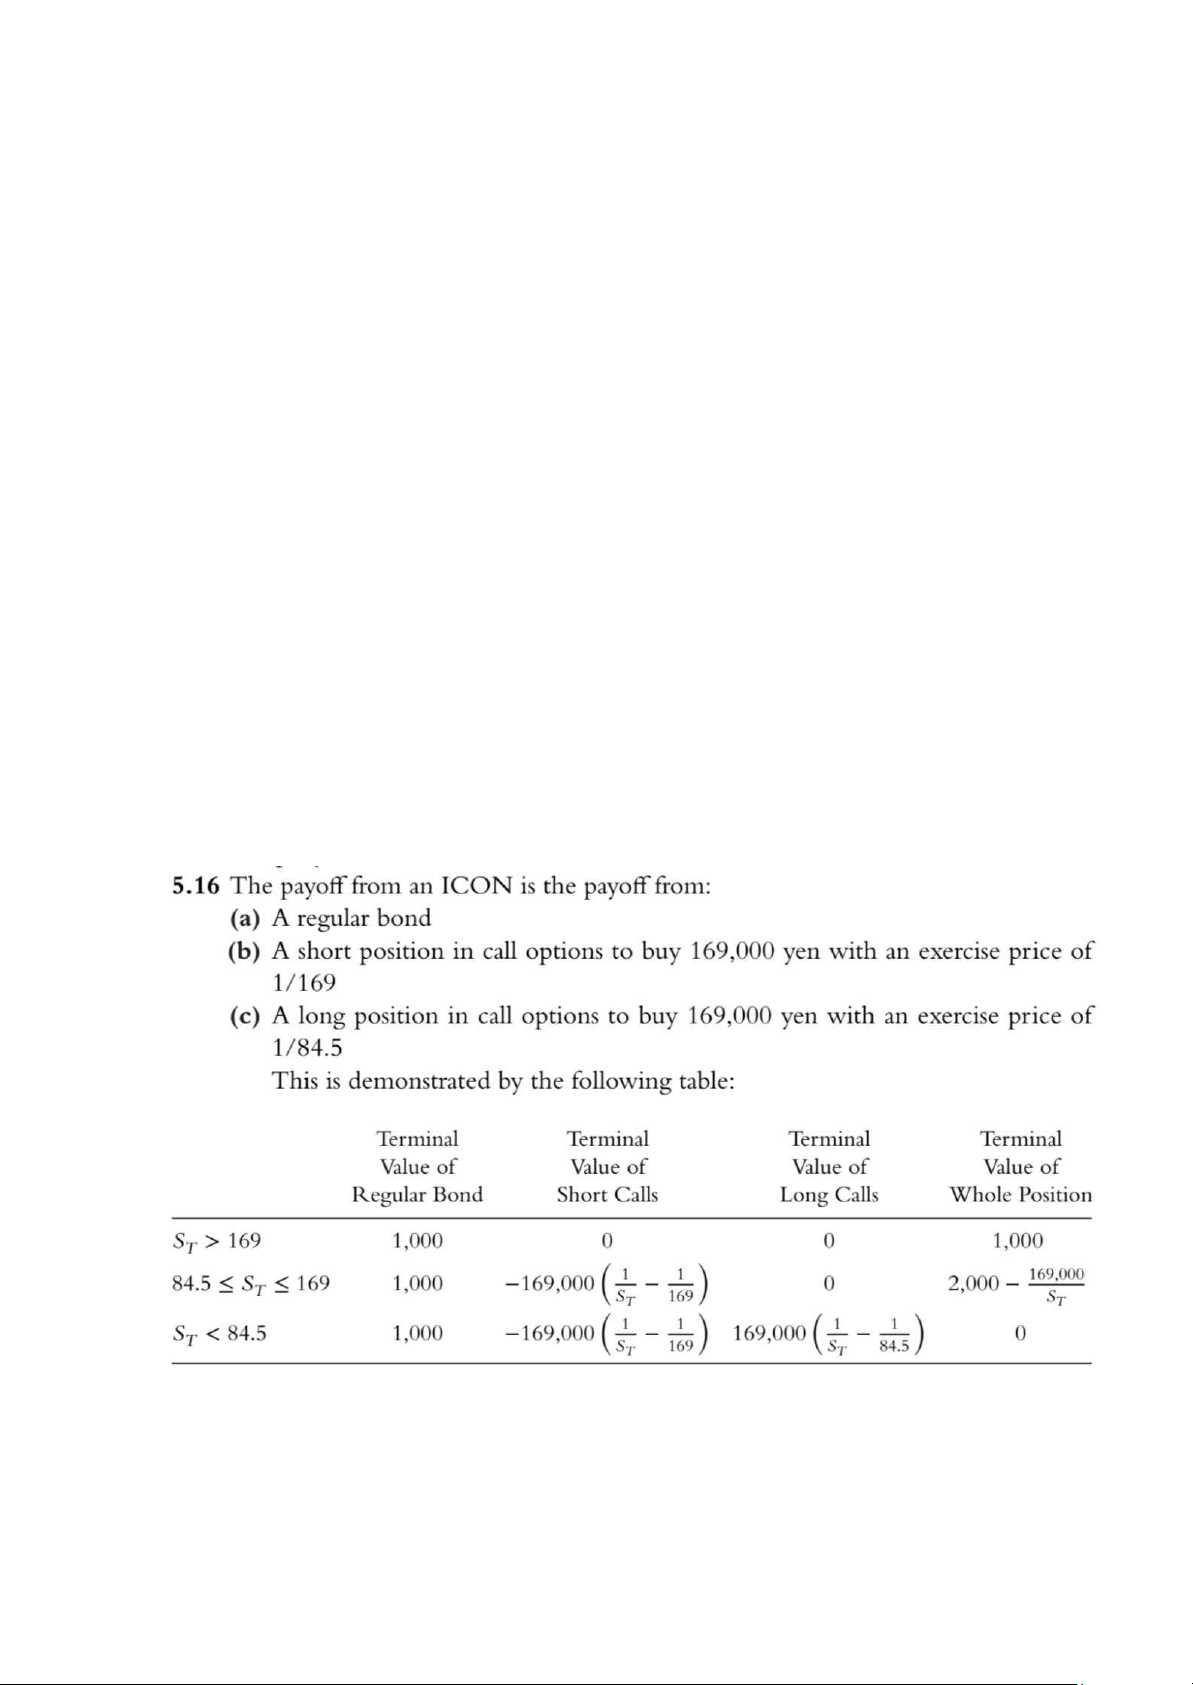
bids are lower. 9-14 trong sách CHAPTER5
1. When a trader enters into a long forward contract, she is agreeing to buy the underlying asset
for a certain price at a certain time in the future. When a trader enters into a short forward
contract, she is agreeing to sell the underlying asset for a certain price at a certain time in the future. lOMoAR cPSD| 58562220
2. A trader is hedging when she has an exposure to the price of an asset and takes a position in a
derivative to offset the exposure. In a speculation, the trader has no exposure to offset. She is
betting on the future movements in the price of the asset. Arbitrage involves taking a position
in two or more different markets to lock in a profit.
3. In the first case, the trader is obligated to buy the asset for $50. (The trader does not have a
choice.) In the second case, the trader has an option to buy the asset for $50. (The trader does
not have to exercise the option.)
4. Selling a call option involves giving someone else the right to buy an asset from you for a certain
price. Buying a put option gives you the right to sell the asset to someone else.
5. Short Forward Contract: A short forward contract obligates the investor to sell an asset at a
predetermined price (the forward price) on a specific future date. Given:
● Contract size: 100,000 British pounds
● Forward price: 1.3000 US dollars per pound
Case (a): Spot price = 1.3900 USD/GBP
● The investor is obligated to sell pounds at 1.3000 USD/GBP, but the market rate is higher at 1.3900 USD/GBP.
● This means the investor could have sold the pounds at a higher price in the market.
● Loss: (1.3900 - 1.3000) * 100,000 = $9,000
Case (b): Spot price = 1.3200 USD/GBP
● The investor is obligated to sell pounds at 1.3000 USD/GBP, but the market rate is lower at 1.3200 USD/GBP.
● This means the investor is forced to sell at a lower price than the market rate.
● Gain: (1.3000 - 1.3200) * 100,000 = -$2,000 (or a loss of $2,000)
Therefore, the investor gains $9,000 in case (a) and loses $2,000 in case (b).
6. Understanding the Short Position: When a trader takes a short position in a futures contract,
they agree to sell the underlying asset (in this case, cotton) at a specified future date and price. Given:
● Contract size: 50,000 pounds
● Initial futures price: 50 cents per pound
Case (a): Spot price at contract expiration = 48.20 cents per pound
● Profit: Since the spot price is lower than the contract price, the trader can buy the cotton at the
lower spot price and sell it at the higher contract price.
● Profit per pound: 50 cents - 48.20 cents = 1.8 cents
● Total profit: 1.8 cents/pound * 50,000 pounds = $900
Case (b): Spot price at contract expiration = 51.30 cents per pound lOMoAR cPSD| 58562220
● Loss: The spot price is higher than the contract price. The trader must buy the cotton at the
higher spot price to fulfill the contract, and then sell it at the lower contract price.
● Loss per pound: 51.30 cents - 50 cents = 1.3 cents
● Total loss: 1.3 cents/pound * 50,000 pounds = $650
Therefore, the trader gains $900 in case (a) and loses $650 in case (b).
7. By writing a put contract with a strike price of $40, you've obligated yourself to buy 100 shares
of the stock at $40 per share, regardless of the market price at the expiration date. This is
a bearish strategy, as you're betting that the stock price will decrease.
Potential Gains and Losses:
Scenario 1: Stock Price at Expiration is Below $40
● Profit: If the stock price falls below $40, the option holder will exercise their right to sell the
stock to you at $40. You'll then have to buy the stock at $40 and sell it at the lower market price.
● Example: If the stock price drops to $35, you'll lose $5 per share, or a total of $500 on the 100
shares. However, you received a premium for writing the contract (let's say $2 per share). So,
your net loss would be $500 - $200 = $300.
Scenario 2: Stock Price at Expiration is Above $40
● Loss: If the stock price remains above $40, the option holder won't exercise their right, and the
option will expire worthless. In this case, you keep the premium received for writing the
contract, which is your profit. In summary:
● Maximum Loss: The maximum loss is limited to the strike price minus the premium received.
● Maximum Gain: The maximum gain is the premium received.
It's important to note that the actual profit or loss will depend on the specific premium received for
writing the put contract and the exact stock price at expiration.
8. The over-the-counter (OTC) market is a market where financial institutions, fund managers, and
corporate treasurers get in touch with each other directly and can enter into relatively large
mutually acceptable transactions. An exchange-traded market is a market organized by an
exchange where traders either meet physically or communicate electronically and the contracts
that can be traded have been defined by the exchange. (a) OTC, (b) exchange, (c) both, (d) OTC, (e) OTC.
9. Two Investment Strategies
Strategy 1: Direct Stock Purchase Investment:
● You would buy $5,800 worth of stock, which is approximately 200 shares ($5,800 / $29 per share). Potential Gains: lOMoAR cPSD| 58562220
● If the stock price rises, your investment will appreciate. For example, if the stock price rises to
$35, your 200 shares would be worth $7,000, resulting in a profit of $1,200. Potential Losses:
● If the stock price falls, your investment will depreciate. For example, if the stock price falls to
$25, your 200 shares would be worth $5,000, resulting in a loss of $800.
Strategy 2: Call Option Purchase Investment:
● You would use the $5,800 to buy approximately 2,000 call options ($5,800 / $2.90 per option). Potential Gains:
● If the stock price rises above the strike price of $30, the call option will become more valuable.
For example, if the stock price rises to $35, the call option would be worth $5, and your 2,000
options would be worth $10,000, resulting in a profit of $4,200. Potential Losses:
● If the stock price remains below the strike price of $30 at the expiration date, the call option
will expire worthless, and you will lose your entire investment of $5,800. Key Differences:
● Leverage: The call option strategy offers leverage, as a small investment can yield significant
returns if the stock price rises.
● Risk: The call option strategy has a limited downside (the initial investment), but the upside is
also limited. The stock purchase strategy has unlimited upside potential, but also unlimited downside risk. Choosing the Right Strategy:
The best strategy depends on your risk tolerance and market outlook. If you believe the stock price will
rise significantly, the call option strategy can offer higher potential returns. However, if you're more
risk-averse, the direct stock purchase strategy might be a safer option.
10. Using Put Options for Portfolio Protection lOMoAR cPSD| 58562220
Understanding Put Options
A put option gives the holder the right, but not the obligation, to sell a specified number of shares of a
stock at a predetermined price (the strike price) on or before a specific expiration date.
Protecting Your Stock Portfolio with a Protective Put
To protect your 5,000 shares, you could consider buying put options with a strike price of $24 and an
expiration date of four months. This would create a protective put strategy. How it works:
1. Purchase Put Options: Buy 50 put options, each covering 100 shares, with a strike price of $24.
2. Pay the Premium: You'll need to pay a premium for each put option. This is the cost of the insurance.
3. Potential Scenario: If the stock price falls below $24 within the next four months, you can
exercise your put options to sell your shares at the higher strike price, limiting your losses.
Benefits of a Protective Put:
● Downside Protection: It provides a floor for your investment, limiting potential losses.
● Flexibility: You can choose the strike price and expiration date to suit your specific needs.
● Potential for Profit: If the stock price rises, you can still benefit from the upside.
Costs of a Protective Put:
● Premium Cost: You'll need to pay a premium for the put options, which reduces your potential profit.
● Time Decay: As the expiration date approaches, the value of the option may decrease, even if
the stock price remains stable.
Important Considerations:
● Timing: Consider the timing of your protection. If you expect a short-term dip, a shorter-term
option might be sufficient. For longer-term protection, a longer-term option may be more appropriate.
● Strike Price: Choose a strike price that offers adequate protection. A lower strike price provides
more protection but also costs more.
● Premium Cost: Balance the cost of the premium with the level of protection you need.
By carefully considering these factors, you can use put options to effectively protect your stock portfolio from downside risk. 11. Stock Options:
● A Contract Between Two Parties: A stock option is a contract between two investors. One
investor (the option writer) sells the option to another investor (the option buyer). lOMoAR cPSD| 58562220
● No Direct Funds for the Company: The company itself is not directly involved in the
transaction. It doesn't receive any funds from the sale of the option.
● Derivative Security: A stock option is a derivative security, meaning its value is derived from
the underlying asset (the company's stock). Stock Issuance:
● Direct Sale by the Company: When a company issues new shares, it's directly selling a portion
of its ownership to investors.
● Direct Funding for the Company: The company receives the proceeds from the sale of these
shares, which can be used to fund operations, investments, or debt repayment.
● Primary Market Transaction: The initial sale of shares by a company to investors is a primary market transaction.
In essence, stock options are financial instruments that allow investors to speculate on the future price
of a stock without actually owning the stock itself. On the other hand, when a company issues new
shares, it's raising capital to fund its operations and growth.
12. When Will the Option Holder Make a Profit?
The option holder will make a profit if the stock price at expiration in March is higher than the strike price of $50. Why?
● Profit Calculation: Profit per share = (Stock Price at Expiration - Strike Price) - Option Premium
● To make a profit, the stock price must exceed the sum of the strike price and the option premium.
When Will the Option Be Exercised?
The option will be exercised if the stock price at expiration is higher than the strike price of $50. Why?
● Exercising the Option: By exercising the option, the holder can buy the stock at the lower
strike price and then sell it at the higher market price, realizing a profit.
● No Obligation: The option holder is not obligated to exercise the option. They can choose to
let it expire if the stock price is lower than the strike price. In Summary:
The option holder will make a profit and exercise the option if the stock price at expiration is greater
than $52.50 ($50 strike price + $2.50 option premium).
13. Scenario 1: Stock Price in June is Greater Than $60
● Option Exercise: The option holder won't exercise the put option because they can sell the
stock at a higher market price.
● Seller's Profit: The seller keeps the $4 premium received for selling the put option, making a profit. lOMoAR cPSD| 58562220
Scenario 2: Stock Price in June is Between $56 and $60
● Option Exercise: The option holder will exercise the put option to sell the stock at $60, which
is higher than the market price.
● Seller's Profit: Even though the seller is obligated to buy the stock at $60, they still made a
profit of $4 (the premium received) from selling the put option.
Scenario 3: Stock Price in June is Less Than $56
● Option Exercise: The option holder will exercise the put option to sell the stock at $60.
● Seller's Loss: The seller is obligated to buy the stock at $60, even though the market price is
lower. This results in a loss.
So, as you correctly stated, the seller of the put option makes a profit as long as the stock price in June is above $56.
14. A long position in a four-month put option can provide insurance against the exchange rate
falling below the strike price. It ensures that the foreign currency can be sold for at least the strike price.
15. The company could enter into a long forward contract to buy 1 million Canadian dollars in six
months. This would have the effect of locking in an exchange rate equal to the current forward
exchange rate. Alternatively, the company could buy a call option giving it the right (but not the
obligation) to purchase 1 million Canadian dollars at a certain exchange rate in six months. This
would provide insurance against a strong Canadian dollar in six months while still allowing the
company to benefit from a weak Canadian dollar at that time. 16.
17. Analyzing Arbitrage Opportunities in the Given Scenarios
Scenario (a): 180-day European Call Option lOMoAR cPSD| 58562220 Option Details: ● Strike Price: $1.27 ● Option Premium: 2 cents Arbitrage Opportunity:
In this scenario, there is no clear arbitrage opportunity.
To profit from the call option, the spot rate at expiration must be significantly higher than the strike
price of $1.27, to offset the premium paid. However, the 180-day forward rate of $1.3018 suggests that
the market expects the spot rate to be around this level.
While there's a potential for profit, it's not a guaranteed arbitrage opportunity as it relies on significant market movements.
Scenario (b): 90-day European Put Option Option Details: ● Strike Price: $1.34 ● Option Premium: 2 cents Arbitrage Opportunity:
Here, there's a potential arbitrage opportunity. Arbitrage Strategy:
1. Sell the Put Option: Receive a premium of 2 cents.
2. Borrow $1.32: This is the present value of $1.34, discounted at the 90-day forward rate.
3. Invest the $1.32: Invest this amount at the risk-free rate for 90 days. 4. At Maturity:
○ If the spot rate is less than $1.34, the put option will be exercised. You'll receive $1.34 and repay the loan of $1.32.
○ If the spot rate is greater than $1.34, the put option will expire worthless. You'll still have
the investment from step 3, which, along with the premium received, will cover the loan repayment. Profit:
Regardless of the spot rate at maturity, the arbitrageur will make a risk-free profit from the option
premium and the interest earned on the investment. Note:
In real-world scenarios, factors like transaction costs, market liquidity, and exchange rate volatility can
affect the feasibility of arbitrage opportunities. Additionally, regulatory restrictions and capital
requirements may limit the ability to execute such strategies. lOMoAR cPSD| 58562220
18. It enters into a five-year swap where it pays 3.30% and receives LIBOR. Its invest- ment is then at LIBOR minus 0.30%.
19. It enters into a five-year swap where it receives 3.26% and pays LIBOR. Its net cost of
borrowing is LIBOR plus 1.74%.
20. It enters into a three-year swap where it receives LIBOR and pays 3%. Its net borrowing cost
for the three years is then 4% per annum.
21. Suppose that the weather is bad and the farmer’s production is lower than expected. Other
farmers are likely to have been affected similarly.Corn production overall will be low and as a
consequence the price of corn will be relatively high.The farmer is likely to be overhedged
relative to actual production.The farmer’s problems arising from the bad harvest will be made
worse by losses on the short futures position.This problem emphasizes the importance of
looking at the big picture when hedging. The farmer is correct to question whether hedging price
risk while ignoring other risks is a good strategy.
22. It may well be true that there is just as much chance that the price of oil in the future will be
above the futures price as that it will be below the futures price. This means that the use of a
futures contract for speculation would be like betting on whether a coin comes up heads or tails.
But it might make sense for the airline to use futures for hedging rather than speculation. The
futures contract then has the effect of reducing risks. It can be argued that an airline should not
expose its shareholders to risks associated with the future price of oil when there are contracts available to hedge the risks.
23. Microsoft is choosing an option on a portfolio of assets instead of the correspond- ing portfolio
of options. The former is always less expensive because there is the potential for an increase in
the price of one asset to be netted off against a decrease in the price of another asset. Compare
(a) an option with a strike price of $20 on a portfolio of two assets each worth $10 and (b) a
portfolio of two options with a strike price of $10, one on each of the assets. If both assets
increase in price or both assets decrease in price, the payoffs are the same. But if one decreases
and the other increases, the payoff from (a) is less than that from (b). Both the Asian feature and
the basket feature in Microsoft’s options help to reduce the cost of the options because of the
possibility of gains and losses being netted.
24. It means that the price of the energy source can go up or down but will tend over time to get
pulled back to its long-run average level. Electricity has the highest rate of mean reversion; oil has the lowest.
25. As we increase the frequency with which the asset price is observed, the asset price becomes
more likely to hit the barrier and the value of a knock-out call goes down.
26. To calculate the payoff of the call option on the cumulative CDD, we first need to determine the total degree days for July.
Calculating Degree Days:
● Average Daily Temperature: (68°F + 82°F) / 2 = 75°F
● Degree Days per Day: 75°F - 65°F (base temperature) = 10 degree days
● Total Degree Days for July: 10 degree days/day * 31 days = 310 degree days
Calculating the Option Payoff:
● Payoff: max(0, Total Degree Days - Strike Price) * Payment Rate
● Payoff = max(0, 310 - 250) * $5,000
● Payoff = max(0, 60) * $5,000 lOMoAR cPSD| 58562220 ● Payoff = $300,000
Therefore, the payoff from the call option on the cumulative CDD during July is $300,000.
27. Let's break down the 5x8 contract with daily and monthly exercise: 5x8 Contract:
● 5: Refers to 5 days per week.
● 8: Refers to the 8th month of the year, which is August. Daily Exercise:
● Flexibility: The holder can choose to exercise the option on any of the 5 weekdays during the off-peak period.
● Higher Potential Value: This flexibility allows the holder to capitalize on higher electricity
prices on specific days, maximizing potential profits. Monthly Exercise:
● Less Flexibility: The holder must choose at the beginning of the month whether to exercise the
option for all 5 weekdays during the off-peak period.
● Lower Potential Value: This reduces the potential for profit, as the holder cannot adjust their
position based on daily price fluctuations.
Therefore, the 5x8 option with daily exercise is generally worth more than the one with monthly exercise.
The ability to make daily decisions based on real-time market conditions provides the option holder
with greater control and potential for profit.
28. Two calculations are necessary to determine the initial margin. The first gives
500 × (3.5 + 0.2 × 57 − 3) = 5,950 The second gives
500 × (3.5 + 0.1 × 57) = 4,600
The initial margin is the greater of these, or $5,950. Part of this can be provided by the initial amount of
$500 × 3.5 = $1,750 received for the options.
29. The cost of the shares is $500 × 50 or $25,000. When shares are shorted, the proceeds of the
sale form part of the margin. In this case, the total margin required is 1.6 × $25,000, or $40,000.
The extra margin required is therefore $15,000. This can be in the form of cash or marginable
securities. When the share price rises to S, the value of the underlying position is 500S. There
is a margin call when 40,000 < 1.3 × 500S or S > 61.54. lOMoAR cPSD| 58562220
30. A broker sets an initial margin and a maintenance margin. When the balance in the margin
account falls below the maintenance margin level, the broker’s client is required to bring it back
up to the initial margin level. The exchange clearing house, when dealing with its members, sets
the initial margin and maintenance margin to be the same. Every day the balance in the margin
account must be at this level or more.
31. Margin Call and Withdrawal in a Short Futures Contract Margin Call
A margin call occurs when the value of the position falls below the maintenance margin. In this case,
the trader must deposit additional funds to bring the account balance back up to the initial margin level.
Calculating the Margin Call Price:
● Loss per contract: (Initial Price - Maintenance Margin) / Contract Size
● Loss per contract: ($250 - $2000) / 5000 = -$0.20
● Price change for margin call: $250 - $0.20 = $249.80
Therefore, a price increase of 20 cents per bushel would trigger a margin call.
- Withdrawing Funds: To withdraw $1,500, the account balance must exceed the maintenance margin by that amount.
Calculating the Withdrawal Price:
● Required balance for withdrawal: Maintenance Margin + $1,500 = $2,000 + $1,500 = $3,500
● Loss per contract for withdrawal: (Initial Margin - Required Balance) / Contract Size
● Loss per contract for withdrawal: ($3,000 - $3,500) / 5000 = -$0.10
● Price change for withdrawal: $250 - $0.10 = $249.90
Therefore, the price would need to increase to $249.90 per bushel for the trader to withdraw $1,500.
Note: These calculations are based on simplified assumptions. In real-world scenarios, margin
requirements can vary depending on market volatility and other factors. Additionally, brokers may have
specific rules and procedures for margin calls and withdrawals.
32. Initial Margin and Margin Call Initial Margin:
● Total cost of the stock: 200 shares * $20/share = $4,000
● Initial margin requirement: 60% * $4,000 = $2,400
Therefore, the trader needs to provide $2,400 initially. Margin Call:
A margin call occurs when the equity in the account falls below the maintenance margin.
Tài liệu liên quan:
-
Syllabus Môn Finance - Banking | Trường Đại học Quốc tế, Đại học Quốc gia Thành phố Hồ Chí Minh
109 55 -
Answers Questions and Practice problems Chapter 17 | Môn Finance - Banking - Trường Đại học Quốc tế, Đại học Quốc gia Thành phố Hồ Chí Minh
103 52 -
Solution Stocks Môn Finance - Banking | Trường Đại học Quốc tế, Đại học Quốc gia Thành phố Hồ Chí Minh
117 59 -
What is Behavioral Finance | Môn Finance - Banking - Trường Đại học Quốc tế, Đại học Quốc gia Thành phố Hồ Chí Minh
110 55 -
Loan Analysis & Futures | Môn Finance - Banking - Trường Đại học Quốc tế, Đại học Quốc gia Thành phố Hồ Chí Minh
101 51