BGA Systematic analyses of AISNPs - môn Nhập môn học máy và khai phá dữ liệu | Đại học Bách Khoa Hà Nội
BGA Systematic analyses of AISNPs - môn Nhập môn học máy và khai phá dữ liệu | Đại học Bách Khoa Hà Nội. Tài liệu giúp bạn tham khảo, ôn tập và đạt kết quả cao. Mời đọc đón xem!
Môn: Nhập môn học máy và khai phá dữ liệu 15 tài liệu
Trường: Đại học Bách Khoa Hà Nội 5.8 K tài liệu
Tác giả:


Preview text:
Forensic Science International 357 (2024) 111975
Contents lists available at ScienceDirect
Forensic Science International
journal homepage: www.elsevier.com/locate/forsciint
Systematic analyses of AISNPs screening and classification algorithms
based on genome-wide data for forensic biogeographic ancestry inference
Meiming Cai a, Fanzhang Lei a, Man Chen a, Qiong Lan a,b, Xiaolian Wu a, Chen Mao c,*,
Meisen Shi d,*, Bofeng Zhu a,*
a Guangzhou Key Laboratory of Forensic Multi-Omics for Precision Identification, School of Forensic Medicine, Southern Medical University, Guangzhou, Guangdong, China
b Microbiome Medicine Center, Department of Laboratory Medicine, Zhujiang Hospital, Southern Medical University, Guangzhou, Guangdong, China
c Department of Epidemiology, School of Public Health, Southern Medical University, Guangzhou, Guangdong, China
d Criminal Justice College of China University of Political Science and Law, Beijing, China A R T I C L E I N F O A B S T R A C T Keywords:
Identifying the biogeographic ancestral origin of biological sample left at a crime scene can provide important Biogeographical ancestry
evidence for judicial case, as well as clue for narrowing down suspect. Ancestry informative single nucleotide AISNP
polymorphism (AISNP) has become one of the most important genetic markers in recent years for screening Machine learning
ancestry information loci and analyzing the population genetic background and structure due to their high Feature selection
number and wide distributions in the human genome. In this study, based on data from 26 populations in the
1000 Genomes Project Phase 3, a Random Forest classification model was constructed with one-vs-rest classi-
fication strategy for embedded feature selection in order to obtain a panel with a small number of efficient
AISNPs. The research aim was to clarify differentiations of population genetic structures among continents and
subregions of East Asia. ADMIXTURE results showed that based on the 58 AISNPs selected by the machine
learning algorithm, the 26 populations involved in the study could be categorized into six intercontinental
ancestry components: North East Asia, South East Asia, Africa, Europe, South Asia, and America. The 24
continental-specific AISNPs and 34 East Asian-specific AISNPs were finally obtained, and used to construct the
ancestry prediction model using XGBoost algorithm, resulting in the Matthews correlation coefficients of 0.94
and 0.89, and accuracies of 0.94 and 0.92, respectively. The machine learning models that we constructed using
population-specific AISNPs were able to accurately predict the ancestral origins of continental and intra-East
Asian populations. To summarize, screening a set of high-perform AISNPs to infer biogeographical ancestral
information using embedded feature selection has potential application in creating a layered inference system
that accurately differentiates from intercontinental populations to local subpopulations. 1. Introduction
polymorphisms, low mutation rates, and shorter amplified fragments
which are better suited for multiplex polymerase chain reaction (PCR)
If the biogeographical ancestor of the person from whom the bio-
based on capillary electrophoresis platform and successful genotyping of
logical samples originated can be deduced, it will be possible to provide
severely degraded biological materials. Many AISNP panels have been
key investigative clues for the case, lock in the scope of the suspect, and
published previously, most of which could distinguished among inter-
clarify the direction of the investigation[1]. Ancestry inference is to
continental populations[2–6]. However, the above previously published
calculation the ancestral composition of a population’s genetic struc-
detection systems of ancestry inference were less able to further subdi-
ture, or infer the ancestral origin of an individual by evaluating a series
vision of the East Asian populations. Constructing a hierarchical infer-
of ancestry informative markers (AIM). Researchers mostly performed
ence system to distinguish the accuracy from inferring intercontinental
ancestry inference research with single nucleotide polymorphism (SNP)
populations to localized subgroups is a must for future forensic genetic
genetic markers, which provide many advantages: relatively higher
development. Nevertheless, the majority of SNP combinations were * Corresponding authors.
E-mail addresses: maochen9@smu.edu.cn (C. Mao), shimeisen2000@163.com (M. Shi), zhubofeng7372@126.com (B. Zhu).
https://doi.org/10.1016/j.forsciint.2024.111975
Received 19 November 2023; Received in revised form 23 January 2024; Accepted 1 March 2024 Available online 2 March 2024
0379-0738/© 2024 Elsevier B.V. All rights reserved. M. Cai et
Forensic Science International al. 357 (2024) 111975
derived by assessing the genetic differentiation index (FST) and the allele
distances of the loci on the same chromosome are greater than 10 Mb
frequency difference (δ) values among populations. This approach
and the pairwise loci conform to linkage equilibrium (R2 less than 0.4);
focused more on the selection of single optimal SNP and was less
(4) all selected AISNP loci conform to the Hardy-Weinberg equilibrium
effective for near-population delineation. Hence, it is a crucial task to
(HWE) in all reference populations; (5) pairwise intercontinental pop-
develop machine learning algorithms to screen the best combinations of
ulations with δ values greater than 0.5; δ values greater than 0.3 between
AISNPs, and then explore promising discriminative methods for forensic
the AMR and the other populations, and between the EUR and SAS ancestry inference.
populations, (6) δ values are greater than 0.25 between EAS populations,
Machine learning algorithms excel at extracting those loci with high
(7) loci with δ values in the top 10 loci in descending order per chro-
ancestral information inference efficiency from large-scale genome-wide
mosome between the populations are selected. We also added some
datasets, due to their capacity to handle high-dimensional data. Several
AISNP loci from previously published studies[5,10–12]. Removing
feature selection techniques, using various models, have been developed
duplicate loci in two methods mentioned above and pairwise AISNP loci
to identify the appropriate set of features for population genetics data[7,
in linkage disequilibrium (LD), a total of 1750 AISNPs with potential for
8]. Feature selection is able to eliminate irrelevant or redundant fea-
ancestry information inference were finally obtained in this study.
tures, thus achieving the purpose of reducing the number of features and
improving the model accuracy. According to the form of feature selec-
2.3. Dimensionality reduction analysis and visualization
tion, it is mainly divided into three categories: filtering, packing and
embedding. The feature selection processes of filtering and packing al-
The theoretical basis for realizing high-dimensional data visualiza-
gorithms are obviously different from the learner training process, while
tion is based on dimensionality reduction algorithms. The dimension-
the embedded feature selection integrates the feature selection process
ality reduction algorithms are generally classified into two categories:
with the learner training process, and the two are completed in the same
(1) algorithms such as principal component analysis (PCA), multidi-
optimization process, i.e., feature selection is carried out automatically
mensional scaling (MDS), can be good for presenting global character-
in the learner training process. Therefore, this study was based on the
istics of the data; and (2) t-distributed stochastic neighbor embedding (t-
Random Forest (RF) algorithm using one-vs-rest classification strategy
SNE), uniform manifold approximation and projection (UMAP), tend to
for the embedded feature selection. In RF algorithm, each decision tree
preserve the local structural features of the data. The nature of PCA is an
was trained based on a random subset of features. By calculating the
unsupervised model, in the model the grouping of each sample is un-
importance of each feature, its degree of contribution to the model
known, and the analysis is performed purely on the basis of the char-
performance could be evaluated. And the one-vs-rest classification
acteristics of the data. The MDS algorithm makes the visualization and
strategy could transform a multi-category problem into multiple binary
analysis of the data more intuitive by downscaling the high-dimensional
classification problems, so that feature selection could be performed for
data into two or three dimensions. Both t-SNE and UMAP are commonly
each category. Furthermore, in order to explore an optimal method to
used nonlinear dimensionality reduction techniques for mapping high-
construct the discriminative model, this study built the inference pre-
dimensional data into low-dimensional spaces.
diction models based on six different machine learning algorithms,
In order to clarify the approximate genetic distribution pattern of
including the K Nearest Neighbors (KNN), Linear Discriminant Analysis
2504 individuals in the 1000 Genomes Project Phase 3 based on the
(LDA), Support Vector Machines (SVM), Neural Networks (NN),
selected 1750 AISNPs, the PLINK 2.0 software was used for PCA at the XGBoost, and RF algorithms.
individual level. In addition, we performed MDS, t-SNE and UMAP
In this study, we performed feature selection for distinguishing
dimensionality reduction analyses and visualization operations succes-
intercontinental and intra-East Asian populations based on the RF
sively using the ‘stats’, ‘Rtsne’, ‘umap’ and ‘ggplot2’ R packages on the R
classification algorithm using the one-vs-rest classification strategy to
software (v4.2.2; http://www.r-project.org/), respectively.
obtain a set of 58 AISNPs. The 24 AISNPs and 34 AISNPs were used to
infer biogeographic ancestry information at the continental and intra- 2.4. Feature selection
East Asian levels, respectively. In addition, six machine learning algo-
rithms were used to construct predictive models for ancestry informa-
‘OneVsRestClassifier’ and ‘RandomForestClassifier’ from the scikit-
tion inference, and the performances of the six methods were evaluated
learn library of python v3.8 software were used to construct multiclass
by the f1 score, Matthews correlation coefficient (MCC), and area under
classifiers for intercontinental and intra-EAS distinction purposes,
the receiver operating characteristic curve (AUC-ROC).
respectively. And the ‘GridSearchCV’ from scikit-learn library was also
used to search for optimal Random Forest model parameters. Then,
2. Materials and methods
adjust the parameters such as the number of trees, depth, and minimum
number of leaf nodes. Meanwhile, use ‘learning_curve’ function in scikit-
2.1. Sample set sources
learn library for learning curve plotting. The feature importance of each
classifier was determined, and the top 10 loci specific to the continent
This study used population data from the 1000 Genomes Project
and the top 20 loci specific to East Asia in descending order were
Phase 3[9], which consists of 26 populations with a total of 2504 in-
selected. Additionally, the learning curve of each classifier was plotted
dividuals. There were five East Asian populations (EAS), five European
to illustrate the 10-fold cross-validated classification accuracy of the RF
populations (EUR), five South Asian populations (SAS), seven African
model when using different numbers of loci.
populations (AFR), and four American populations (AMR). Detailed
information of the 26 populations could be found in Supplementary
2.5. Modeling biogeographical ancestry inference, model testing and Table 1. efficacy evaluation
2.2. Preliminary selection of AISNP loci
Various classification algorithms were used in this study, including
RF, SVM, XGBoost, LDA, KNN and NN. Corresponding classifiers were
Initial screening of AISNP loci in the 1000 Genomes Project Phase 3
introduced from the scikit-learn library of python v3.8 software,
was performed on a genome-wide scale using PLINK 2.0 software (http
including ‘RandomForestClassifier’, ‘SVC’, ‘XGBClassifier’, ‘Line-
s://www.cog-genomics.org/plink/2.0/). The basic conditions for the
arDiscriminantAnalysis’, ‘KNeighborsClassifier’ and ‘MLPClassifier’. All
screening of AISNP loci were as follows: (1) loci belong to autosomal
methods use the same dataset for multiclass classification. RF is an
SNP genetic markers and show biallelic polymorphisms; (2) AISNP loci
ensemble learning method that combines multiple decision trees to
with minimum allele frequencies greater than 0.01; (3) the physical
make predictions. It randomly selects subsets of data to build each tree, 2 M. Cai et
Forensic Science International al. 357 (2024) 111975
and then aggregates the results from all trees to make the final predic-
fold cross validation accuracy was also used as an indicator to assess the
tion. Support Vector Classification (SVC) is an implementation of SVM, a
efficacy of each prediction model.
support vector classifier that uses some training samples to construct a
hyperplane or a set of hyperplanes which can be used for classification. 3. Results
XGBoost is an optimized gradient boosting framework that uses decision
trees as base learners. And it improves upon traditional gradient
3.1. Dimensionality reduction analyses for 1750 candidate AISNP loci
boosting by incorporating regularization technique and parallel pro-
cessing. LDA can perform supervised dimensionality reduction by pro-
The MDS, PCA, t-SNE and UMAP dimensionality reduction analyses
jecting the input data into a linear subspace consisting of directions
based on the raw genotyping data of 2504 individuals at 1750 SNP loci
which maximize the separation between classes. In classification prob-
were performed, which were shown in Fig. 1. Dots of the same color in
lems, KNN is based on the idea of finding the k nearest neighbors to a
the figure indicated different individuals of the same continental origin,
query point and using their labels to make predictions. A multilayer
with red, green, purple, blue and yellow indicating individuals from
perceptron (MLP) method has been implemented in NN, which uses
AFR, AMR, EAS, EUR and SAS, respectively. The MDS plot (Fig. 1A)
backpropagation algorithm to generate a nonlinear function approx-
revealed that in the dimensional space constituted by MDS1 and MDS2, imator for classification.
the significant separation occurred between the AFR, EAS, SAS and EUR
The dataset in this study was randomly divided into 70% training set
individuals. In contrast, the AMR clustered between SAS and EUR in-
and 30% testing set. The training set was used to train the model and the
dividuals. The results of the PCA analysis of the five continental pop-
testing data was used to independently evaluate the performance. The
ulations at the individual level (Fig. 1B) showed that populations from
six classification methods were evaluated by f1 score, MCC, and AUC-
the same geographic region clustered together and these 26 populations
ROC, respectively. In addition, all prediction models were tested using
were divided into five clusters. Since the t-SNE and UMAP methods are
10-fold cross validation, and the statistically obtained mean value of 10-
secondary dimensionality reduction treatment of PCA analysis, both
Fig. 1. The MDS (A), PCA (B), t-SNE (C) and UMAP (D) plots on basis of 1750 AISNP loci data in 2504 individuals. The AFR, AMR, EAS, EUR and SAS were labeled in
red, green, purple, blue and yellow, respectively. CDX, Chinese Dai in Xishuangbanna; JPT, Japanese in Tokyo; KHV, Kinh in Ho Chi Minh City; CHB, Chinese Beijing
Han; CHS, Chinese Southern Han; ACB, African Caribbean in Barbados; ASW, African Ancestry in Southwest USA; MSL, Mende in Sierra Leone; ESN, Esan in Nigeria;
YRI, Yoruba in Ibadan; GWD, Gambian in Western Division; LWK, Luhya in Webuye, Kenya; FIN, Finnish in Finland; CEU, Utah residents with Northern and Western
European ancestry; GBR, British in England and Scotland; IBS, Iberian populations in Spain; TSI, Toscani in Italy; ITU, Indian Telugu in the UK; PJL, Punjabi in
Lahore; STU, Sri Lankan Tamil in the UK; BEB, Bengali in Bangladesh; GIH, Gujarati Indian in Houston; CLM, Colombian in Medellin; PUR, Puerto Rican in Puerto
Rico; MXL, Mexican Ancestry in Los Angeles; PEL, Peruvian in Lima. AFR, African populations; SAS, South Asian populations; EUR, European populations; EAS, East
Asian populations; AMR, American populations. 3 M. Cai et
Forensic Science International al. 357 (2024) 111975
methods can effectively visualize the 10 principal components (PCs)
plot was roughly similar to that of t-SNE, but the former focuses on
obtained from the original analysis in a two-dimensional space. In t-SNE
preserving the global structure, and thus the distances of individuals
plot (Fig. 1C), it can be seen that EAS was divided into three clusters,
within the clusters were small, making it difficult to distinguish the
Japan, Han Chinese (CHS and CHB) and CDX and KHV (Southern East
subgroup structure. The results of the dimensionality reduction analysis
Asian populations, SEAS). And GIH was distinguished from South Asian
confirmed that the 1750 AISNPs could effectively discriminate between
populations. West African individuals (ESN, GWD) in AFR were also
AFR, EUR, SAS, AMR and EAS populations, and also suggested that the
distinguished in this plot. The distribution pattern in UMAP (Fig. 1D)
selected loci would help further differentiate subgroups in EAS.
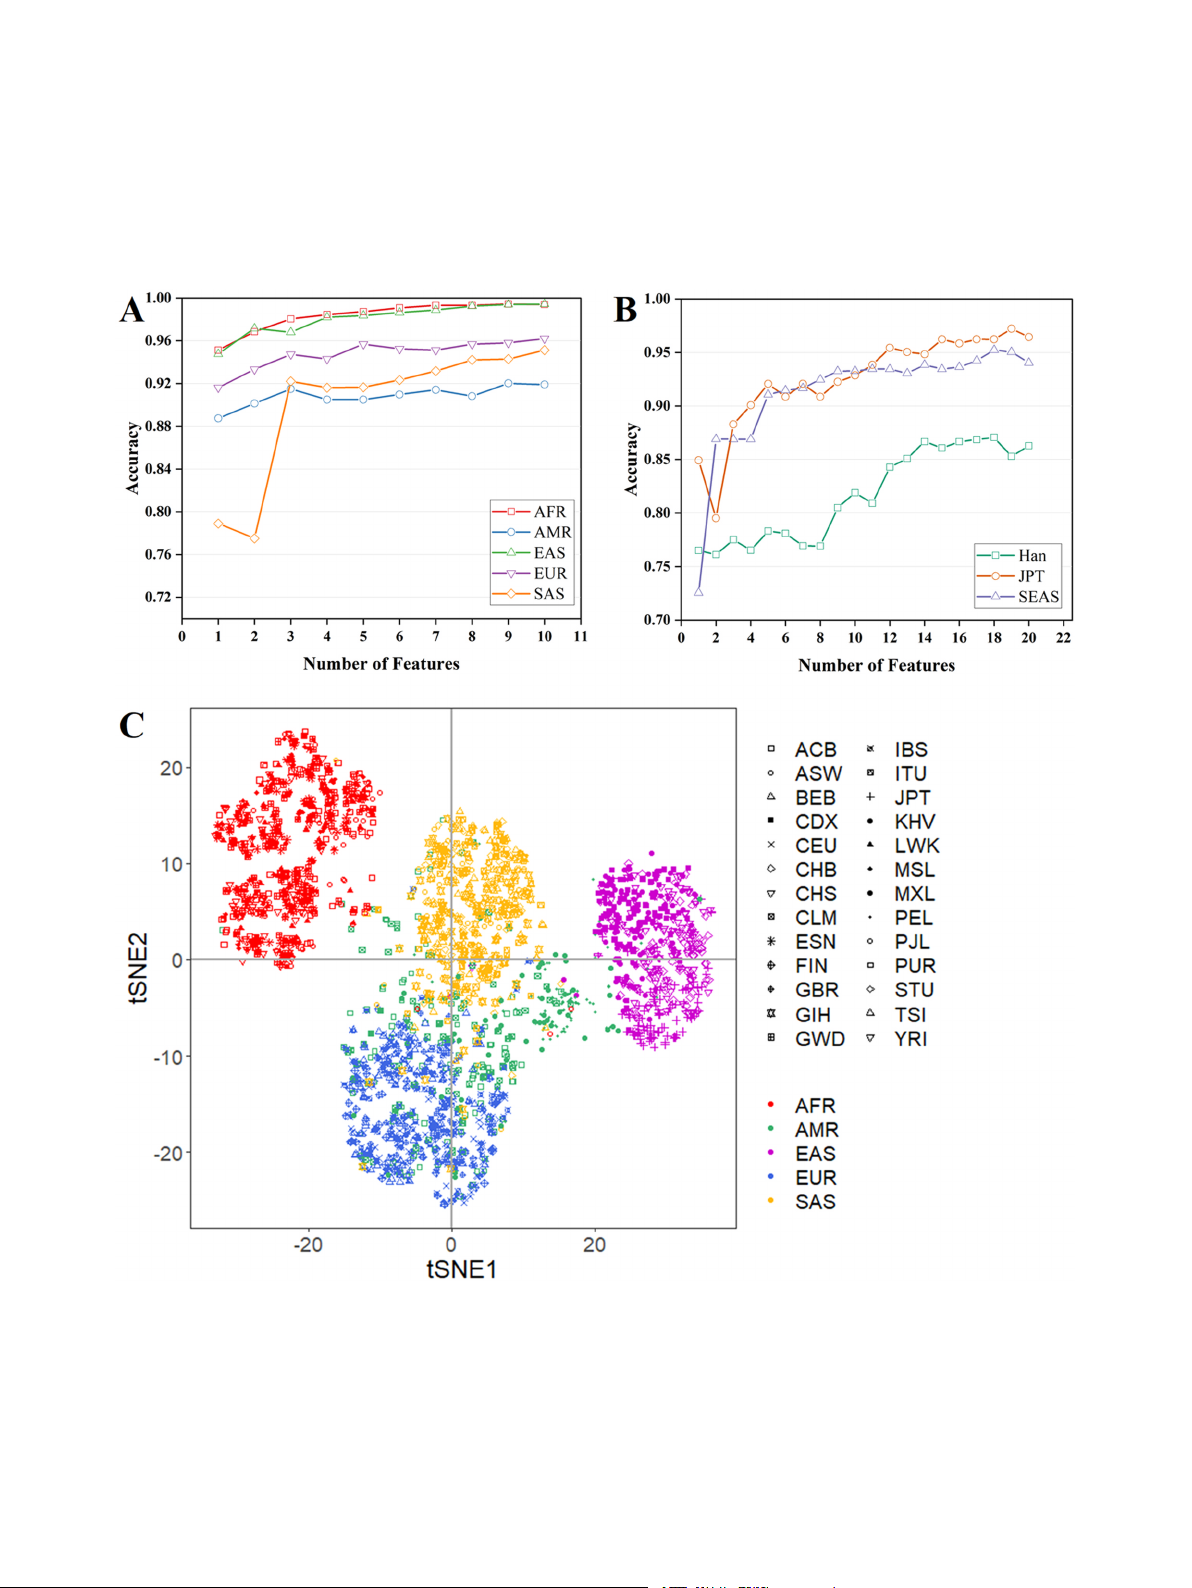
Fig. 2. (A) Learning curves based on the top 10 AISNP loci of feature importance in each classifier of the continental ancestry inference models were plotted to
represent the10-fold cross-validated classification correctness when different numbers of AISNP loci were used for the RF classification model. (B) Learning curves
were drawn based on the 20 AISNP loci with the highest feature importance in each classifier of the EAS ancestry inference model. (C) The t-SNE downscaling
analysis was performed based on raw genotyping data of 58 AISNP loci in 2504 individuals. CDX, Chinese Dai in Xishuangbanna; JPT, Japanese in Tokyo; KHV, Kinh
in Ho Chi Minh City; CHB, Chinese Beijing Han; CHS, Chinese Southern Han; ACB, African Caribbean in Barbados; ASW, African Ancestry in Southwest USA; MSL,
Mende in Sierra Leone; ESN, Esan in Nigeria; YRI, Yoruba in Ibadan; GWD, Gambian in Western Division; LWK, Luhya in Webuye, Kenya; FIN, Finnish in Finland;
CEU, Utah residents with Northern and Western European ancestry; GBR, British in England and Scotland; IBS, Iberian populations in Spain; TSI, Toscani in Italy;
ITU, Indian Telugu in the UK; PJL, Punjabi in Lahore; STU, Sri Lankan Tamil in the UK; BEB, Bengali in Bangladesh; GIH, Gujarati Indian in Houston; CLM, Colombian
in Medellin; PUR, Puerto Rican in Puerto Rico; MXL, Mexican Ancestry in Los Angeles; PEL, Peruvian in Lima. AFR, African populations; SAS, South Asian pop-
ulations; EUR, European populations; EAS, East Asian populations; AMR, American populations. 4 M. Cai et
Forensic Science International al. 357 (2024) 111975
3.2. Embedded feature selection based on random forest algorithm via
distributions of the samples were demonstrated in two dimensions. First,
multi-classification and one-vs-rest classification strategies
individual-level PCA analysis was performed based on the genotyping
data of the selected 24 AISNPs in 26 reference populations of the 1000
In order to generate a small number of features for efficient classi-
Genomes Project. In the Fig. 3A, the first two PCs explained 28.19% and
fication and to reduce model overfitting, we performed embedded
23.64% of the total variance of the genetic distributions among the
feature selection based on the RF algorithm using the multi-
intercontinental populations, respectively. In the dimensional space
classification and one-vs-rest strategies, respectively. Firstly, 746
formed by PC1 and PC2, the red, green, purple, blue and yellow dots
candidate AISNP loci were screened from 1750 AISNP loci by embedded
denoted the individuals from AFR, AMR, EAS, EUR and SAS, respec-
feature selection based on the RF model through multi-classification
tively, where the AFR individuals distributed in the lower-left quadrant,
strategy. The 357 of 746 loci showed potential for continental
EAS individuals clustered in the lower-right quadrant, SAS individuals
ancestry inference; while 432 loci had the potential for EAS ancestry
distributed in the center, and EUR individuals distributed in the upper-
inference. To further obtain fewer number loci with stronger specificity,
center, and the populations from the same geographic region roughly
a one-vs-rest classification strategy was employed for the above two sets
clustered together, whereas the partial AMR individuals distributed
of specific AISNP loci to obtain the top 10 (each continental-specific)
among the SAS, EAS and EUR individuals.
and 20 (EAS-specific) loci in terms of feature importance for each clas-
Then RF, SVM, XGBoost, LDA, KNN and NN methods were used to
sifier. And the learning curves were plotted to represent the 10-fold
build classification models for intercontinental biogeographic ancestry
cross-validated classification correctness of the RF model when using
prediction, respectively. The results of the best parameters of these six
different number of loci, and the results can be seen in Fig. 2A and B. We
models were shown in Supplementary Table 6. The performances of six
selected 24 continental-specific loci, including seven AFR ancestry loci
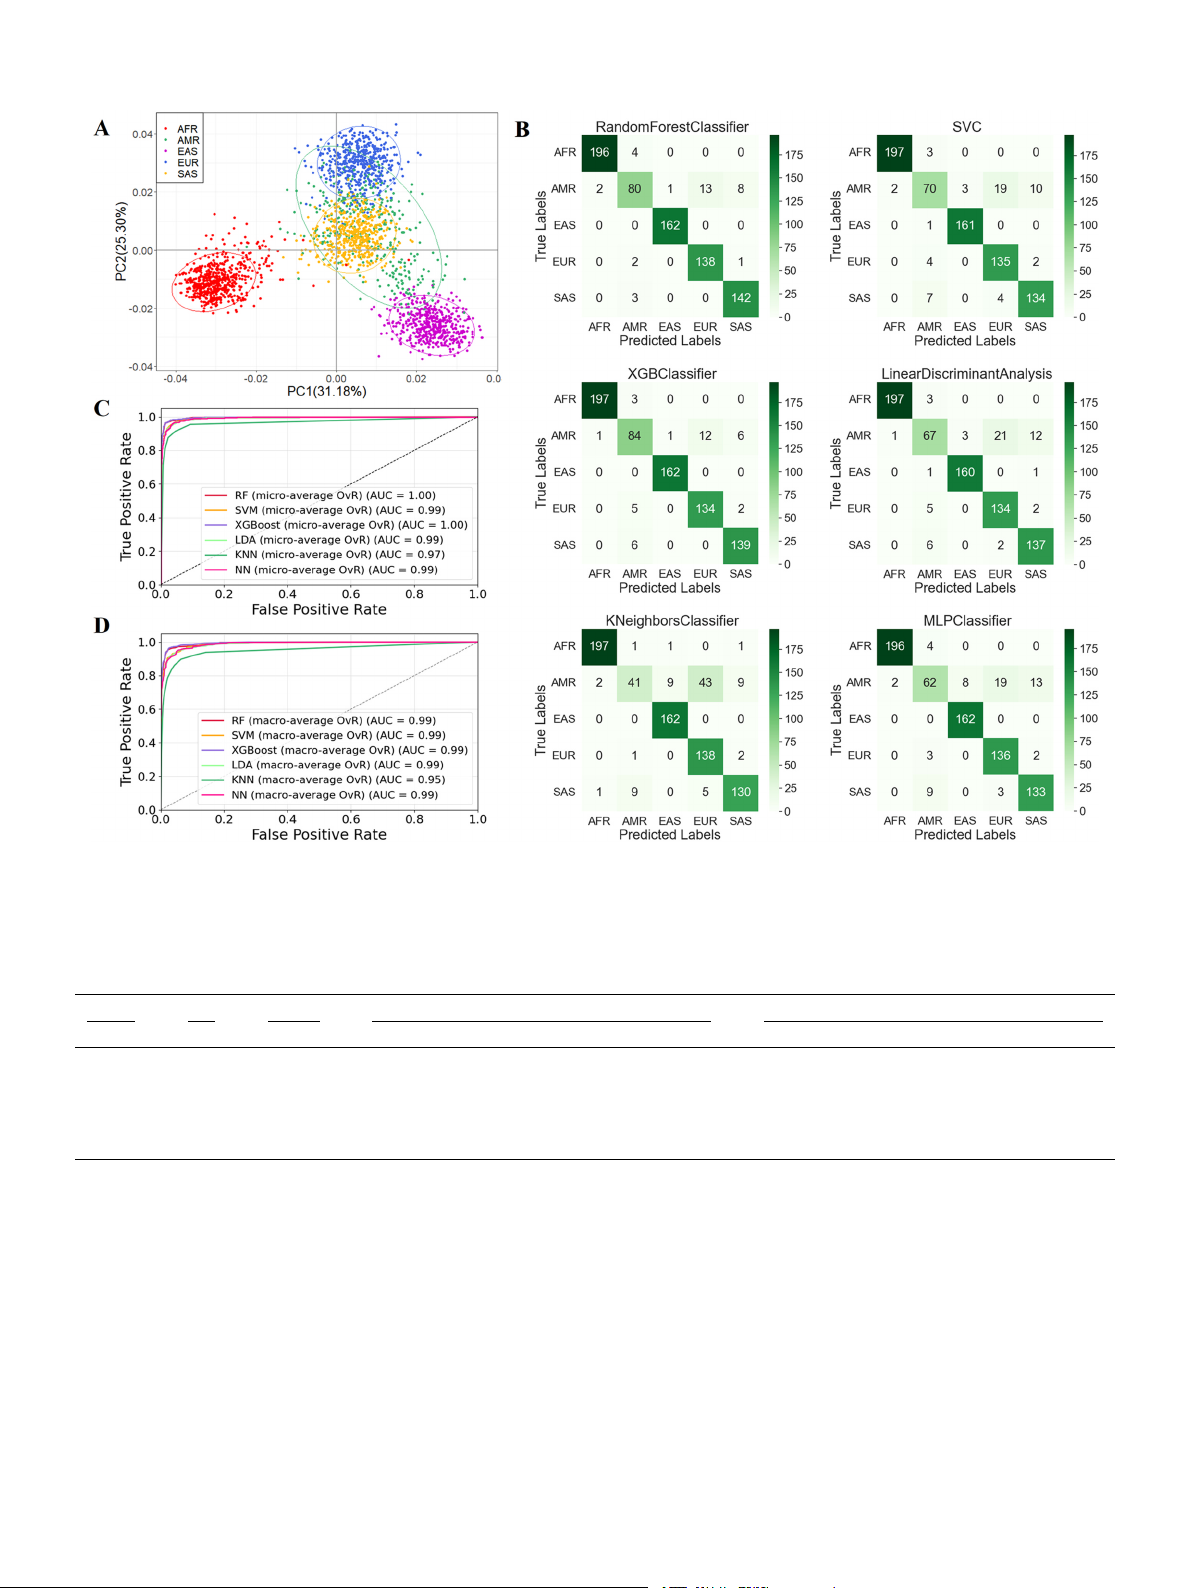
models were exhibited in Table 1 and Fig. 3B-D (Confusion Matrix and
(99.32%), one AMR ancestry locus (88.74%), seven EAS ancestry loci
ROC curve). The XGBoost and RF models achieved better classification
(98.88%), six EUR ancestry loci (95.25%) and three SAS ancestry loci
performances, with both MCC and accuracy values of 0.94. The XGBoost
(92.21%), which reached an average of 95% of the correct rate of five-
and RF models could fully identify EAS, but the XGBoost model mis-
continent categorization. For the EAS-specific loci, 12 Han Chinese
identified 1% of AFR, 7% of EUR and 5% of SAS, respectively; and the RF
ancestry loci (84.29%), 19 Japanese ancestry loci (97.22%) and 11 SEAS
model also misidentified 2% of AFR, 5% of EUR and 4% of SAS,
ancestry loci (93.47%), and by removing duplicates, we finally obtained
respectively. The f1 scores predicted by both models for AMR were 0.83.
34 EAS-specific loci, which achieved an average accuracy rate of 92%
By comparing the AUC-ROC values (Table 1), it can be found that the six
for the three-EAS classifications.
models had the best ancestral inference efficacy for EAS (AUC-ROC=1),
Details of the 58 AISNPs screened from 1000 Genomes Project Phase
and except for KNN, the other five models had the best ancestral infer-
3 using machine learning algorithms were shown in Supplementary
ence efficacy for AFR (AUC-ROC=1). In this study, the micro-averaging
Table 2. The 24 of these loci have already been reported[1,3–5,10–18],
(Fig. 3C) and macro-averaging (Fig. 3D) values of the six models were
and other 34 AISNPs are novel loci. Supplementary Tables 3 and 4
also calculated, and the ROC curves were plotted. Macro-averaging and
showed the FST and δ values of each AISNP locus for the pairwise
micro-averaging are two different methods used to calculate metrics in
intercontinental populations, and pairwise East Asian populations,
multi-category classification problems. Macro-averaging focuses on the
respectively. Among the 24 continental-specific loci, the FST and In sta-
performance of each category, while micro-averaging focuses on the
tistics for the five continental populations were 0.1270–0.6218, and
overall performance[19]. As can be seen in Figs. 3C and D, the AUC-ROC
0.0501–0.2739, respectively. The rs575377 (FST=0.1270, In=0.0501),
values of XGBoost and RF models were the same and the highest in the
rs513265 (FST=0.2581, In=0.1219), and rs2072053 (FST=0.4875, six models.
In=0.1995) have not been reported previously. At the intercontinental
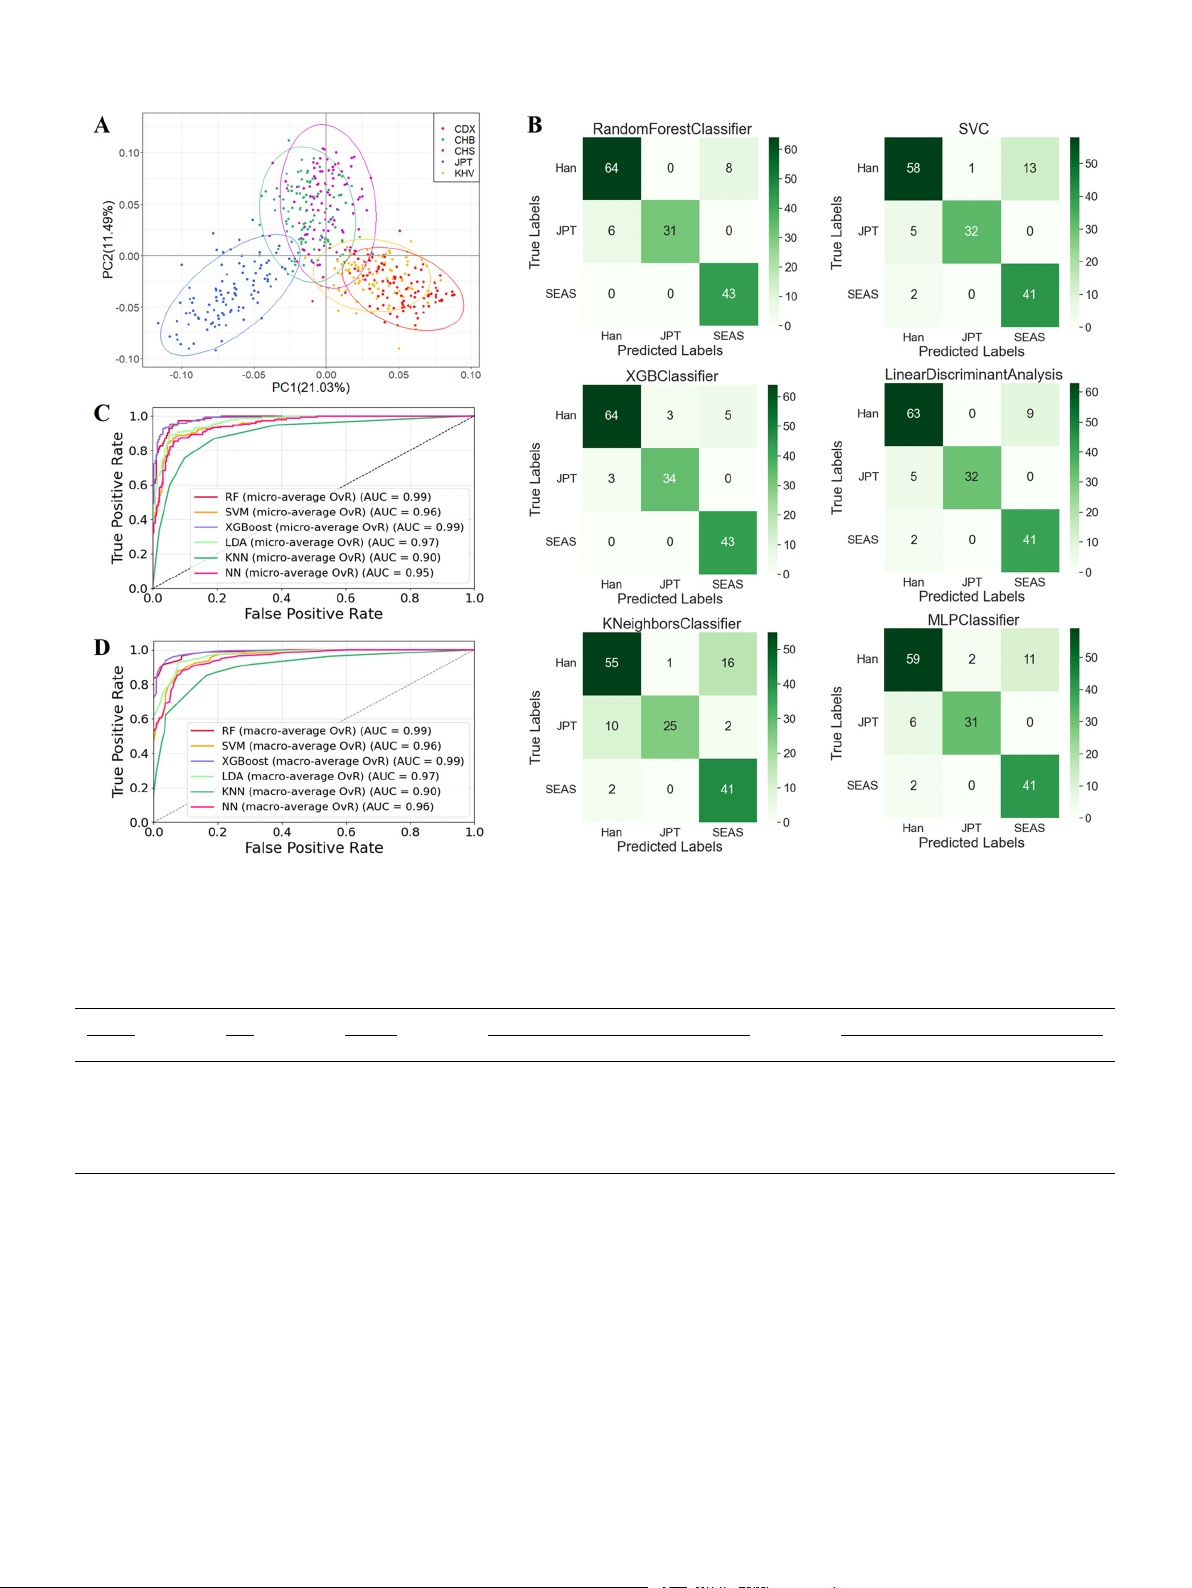
In addition, we also performed individual-level PCA analysis based
level, AFR with other intercontinental populations (AMR, EAS, EUR,
on the genotyping data of the 34 AISNPs selected from 504 individuals
SAS) had 14, 16, 14, and 10 loci with δ > 0.3; EAS with other pop-
of EAS populations in the 1000 Genomes Project (Fig. 4A). The 504
ulations (AMR, EUR, SAS) had 11, 14, and 10 loci with δ > 0.3; EUR with
individuals were categorized according to the geographical origins
other populations (AMR, SAS) had five and eight loci with δ > 0.3,
represented by different colors. And red, green, purple, blue and yellow
respectively. And there were four loci with δSAS/AMR>0.3. Among the 34
dots respectively represented the individuals from CDX, CHB, CHS, JPT
East Asian-specific loci, the FST and In statistics of the five East Asian
and KHV populations, respectively, and EAS was categorized into three
populations were 0.0472–0.3388, and 0.0235–0.1624, respectively. The
clusters, i.e., SEAS (CDX, KHV), Han Chinese (CHS, CHB), and JPT. The
31 East Asian-specific loci have not been reported. At the East Asian
Han individuals were between the JPT and SEAS. The 504 individuals
level, the δCHB/KHV, δCHB/CDX, and δCHS/CDX values of rs434124 reached
originating from EAS were divided into three subgroups (SEAS, Han,
more than 0.4, and δJPT/CDX and δKHV/JPT values of rs11629323 were all
JPT), and EAS ancestry inference models were constructed based on RF,
greater than 0.5. The loci with the highest δKHV/CHS, δJPT/CHS, and
SVM, XGBoost, LDA, KNN and NN classifiers. The results of the best
δCHB/JPT values were rs149768401, rs543086096, and rs2920295,
parameters of these six models were shown in Supplementary Table 6. respectively.
The performances of the six models were displayed in Table 2 and
In order to visualize the distribution characteristics of the genotyping
Fig. 4B-D (Confusion Matrix and ROC curves). The XGBoost model was
data of 58 AISNP loci in the 26 population (Supplementary Table 5), we
the best ancestor inference efficacy with MCC value of 0.89, and the
used the t-SNE method to downscale the high-dimensional data to two
highest AUC-ROC values and f1 scores in all three subgroups. The
dimensions, and then illustrated it in a two-dimensional coordinate
XGBoost and RF models were the 92% prediction accuracy in EAS. In
system (Fig. 2C). The AFR, EAS, SAS and EUR were separated from each
Figs. 4C and D, the XGBoost and RF models had the highest and same
other with obvious gaps, whereas some AMR individuals overlapped
AUC-ROC values (0.99) among six models.
with the EUR and SAS. In addition, it could also be found from the figure
that the EAS was divided into three clusters, namely, Japan, Han Chi-
3.4. ADMIXTURE analysis based on selected 58 AISNP loci
nese and SEAS clusters from top to bottom at the t-SNE2 level.
Population genetic structure analysis can identify the components of
3.3. Machine learning model construction, testing and evaluation
subgroups within a population, the degree of genetic exchange between
populations, and can also reveal human origin, migration, evolutionary
In order to investigate whether the selected AISNP molecular genetic
history and background. ADMIXTURE analysis was performed based on
markers have sufficient large differences in genetic differentiations
the genotyping data of selected 58 AISNP loci on 26 reference pop-
among the target populations under study, PCA was used, and the
ulations in this study (Fig. 5). The genetic structures and cross-validation 5 M. Cai et
Forensic Science International al. 357 (2024) 111975
Fig. 3. PCA analysis for the continental level, results of the six model predictions, and efficacy assessments. (A) PCA analysis based on the raw genotyping data from
2504 individuals at 24 AISNP loci. (B) Confusion matrix results of the six prediction models. (C) Micro-averaging ROC curves of the six prediction models. (D) Macro-
averaging ROC curves of the six prediction models. Table 1
Performance of the six optimal models using 24 continental-specific AISNPs. The results were measured in terms of AUC-ROC, MCC, accuracy and f1 score. Method MCC Accuracy AUC-ROC f1 score AFR AMR EAS EUR SAS AFR AMR EAS EUR SAS RF 0.94 0.94 1.00 0.97 1.00 0.99 1.00 0.98 0.83 1.00 0.95 0.96 SVM 0.91 0.92 1.00 0.96 1.00 0.99 0.99 0.99 0.74 0.99 0.90 0.92 XGBoost 0.94 0.94 1.00 0.98 1.00 1.00 1.00 0.99 0.83 1.00 0.93 0.95 LDA 0.90 0.91 1.00 0.96 1.00 0.99 0.99 0.99 0.72 0.98 0.90 0.92 KNN 0.86 0.88 0.99 0.82 1.00 0.97 0.98 0.98 0.53 0.97 0.84 0.91 NN 0.90 0.92 1.00 0.96 1.00 0.99 0.99 0.98 0.68 0.98 0.91 0.91
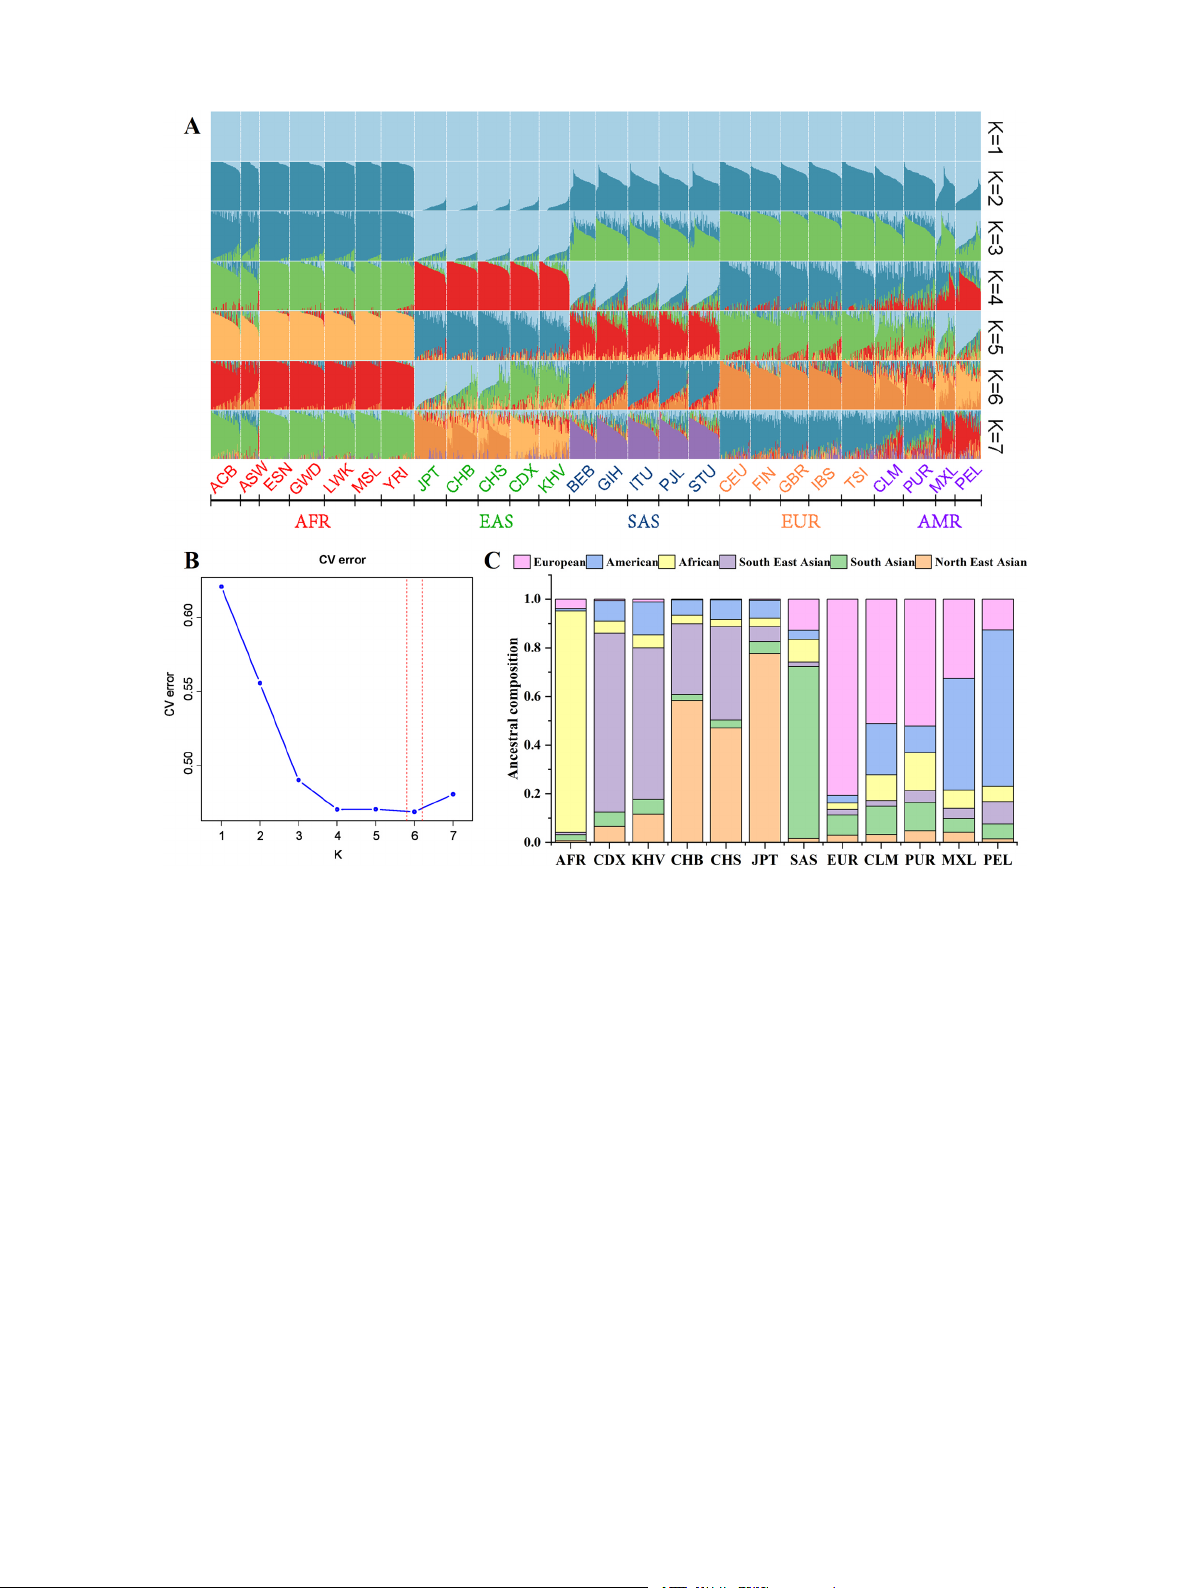
errors of the 26 reference populations were analyzed using ADMIXTURE
North EAS, South EAS and AMR. And JPT, CHB and CHS displayed
software. Fig. 5A showed the results of the population structure analyses
predominantly North EAS ancestral component (light blue), while CDX
when the number of ancestors was K=1–7. Each individual was repre-
and KHV showed strong South EAS ancestral component (green).
sented by a vertical line that was divided into K color segments, the
Cross-validation error for each K value estimated by the ADMIX-
length of which was related to the proportions of ancestral components
TURE software could be used to determine the optimal K value, and the
of the tested sample. At K=3, the EAS, AFR populations were distin-
results were shown in Fig. 5B. The results of the cross-validation errors
guished from the other intercontinental populations, and then the
suggested that the optimal K value was six (cross-validation
populations from SAS were further separated at K = 4. When K=5, the
error=0.4686), i.e., when six kinds of ancestral components were
MXL and PEL from AMR cannot be distinguished from each other and
assumed for 26 populations, it could maximize the explanation of
can be considered as a clustering group, and showed light blue domi-
structural differences among populations. We visualized the proportions
nated ancestral component, while the other two American populations,
of ancestral components of the EAS and AMR subgroups at the optimal K
CLM and PUR, exhibited the strong mixture of ancestral components,
= 6 as a stacked plot (Fig. 5C). It can be observed that JPT predomi-
with larger proportion of European ancestral component. At K = 6, all
nantly accounted for the North EAS ancestral component of 0.7755, and
the individuals were assigned to six ancestral clusters: AFR, SAS, EUR,
CDX and KHV accounted for the South EAS ancestral components of 6 M. Cai et
Forensic Science International al. 357 (2024) 111975
Fig. 4. PCA analysis for the East Asian level, the results of six model predictions, and the efficacy assessment results. (A) PCA analysis based on the raw genotyping
data of 34 AISNP loci at 504 individuals of EAS populations. (B) Confusion matrix results of the six prediction models. (C) Micro-averaging ROC curves of the six
prediction models. (D) Macro-averaging ROC curves of the six prediction models. Table 2
Performance of the six optimal models using 34 East Asian-specific AISNPs. The results were measured in terms of AUC-ROC, MCC, accuracy and f1 score. Method MCC Accuracy AUC-ROC f1 score Han JPT SEAS Han JPT SEAS RF 0.86 0.92 0.97 1.00 0.99 0.90 0.91 0.91 SVM 0.79 0.87 0.93 0.98 0.97 0.85 0.91 0.85 XGBoost 0.89 0.92 0.97 0.99 0.99 0.92 0.92 0.95 LDA 0.84 0.86 0.95 0.99 0.97 0.89 0.93 0.88 KNN 0.69 0.80 0.85 0.92 0.94 0.79 0.79 0.80 NN 0.79 0.85 0.92 0.97 0.96 0.85 0.89 0.86
0.7345 and 0.6223, respectively. Whereas the CHB and CHS groups
efficacy and select the optimal combination of a small set of AIMs to
accounted for the North EAS ancestral components of 0.5836 and
develop a biogeographic ancestral information inference system with
0.4703, and the South EAS ancestral components of 0.2912 and 0.3840,
higher inference accuracy and practicality is of great value in the
respectively. MXL and PEL groups mainly accounted for the AMR
application of forensic ancestry inference. In this study, we obtained a
ancestry components of 0.4578 and 0.6415, while CLM and PUR mainly
small set of AISNP loci through genome-wide screening of AIMs, liter-
accounted for the EUR ancestry components of 0.5114 and 0.5209,
ature search and feature selection, and this combination of 58 AISNP loci
respectively. ADMIXTURE results further confirmed that the selected 58
was not only capable of distinguishing intercontinental populations, but
AISNP loci had better efficacy in distinguishing the five continental
also had good efficacy in discriminating East Asian populations. Based
origin populations, and also better distinguished these EAS populations.
on the dimensionality reduction analyses, it can be seen that 1750
AISNP loci selected on basis of the selection loci tool and literature 4. Discussion
search could distinguish the five continental populations, some of these
loci can also be found to distinguish the East Asian populations, namely
How to screen those genetic markers with high ancestry inference
JPT, SEAS, Han Chinese using the t-SNE analysis. Compared with MDS, 7 M. Cai et
Forensic Science International al. 357 (2024) 111975
Fig. 5. Population genetic structure analysis based on 26 reference population data. (A) 26 reference population structures with K = 2–7 based on 58 AISNP loci via
ADMIXTURE analysis. (B) Cross validation error obtained based on the result of the ADMIXTURE analysis. (C) Stacked plot of the proportions of population ancestry
components at the optimal K value of 6. CDX, Chinese Dai in Xishuangbanna; JPT, Japanese in Tokyo; KHV, Kinh in Ho Chi Minh City; CHB, Chinese Beijing Han;
CHS, Chinese Southern Han; ACB, African Caribbean in Barbados; ASW, African Ancestry in Southwest USA; MSL, Mende in Sierra Leone; ESN, Esan in Nigeria; YRI,
Yoruba in Ibadan; GWD, Gambian in Western Division; LWK, Luhya in Webuye, Kenya; FIN, Finnish in Finland; CEU, Utah residents with Northern and Western
European ancestry; GBR, British in England and Scotland; IBS, Iberian populations in Spain; TSI, Toscani in Italy; ITU, Indian Telugu in the UK; PJL, Punjabi in
Lahore; STU, Sri Lankan Tamil in the UK; BEB, Bengali in Bangladesh; GIH, Gujarati Indian in Houston; CLM, Colombian in Medellin; PUR, Puerto Rican in Puerto
Rico; MXL, Mexican Ancestry in Los Angeles; PEL, Peruvian in Lima. AFR, African populations; SAS, South Asian populations; EUR, European populations; EAS, East
Asian populations; AMR, American populations.
PCA and UAMP methods, t-SNE is more suitable for discovering local
populations, including Han, Japan and SEAS. The method of screening
structures and clustering[7,20]. In order to remove redundant loci to
loci in this study is simple and easy to implement, which fully utilizes the
obtain a small set of AISNPs with high performances, the embedded
advantages of machine learning. On the other hand, this study chose the
feature selection was performed based on the RF model using the
commonly used RF classic algorithm in the field of machine learning as
one-vs-rest classification strategy. We obtained a combination of 58
the classifier and achieved good results in ancestry inference for East
AISNP loci, which can not only be used for ancestry inference of inter- Asian populations.
continental populations, but also have important value in fine differ-
Choosing a suitable classification algorithm to construct a biogeo-
entiations of East Asian populations.
graphic ancestral information inference model can significantly improve
According to the results of the ADMIXTURE analysis, this new
the recognition accuracy. RF has high accuracy and robustness, can
combination obtained an optimal K value of six, i.e., it was able to divide
handle a large number of features and samples, and evaluate the
the 26 populations from 1000 Genomes Project into six kinds of ances-
importance of features. SVM is effective in high dimensional space, can
tral components, thus distinguishing the East Asian and American sub-
deal with nonlinear differentiable problems, and has strong general-
groups. Among 58 AISNP loci, 24 AISNPs were finally screened to be
ization ability. XGBoost has high accuracy and robustness, can deal with
used for continental ancestry inference, while 34 AISNPs were used for
large-scale data, and can automatically deal with missing values. LDA is
ancestry inference within the East Asian populations. Based on geno-
simple and easy to explain, can deal with multi-categorization problems,
typing data of 26 populations in five continents from 1000 Genomes
and can reduce the dimensionality. KNN is simple and easy to imple-
Project, the results of PCA analyses demonstrated that 24 AISNPs could
ment, and is suitable for multi-category problems. NN can learn complex
distinguish AFR, EAS, EUR and SAS, but were less effective for AMR. The
nonlinear relationships, is suitable for large-scale data, and has strong
34 AISNPs were able to better differentiate between East Asian
expressive power. In this study, we combined 24 AISNPs and 34 AISNPs 8 M. Cai et
Forensic Science International al. 357 (2024) 111975
with six classification algorithms to construct classification models and
Appendix A. Supporting information
analyzed the discriminative ability of these two combinations of AISNPs
for intercontinental and intra-East Asian populations, respectively. The
Supplementary data associated with this article can be found in the
results showed that compared with other models, XGBoost and RF
online version at doi:10.1016/j.forsciint.2024.111975.
models have the high efficacy. The XGBoost and RF models achieved
94%, and 92% prediction accuracy in intercontinental, and intra-East References
Asian populations, respectively. The XGBoost and RF models may be
more suitable for biogeographic ancestry information inference based
[1] X.Y. Jin, Y.X. Guo, C. Chen, W. Cui, Y.F. Liu, Y.C. Tai, B.F. Zhu, Ancestry prediction
on SNP genotypes than other models.
comparisons of different AISNPs for five continental populations and population
structure dissection of the xinjiang hui group via a self-developed panel, Genes 11
Compared with the previous studies which distinguished continental (2020) 505.
populations[4,21], this present study used fewer AIMs (24 AISNPs) and
[2] T. Frudakis, K. Venkateswarlu, M.J. Thomas, Z. Gaskin, S. Ginjupalli, S. Gunturi,
was better able to distinguish the four continents (except AMR).
V. Ponnuswamy, S. Natarajan, P.K. Nachimuthu, A classifier for the SNP-based
inference of ancestry, J. Forensic Sci. 48 (2003) 771–782.
Compared to the same study on population substructures within a
[3] C. Phillips, A. Salas, J.J. S´anchez, M. Fondevila, A. G´omez-Tato, J. Alvarez-Dios,
continental subregion (East Asia)[12–14], the AIMs (34 AISNPs) used in
M. Calaza, M.C. de Cal, D. Ballard, M.V. Lareu, A. Carracedo, Inferring ancestral
this study were categorize East Asia into three major clusters, namely
origin using a single multiplex assay of ancestry-informative marker SNPs, Forensic Sci. Int. Genet. 1 (2007) 273
JPT, SEAS, Han Chinese, thus better differentiating the intra-East Asian –280.
[4] Y.L. Wei, L. Wei, L. Zhao, Q.F. Sun, L. Jiang, T. Zhang, H.B. Liu, J.G. Chen, J. Ye,
populations. Although the model we constructed based on the screened
L. Hu, C.X. Li, A single-tube 27-plex SNP assay for estimating individual ancestry
AISNPs could predict the biogeographic ancestries of the 26 populations
and admixture from three continents, Int. J. Leg. Med. 130 (2016) 27–37.
with relative accuracy, the actual genetic structures of populations in
[5] K.K. Kidd, W.C. Speed, A.J. Pakstis, M.R. Furtado, R. Fang, A. Madbouly,
M. Maiers, M. Middha, F.R. Friedlaender, J.R. Kidd, Progress toward an efficient
different regions are actually very complex due to historical migrations,
panel of SNPs for ancestry inference, Forensic Sci. Int. Genet. 10 (2014) 23–32.
population interactions and genetic drift. Therefore, it is necessary to
[6] A.J. Pakstis, L. Kang, L. Liu, Z. Zhang, T. Jin, E.L. Grigorenko, F.R. Wendt,
utilize real samples from different regions and ethnic origins to study the
B. Budowle, S. Hadi, M.S. Al Qahtani, N. Morling, H.S. Mogensen, G.E. Themudo,
U. Soundararajan, H. Rajeevan, J.R. Kidd, K.K. Kidd, Increasing the reference
differences in genetic structures among populations. In the future, we
populations for the 55 AISNP panel: the need and benefits, Int. J. Leg. Med. 131
will construct a multiple amplification system on the basis of the (2017) 913–917.
screened AISNPs, and utilize the real samples for further validation, so as
[7] E. Pilli, S. Morelli, B. Poggiali, E. Alladio, Biogeographical ancestry, variable
selection, and PLS-DA method: a new panel to assess ancestry in forensic samples
to make it of practical application value.
via MPS technology, forensic science international, Genetics 62 (2023) 102806.
In summary, this study identified the optimal AISNP combinations
[8] S. Zhao, C.M. Shi, L. Ma, Q. Liu, Y. Liu, F. Wu, L. Chi, H. Chen, AIM-SNPtag: a
and corresponding classification algorithms for identifying the five
computationally efficient approach for developing ancestry-informative SNP
panels, Forensic science international, Genetics 38 (2019) 245–253.
continental and intra-East Asian populations by analyzing the geno-
[9] A. Auton, L.D. Brooks, R.M. Durbin, E.P. Garrison, H.M. Kang, J.O. Korbel, J.
typing data of 1750 AISNP loci in 2504 individuals. We believed that our
L. Marchini, S. McCarthy, G.A. McVean, G.R. Abecasis, A global reference for
results could be beneficial for forensic biogeographical traceability of
human genetic variation, Nature 526 (2015) 68–74.
[10] R. Kosoy, R. Nassir, C. Tian, P.A. White, L.M. Butler, G. Silva, R. Kittles, M.
individual source of on-site biomaterial and related population genetic
E. Alarcon-Riquelme, P.K. Gregersen, J.W. Belmont, F.M. De La Vega, M.F. Seldin,
research. In this study, we pioneered a set of 34 AISNP loci which could
Ancestry informative marker sets for determining continental origin and admixture
perform the genetic differentiations of the East Asian populations with
proportions in common populations in America, Hum. Mutat. 30 (2009) 69–78.
high distinguishing effectiveness and efficiency balance. This combina-
[11] G. He, J. Liu, M. Wang, X. Zou, T. Ming, S. Zhu, H.Y. Yeh, C. Wang, Z. Wang,
Y. Hou, Massively parallel sequencing of 165 ancestry-informative SNPs and
tion would contribute to the development of subgroup ancestry infer-
forensic biogeographical ancestry inference in three southern Chinese Sinitic/Tai-
ence system in East Asia and further enhance the recognition ability of
Kadai populations, forensic science international, Genetics 52 (2021) 102475.
internal differentiations of the East Asian populations.
[12] S. Qu, J. Zhu, Y. Wang, L. Yin, M. Lv, L. Wang, H. Jian, Y. Tan, R. Zhang, Y. Liu,
F. Li, S. Huang, W. Liang, L. Zhang, Establishing a second-tier panel of 18 ancestry
informative markers to improve ancestry distinctions among asian populations,
CRediT authorship contribution statement
Forensic Sci. Int. Genet. 41 (2019) 159–167.
[13] X.Y. Jin, Y.Y. Wei, Q. Lan, W. Cui, C. Chen, Y.X. Guo, Y.T. Fang, B.F. Zhu, A set of
novel SNP loci for differentiating continental populations and three Chinese
Bofeng Zhu: Writing – review & editing, Writing – original draft.
populations, PeerJ 7 (2019) e6508.
Meiming Cai: Writing – review & editing, Writing – original draft,
[14] C.X. Li, A.J. Pakstis, L. Jiang, Y.L. Wei, Q.F. Sun, H. Wu, O. Bulbul, P. Wang, L.
Visualization. Fanzhang Lei: Writing
L. Kang, J.R. Kidd, K.K. Kidd, A panel of 74 AISNPs: improved ancestry inference
– review & editing. Xiaolian Wu:
within Eastern Asia, Forensic Sci. Int. Genet. 23 (2016) 101–110.
Writing – review & editing. Chen Mao: Writing – review & editing.
[15] O. Bulbul, W.C. Speed, C. Gurkan, U. Soundararajan, H. Rajeevan, A.J. Pakstis, K.
Meisen Shi: Writing – review & editing. Man Chen: Writing – review &
K. Kidd, Improving ancestry distinctions among Southwest asian populations,
editing. Qiong Lan: Writing
Forensic Sci. Int. Genet. 35 (2018) 14 – review –20. & editing.
[16] H.L. Hwa, C.P. Lin, T.Y. Huang, P.H. Kuo, W.H. Hsieh, C.Y. Lin, H.I. Yin, L.
H. Tseng, J.C. Lee, A panel of 130 autosomal single-nucleotide polymorphisms for
Declaration of Competing Interest
ancestry assignment in five asian populations and in caucasians, Forensic Sci. Med. Pathol. 13 (2017) 177–187.
The authors declare that they have no known competing financial
[17] C.M. Nievergelt, A.X. Maihofer, T. Shekhtman, O. Libiger, X. Wang, K.K. Kidd, J.
R. Kidd, Inference of human continental origin and admixture proportions using a
interests or personal relationships that could have appeared to influence
highly discriminative ancestry informative 41-SNP panel, Invest. Genet. 4 (2013)
the work reported in this paper. 13.
[18] C. Phillips, A. Freire Aradas, A.K. Kriegel, M. Fondevila, O. Bulbul, C. Santos,
F. Serrulla Rech, M.D. Perez Carceles, ´A. Carracedo, P.M. Schneider, M.V. Lareu, Acknowledgements
Eurasiaplex: a forensic SNP assay for differentiating European and South Asian
ancestries, Forensic Sci. Int. Genet. 7 (2013) 359–366.
This work was supported by grants from the Qian duansheng
[19] Y. Yang, An evaluation of statistical approaches to text categorization, Inf. Retr. 1 (1999) 69–90.
Distinguished Scholars Program of China University of the Political
[20] E. Alladio, B. Poggiali, G. Cosenza, E. Pilli, Multivariate statistical approach and
Science and Law (No: 01140065140); Cross disciplinary construction
machine learning for the evaluation of biogeographical ancestry inference in the
project of evidence investigation (No: 10322308); National Key R
forensic field, Sci. Rep. 12 (2022) 8974. &D
[21] X.Y. Jin, W. Cui, C. Chen, Y.X. Guo, Y.W. Tao, Q. Lan, T.T. Kong, B.F. Zhu,
Program of China (2022YFC3302004, 2022YFC3302004–1).
Biogeographic origin prediction of three continental populations through 42
ancestry informative SNPs, Electrophoresis 41 (2020) 235–245. 9
Document Outline
- Systematic analyses of AISNPs screening and classification algorithms based on genome-wide data for forensic biogeographic ...
- 1 Introduction
- 2 Materials and methods
- 2.1 Sample set sources
- 2.2 Preliminary selection of AISNP loci
- 2.3 Dimensionality reduction analysis and visualization
- 2.4 Feature selection
- 2.5 Modeling biogeographical ancestry inference, model testing and efficacy evaluation
- 3 Results
- 3.1 Dimensionality reduction analyses for 1750 candidate AISNP loci
- 3.2 Embedded feature selection based on random forest algorithm via multi-classification and one-vs-rest classification str ...
- 3.3 Machine learning model construction, testing and evaluation
- 3.4 ADMIXTURE analysis based on selected 58 AISNP loci
- 4 Discussion
- CRediT authorship contribution statement
- Declaration of Competing Interest
- Acknowledgements
- Appendix A Supporting information
- References
Tài liệu liên quan:
-
Báo cáo kỹ thuật Đề tài: dự đoán nguồn gốc tổ tiên địa lý-sinh học (bga) sử dụng dữ liệu dna - Học phần Nhập môn học máy và khai phá dữ liệu | Đại học Bách Khoa Hà Nội
40 20 -

Dự đoán nguồn gốc tổ tiên Địa lý-Sinh học (bga) sử dụng dữ liệu dna môn Nhập môn học máy và khai phá dữ liệu | Đại học Bách Khoa Hà Nội
36 18 -
California eda visualization - Bài tập môn Nhập môn học máy và khai phá dữ liệu | Đại học Bách Khoa Hà Nội
36 18 -
Tài liệu hướng dẫn thực hiện đồ án môn Khai phá dữ liệu | Đại học Bách Khoa Hà Nội
47 24