Biochemistry Lab Manual for Practical Experiments (Sept 2023) | Môn Biochemistry - Trường Đại học Quốc tế, Đại học Quốc gia Thành phố Hồ Chí Minh
Biochemistry Lab Manual for Practical Experiments (Sept 2023) Môn Biochemistry. Tài liệu được sưu tầm gồm 25 trang, giúp bạn ôn tập tốt hơn. Mời các bạn đón xem.
Môn: Biochemistry (BT005) 10 tài liệu
Trường: Trường Đại học Quốc tế, Đại học Quốc gia Thành phố Hồ Chí Minh 2 K tài liệu
Tác giả:


Preview text:
lOMoAR cPSD| 59085392 BIOCHEMISTRY LAB MANUAL Giảng viên phụ trách Trưởng bộ môn Ban chủ nhiệm Khoa Nguyễn Hồng Lan
School of Biotechnology
International University – VNU-HCMC Content PART I. PRACTICAL EXPERIMENTS EXPERIMENT 1:
Quantitative determination of protein concentration by Lowry assay EXPERIMENT 2:
Investigation of enzymatic activity of bromelain lOMoAR cPSD| 59085392 EXPERIMENT 3:
Soluble carbohydrate quantification applying Anthrone assay EXPERIMENT 4:
Quantitative determination of calcium in powdered milk PART II: REVIEW QUESTIONS
PART III: MAKING SOLUTION IN BIOCHEMISTRY LAB PART PART
IV: SAFETY REGULATIONS IN LABORATORY EXPERIMENT 1
Quantitative determination of protein concentration by Lowry assay 1. Principle
Accurate protein quantification is critical in biochemical research, and there are various assays available.
However, each assay has limitations due to differences in amino acid content, experimental conditions,
experimenter experience, and the protein of interest and its quantity. Therefore, selecting the appropriate
assay is crucial to achieve the best outcome with acceptable error. To make the right choice, factors such
as sensitivity, accuracy, interfering substances, and available time should be carefully considered.
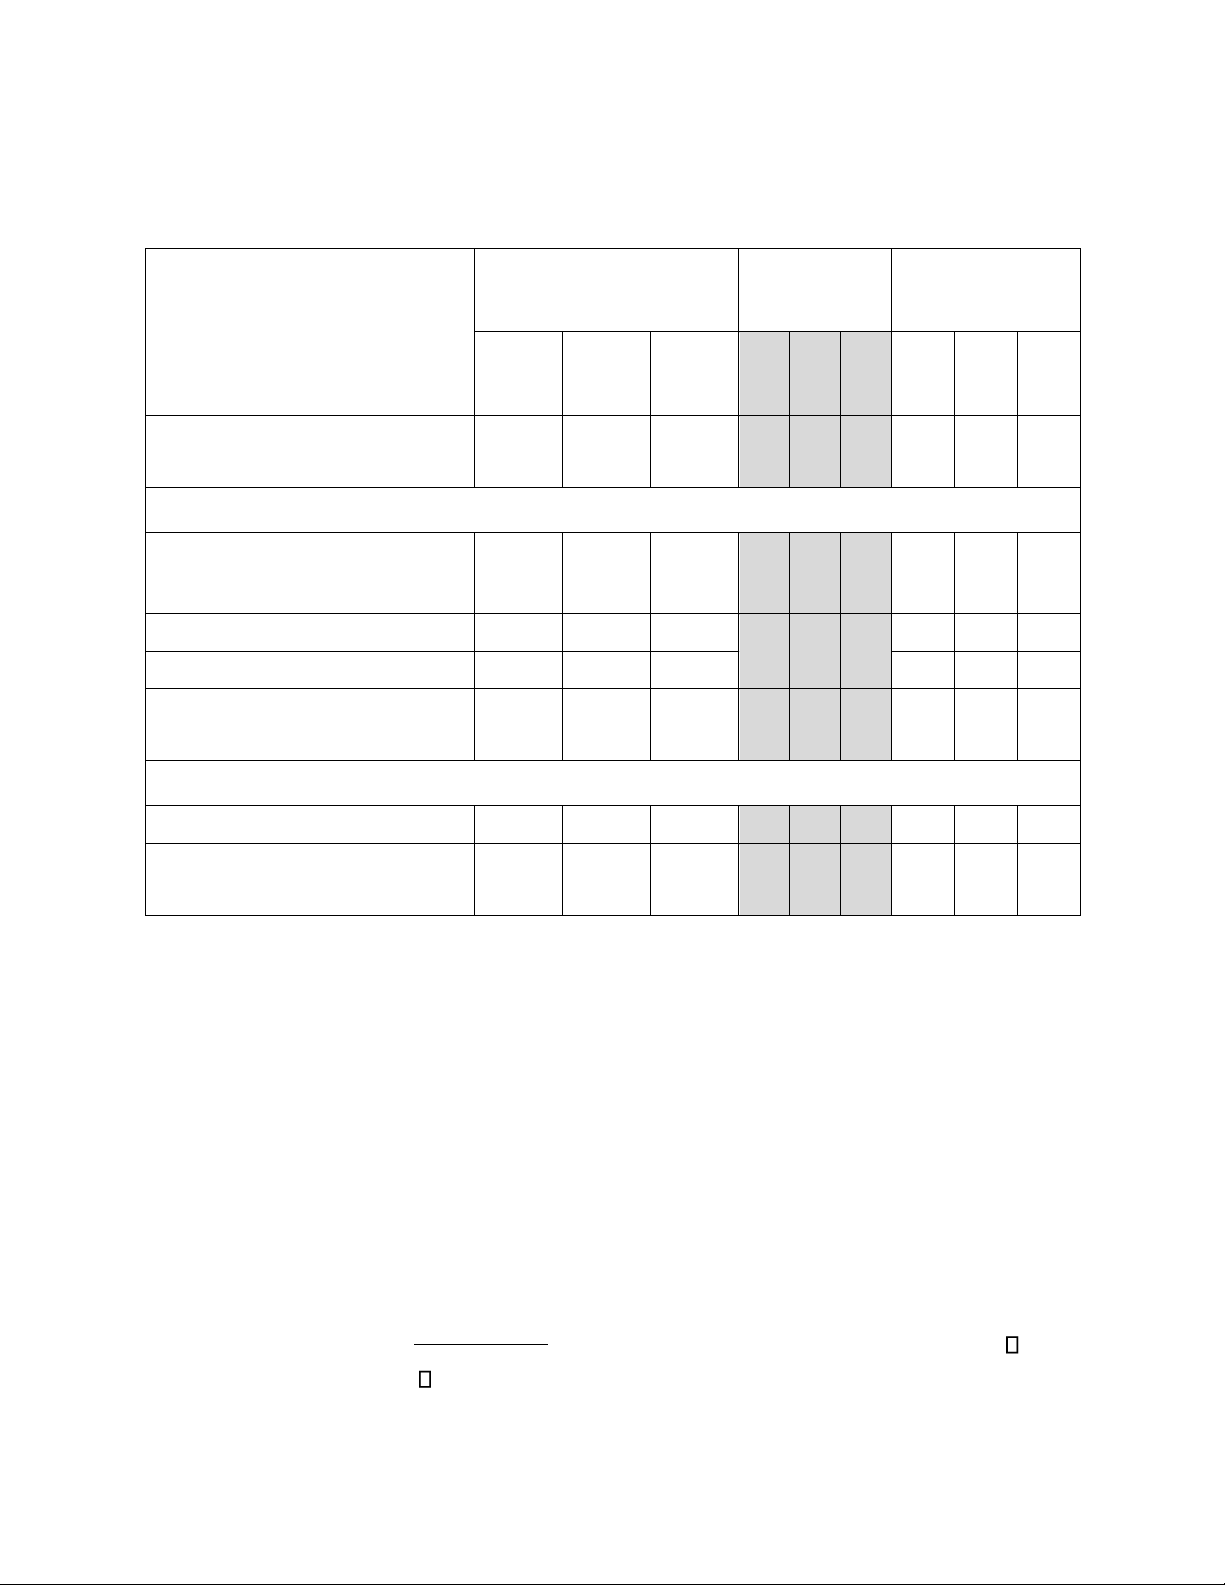
Here is a table highlighting some widely used protein quantification assays Assay Sensitivity Mechanism
Advantage Disadvantage lOMoAR cPSD| 59085392
Measures protein content based on Moderately
the ability of the protein to bind to sensitive,
the dye Coomassie Brilliant Blue G-
250. The dye undergoes a shift in Can be affected by the
absorption spectrum when it binds easy and fast to presence of detergents,
to protein, and the resulting change run reducing agents, and some in absorbance is measured. buffer components. The dye can also bind to non- protein substances, leading to overestimation of protein content Bradford 150-750 µg/mL Good sensitivity Laborious. Detergent and chelating agent can
Measures protein content based on interfere.
the ability of protein to form a
complex with copper ions in an Hartree
alkaline solution. The complex absorbs light at a specific -
wavelength, and the absorbance is Lowry 30-150 µg/mL measured.
Measures total protein content by
determining nitrogen content in the
sample. Proteins are digested with Sensitive, fast
sulfuric acid and heated with a Time-consuming and and non-
catalyst to convert nitrogen to involves the use of destructive to
ammonium sulfate. The amount of hazardous chemicals sample
nitrogen is then determined by such as concentrated
titration or spectrophotometry. sulfuric acid and strong bases. The results can be affected by the presence of non-protein nitrogen compounds. Kjeldahl 5-25 µg/mL
The purified source of the protein to be quantified should be chosen as the standard one to reduce result’s
errors. In case of the proteins of interest whose sources have not been isolated, purified or commercially
sold, the other proteins having similar structures or coming from the same family protein should be
chosen as alternatives, instead to obtain a high similar color yield.
In this experiment, the Hartree-Lowry assay is employed for protein quantification, and a calibration
curve is constructed using a standard protein of known concentration. The Folin-Ciocalteu reagent is
added to protein solutions to produce a color that is measured colorimetrically. Albumin solution is used lOMoAR cPSD| 59085392
as an appropriate standard, and various concentrations are mixed with the reagent to enhance color
development. The intensely blue color development is attributed to two reactions:
+ The coordination of peptide bonds with alkaline copper (biuret assay)
+ The reduction of the Folin-Ciocalteu reagent by tyrosine and tryptophan residues in protein.
2. Equipment and chemicals 2.1 Equipment + Test tubes
+ Pipettes (1mL, 2mL, and 5mL) and pumps
+ Volumetric flasks (50mL, 100mL) + Beakers (50mL, 100mL) + Graduated cylinder (50mL) + Falcons (50mL) + Filter paper (11mm) + Spectrophotometer + Centrifuges 2.2 Chemicals
+ Albumin solution 0.1%: Dissolve 0.1 g of albumin in water to make 100mL of solution.
+ Solution A: Dissolve 2 g of Na2CO3 in NaOH 0.1 N to make 100ml.
+ Solution B: Dissolve 0.5 g CuSO4.5H2O in sodium citrate 1% to make 100ml
+ Solution C: Mixture of A and B at a ratio of 49:1. Solution C is prepared by pipetting 1.0 mL of solution
B and transferring it to a 50 mL volumetric flask. Solution A is then added to the 50 mL level.
This solution can only be used within 1 day. + Folin-Ciocalteu reagent
3. Practical procedures
3.1 Sample preparation: Take an exact amount of 5g pulverized soybeans and put it into a stone mortar. 3.2 Extraction
+ 1st time: Take approximately 40mL of distilled water and add a small amount of it to the stone mortar.
Grind the sample, and then pour the remaining water into the mortar, being careful as you continue to
grind. Once done, transfer the resulting extract solution to a beaker, while leaving the soybean grounds in the mortar.
+ 2nd time: Do the same as the 1st time with about 30 mL of distilled water.
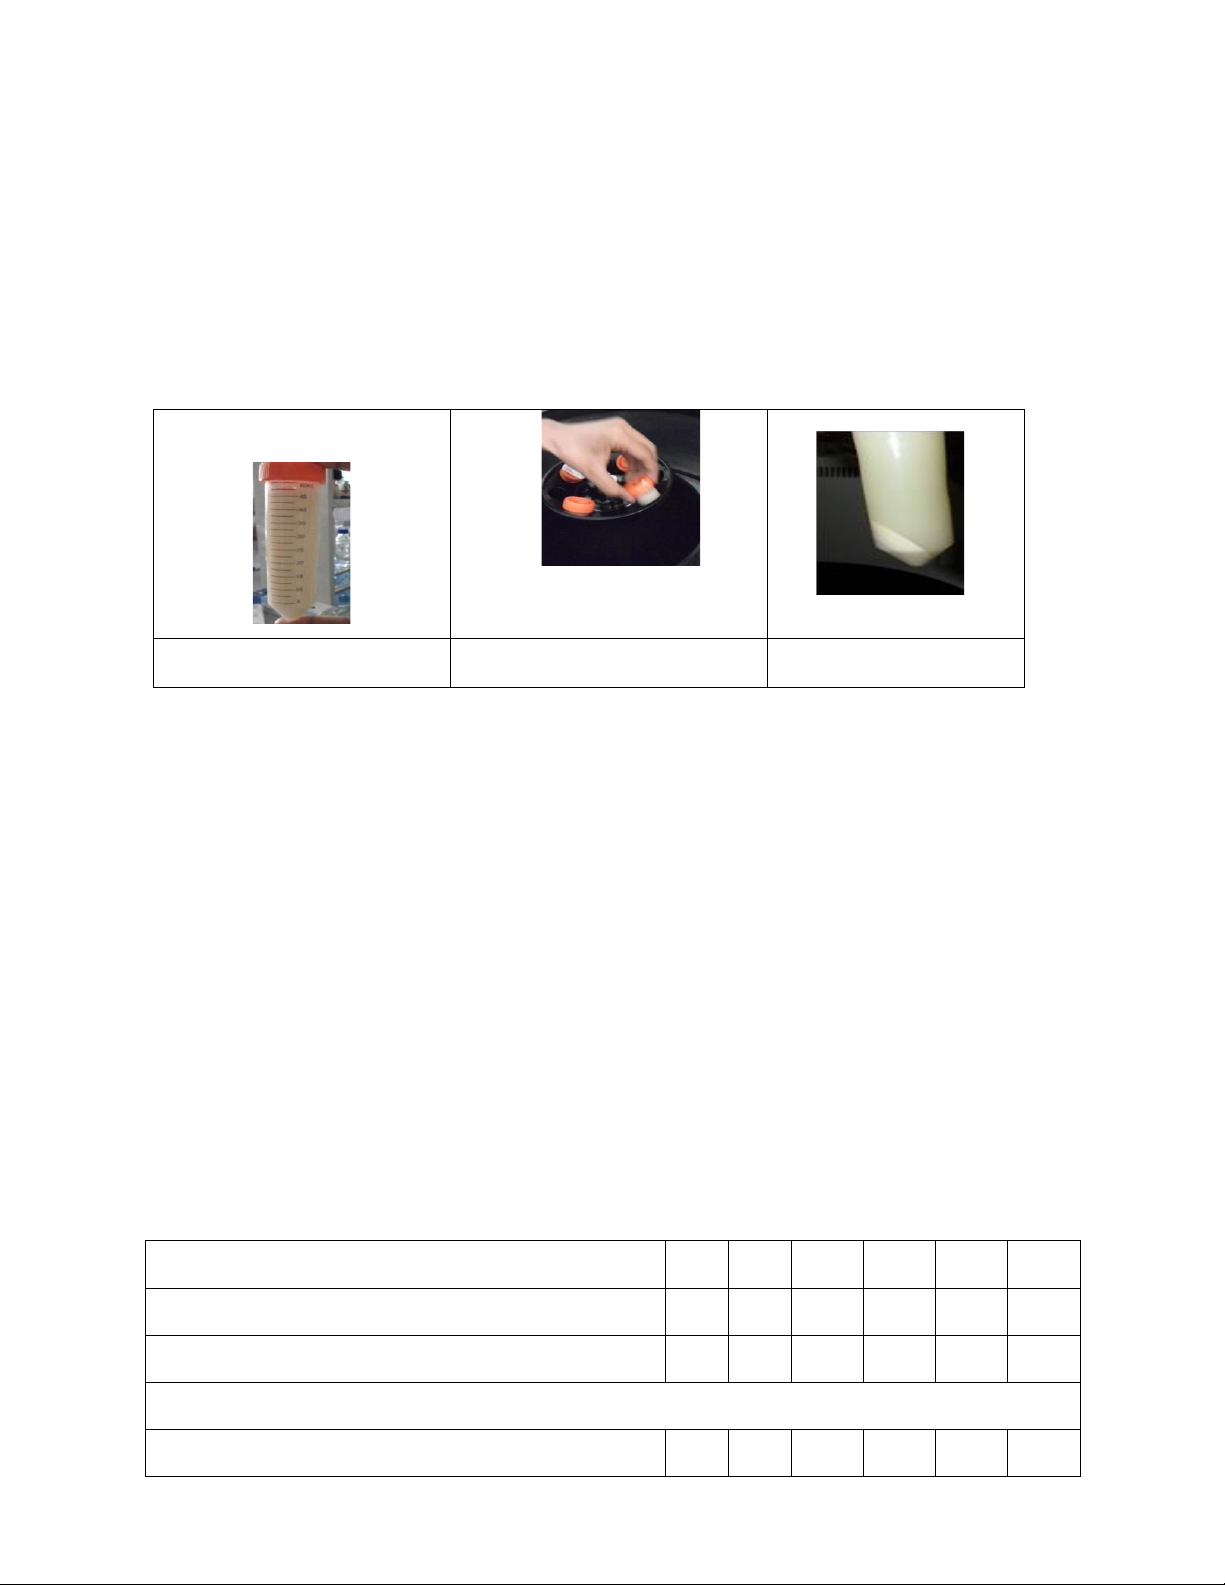
+ 3rd time: Do the same as the 1st time with about 30 mL of distilled water. lOMoAR cPSD| 59085392 3.3 Centrifugation
Transfer all the extracted solution into centrifuge tubes. If necessary, use extra centrifuge tubes to balance
the centrifuge. Centrifuge the tubes at a speed of 5000 rs/m for 10 minutes. After centrifugation, remove
any film (fats) that has formed on the surface of the solution. Carefully decant the clear liquid
(supernatant) into a clean 100 mL beaker. This extracted protein solution will be used to determine the
concentration of soluble proteins in the soybean using the Lowry assay. Before centrifuging Centrifuge After centrifuging
Figure 1. Centrifugation 3.4 Dilution
Pipette 1mL of the extracted protein solution into a 100mL volumetric flask.
Fill the flask to the 100mL mark with distilled water. This dilutes the extracted protein from 5g of soybean by 100 times.
To make a 10,000-diluted solution, dissolve 1mL of the 100-diluted solution in 99mL of distilled water.
3.5 Preparation of standard solutions
Six standard albumin solutions with concentrations of 0, 50, 100, 150, 200, and 250 μg/mL were used in
this study. The standard solutions were prepared by diluting the 0.1% albumin solution to the desired
concentration in each of the six test tubes, which were labeled from 1 to 6. The required volumes of stock
albumin solution and purified water are listed in Table 1.
Table 1: Standard solutions of albumin Tube Number 1 2 3 4 5 6
0.1% Albumin solution (mL) 0 0.5 1.0 1.5 2.0 2.5 Distilled water (mL) 10 9.5 9.0 8.5 8.0 7.5
Step 2.3 Shake the tube well
The concentration of each tube (μg/mL) 0 50 100 150 200 250 lOMoAR cPSD| 59085392
3.5 Preparation of protein solutions for absorbance measurement.
- Label 10 new test tubes as 1' through 10' and transfer exactly 0.4 mL of the standard albumin solution
from tube 1 to tube 1'. Repeat this transfer process for tubes 2 to 6.
- For tubes 7' and 8', add 0.4 mL of the extracted protein solution that has been diluted 100 times. For
tubes 9' and 10', add 0.4 mL of the protein solution that has been diluted 10,000 times. Note that tubes 7'
and 8', as well as tubes 9' and 10', are identical. This duplication ensures that the concentration of the
extracted and diluted protein solutions is measured twice, and the reported concentration is the average value.
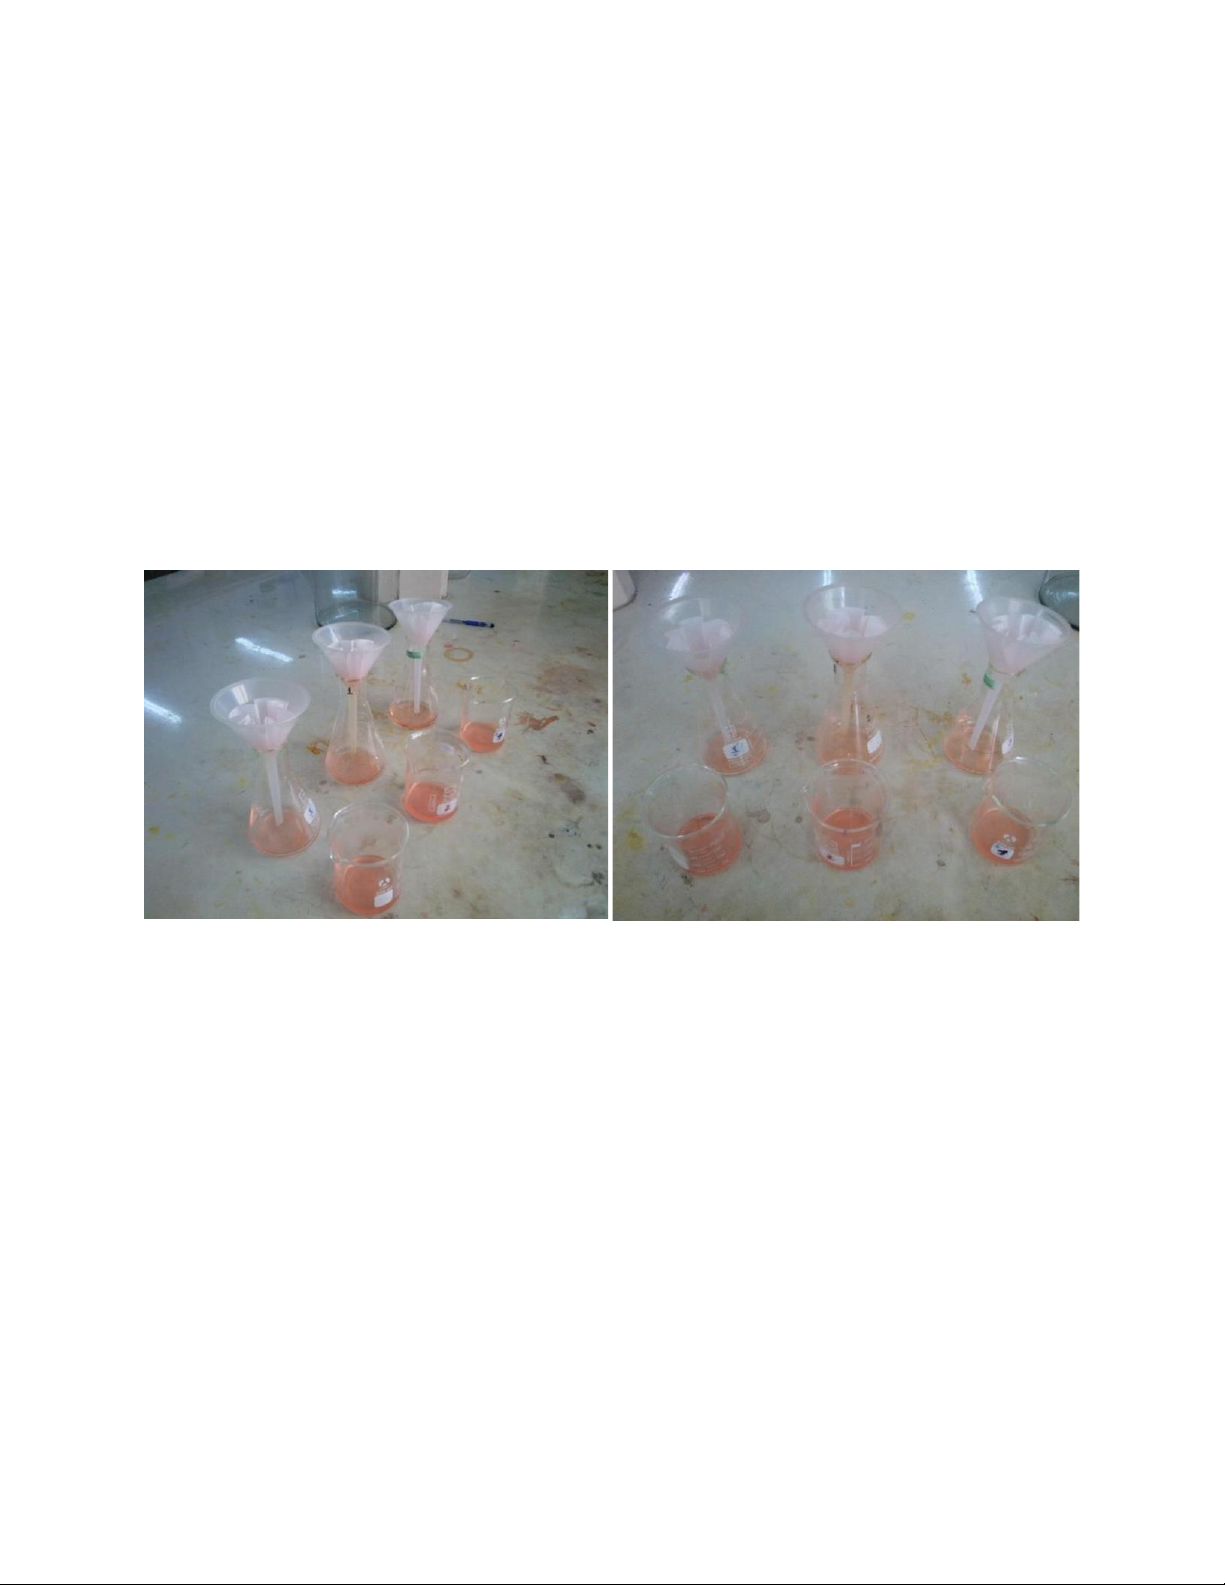
- Add 2.0 mL solution C to each test tube (1’-10’), shake well and allow to stand for 10 minutes
- Next, add 0.2 mL Folin reagent to each test tube (1’-10’), shake well and allow to stand for 10 minutes.
- Finally, add 2.4 mL distilled water to each test tube, shake well and allow to stand for 5 more minutes
before measuring the absorbance at 750 nm (A750) of these solutions.
Table 2: Contents of test tubes 1’-10’ Tube number (mL) 1’ 2’ 3’ 4’ 5’ 6’ 7’ 8’ 9’ 10’ Standard solution 0.4 0.4 0.4 0.4 0.4 0.4 Diluted solution 0.4 0.4 (100-diluted) Diluted solution 0.4 0.4 (10,000-diluted) Solution C 2 2 2 2 2 2 2 2 2 2
Shake each tube well and also keep them for 10 minutes Folin-Ciocalteu 0.2 0.2 0.2 0.2 0.2 0.2 0.2 0.2 0.2 0.2
Shake each tube well and also keep them for 10 minutes Distilled water 2.4 2.4 2.4 2.4 2.4 2.4 2.4 2.4 2.4 2.4
Shake the tubes well, keep them for 5 minutes and measure the A750nm lOMoAR cPSD| 59085392 Figure 2 Figure 3 Before adding reagent After adding reagent
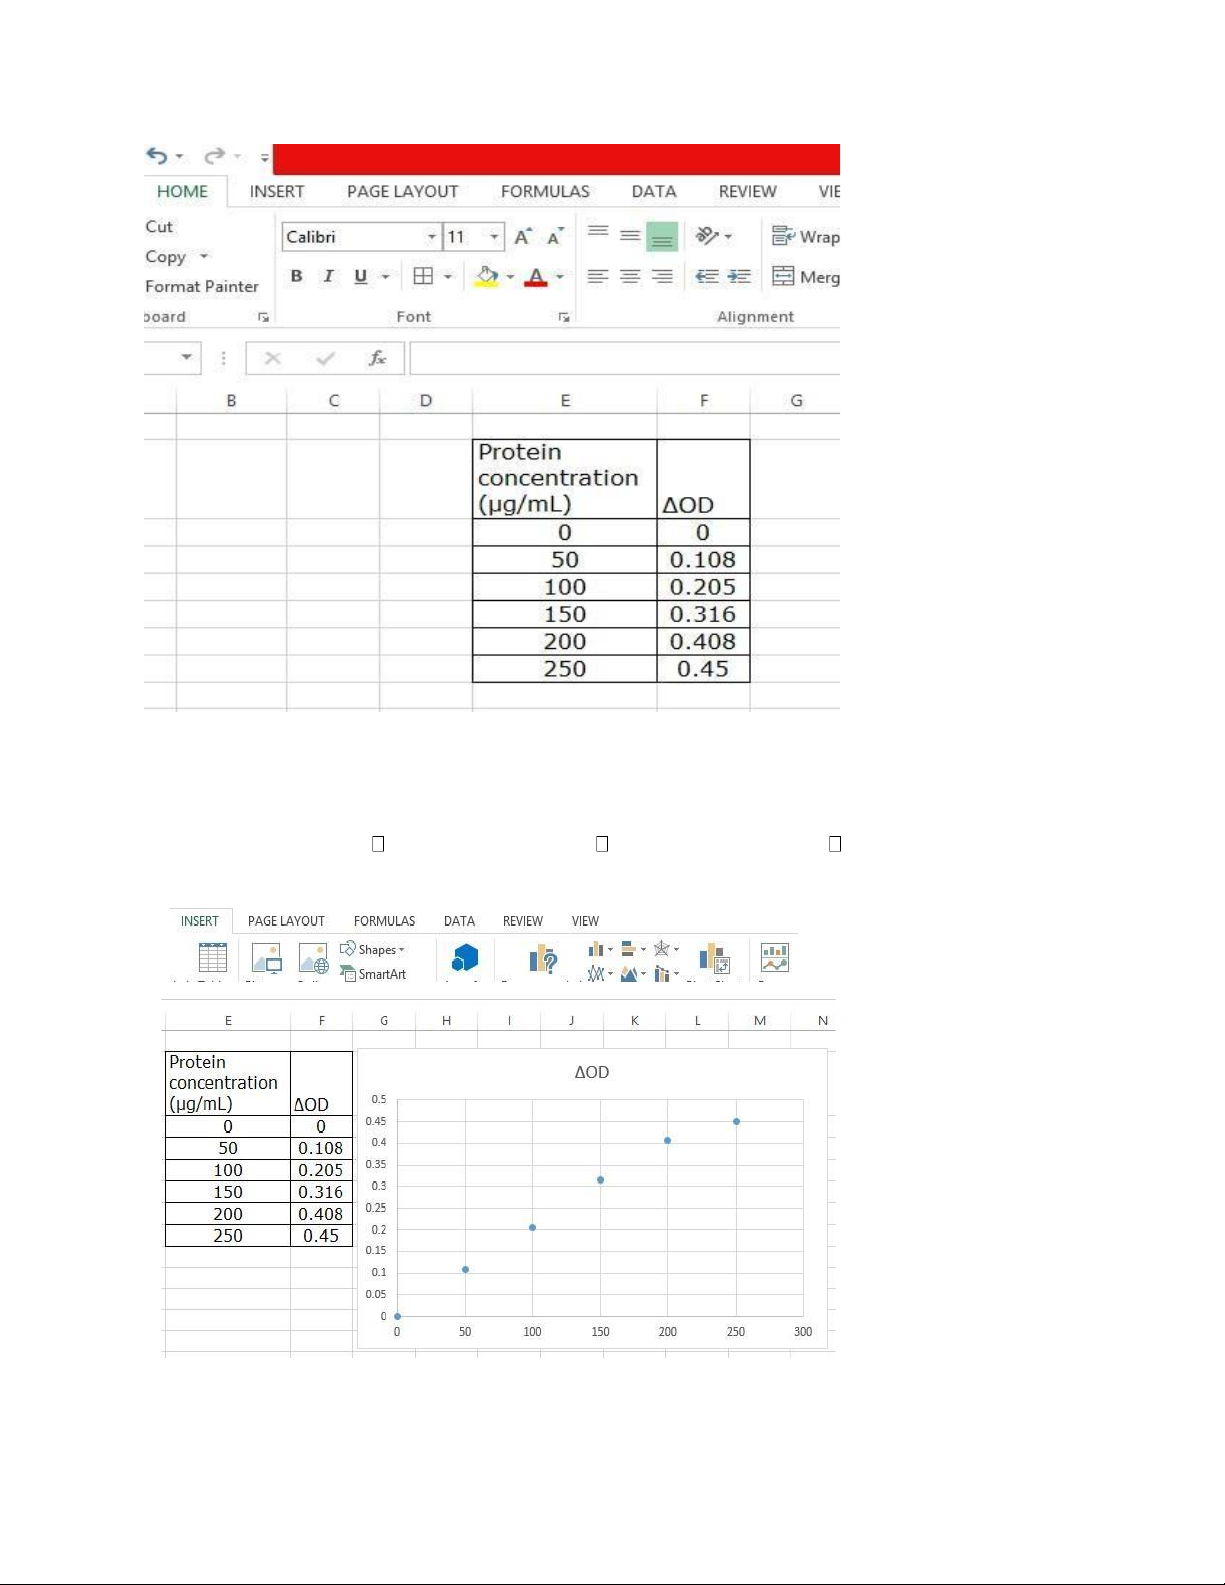
4. Results and data analysis 4.1 Result table Tube number 1’ 2’ 3’ 4’ 5’ 6’ 7’ 8’ 9’ 10’ OD ΔOD Protein concentration y 0 50 100 150 200 250 x (μg/mL)
4.2 Using Microsoft excel to draw the standard curve Step 1: Open excel Step 2: Insert data lOMoAR cPSD| 59085392
Step 3: Click insert bar Black mark all table Choose Insert scatter scatter
Step 4: Obtain the scatter graph without standard curve lOMoAR cPSD| 59085392
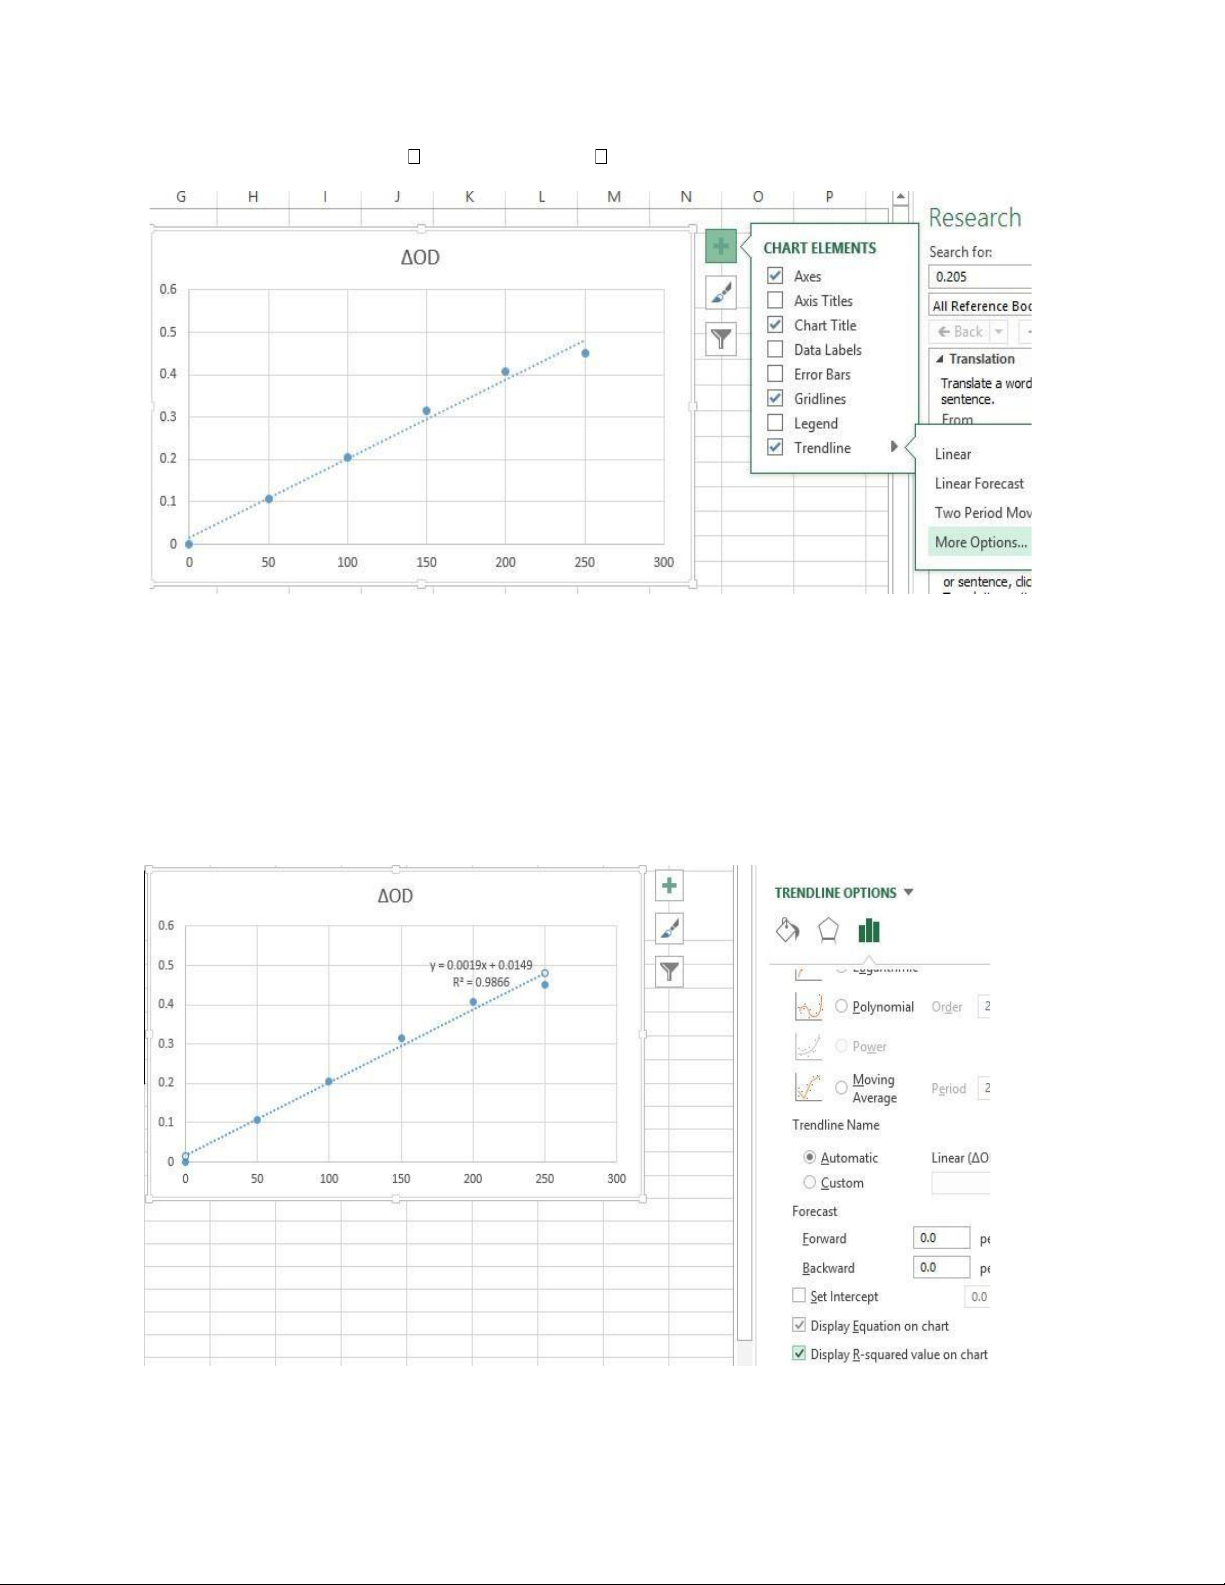
Step 5: Click chart element choose trend line more option
Step 6: Choose “display equation” on chart and “display R-squared value” on chart lOMoAR cPSD| 59085392
Step 7: Name the graph and put the unit 4.3
How to calculation the gram of protein that contains in 100 gram of soybean
The following steps should be taken to calculate the protein concentration of the sample:
- Use the obtained equation to determine the protein concentration of the sample based on its measured optical density (OD)
- Exclude any data point that falls outside the graph's range.
- Convert the unit from micrograms to grams
- Calculate the protein concentration in the 10,000-fold diluted and 100-fold diluted sample solutions. -
Determine the amount of soybean protein in 100 mL of extracted sample solution (mProtein = 100 x
concentration of 100-fold diluted sample), and then calculate the protein content ratio in 5 grams of soybean (mProtein/5). EXPERIMENT 2
Ivestigation of enzymatic activity of bromelain 1. Principle
Bromelain is a type of protease, or proteolytic enzyme, which catalyzes the breakdown of proteins into
amino acids. Proteases such as pepsin, trypsin, and chymotrypsin are present in the digestive tract and are
essential for digesting protein-containing foods. Many plants, including pineapple and unripe papaya
fruit, also produce proteases such as bromelain and papain.
This experiment aims to investigate the proteolytic activity of bromelain extracted from pineapple. The
proteins to be degraded are casein or hemoglobin. When bromelain breaks down casein, the amino acid
tyrosine is released along with other amino acids. Folin reagent reacts with free tyrosine to produce a blue
color compound, which can be quantitatively measured as an absorbance value using a spectrophotometer.
The more tyrosine that is released from casein, the stronger the activity of the protease and the stronger
the blue color. The absorbance values generated by the protease activity are compared to a standard curve
generated by reacting known quantities of tyrosine with Folin reagent. From the standard curve, the
protease activity of the samples can be determined.
2. Equipment and chemicals 2.1 Equipment + Test tubes
+ Pipettes (1mL, 2mL, and 5mL) and pump
+ Beakers (500mL, 250mL and 100mL) lOMoAR cPSD| 59085392 + Falcons (50mL) + Filter paper (11mm) + Spectrophotometer + Centrifuges 2.2 Chemicals + 0.5M NaOH solution + 0.2M HCl solution
+ 5% Trichloroacetic acid solution: 5 g of trichloroacetate dissolved in 100mL of water + Casein
0.65%: Prepare 6.5 mg/ml casein in 50 mM KH2PO4. Gradually increased the solution
temperature with gentle stirring to 80-85°C for about 10 minutes until a homogenous dispersion is
achieved. It is very important not to boil the solution. The pH is then adjusted if necessary (to pH
7.5-8) with NaOH 1M and HCl 1M. Keep it in the fridge.
+ Tyrosine solution: 45 mg of tyrosine dissolved in 100mL purified water and heated gently until the
tyrosine dissolves. As with the casein, do not boil this solution. Allow the tyrosine standard to cool to
room temperature. This solution will be diluted further to make the standard curve. + Folin-Ciocalteu reagent
3. Practical procedures
3.1 Preparation of sample
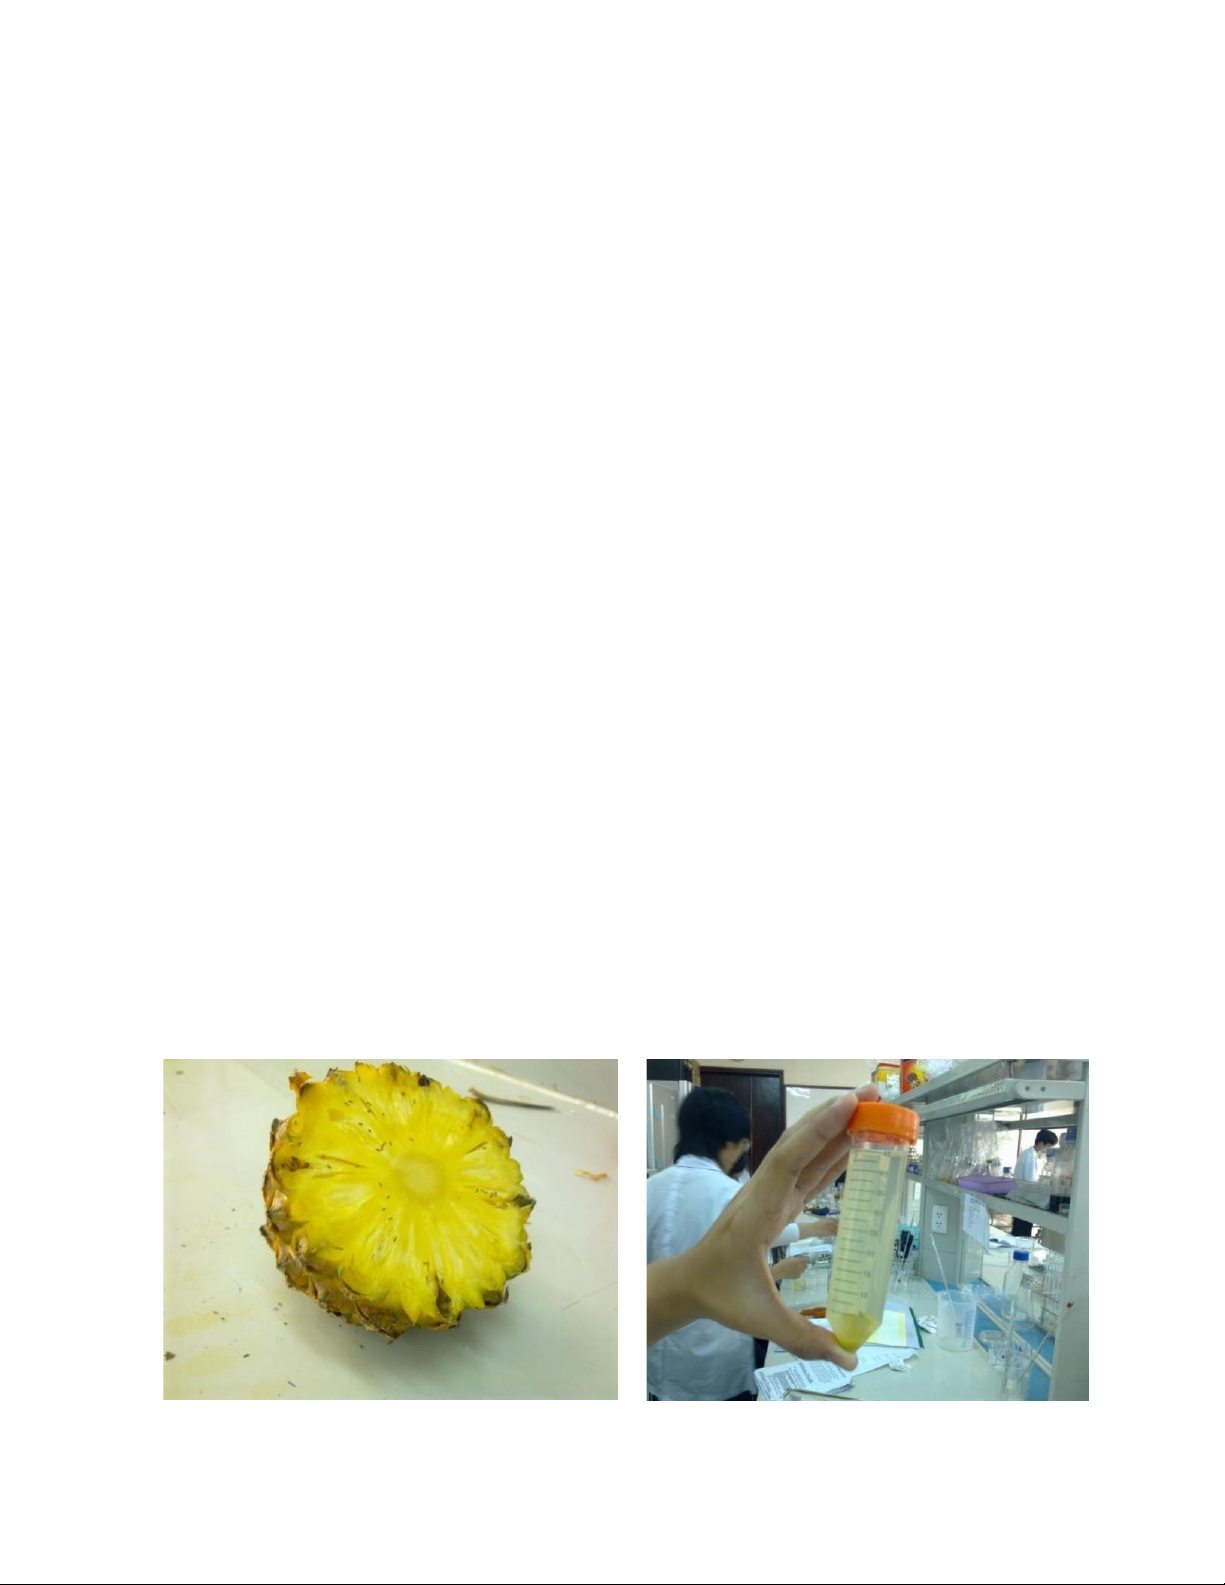
Step 1: Choose fresh, moderately ripe pineapple to cut into pieces and then pulverize it by blender or stone mortar.
Step 2: Use filter papers (takes about 1 to 1.5 hour) or centrifuge (5000rs/m for 10 minutes) to remove the
remained grounds out of the pineapple juice.
Figure 2.1 Pineapple Figure 2.2 Pineapple extract after centrifuging lOMoAR cPSD| 59085392
3.2 Investigate the enzymatic activity
Step 1: You perform the experiment following the table below. Test tubes
Tubes of tyrosine (standard Tubes of Tubes of water solution) sample (blank) 1 2 3 4 5 6 7 8 9
Casein 0.65% in phosphate buffer 2.0 2.0 2.0 2.0 2.0 2.0 2.0 2.0 2.0 (mL)
Keep the tubes at 37 0C for 5 mins
Solution of trichloroacetic acid 5% 5.0 5.0 5.0 0 0 0 5.0 5.0 5.0 (mL) DI water (mL) 3.0 3.0 3.0 3.5 3.5 3.5 3.5 3.5 3.5
Solution of Tyrosine (mL) 0.5 0.5 0.5 0 0 0 0 0 0
Pineapple solution that contains 0 0 0 0.2 0.2 0.2 0 0 0 bromelain (mL)
Shake the tubes well at 370C for exactly 10 mins
Solution of trichloroacetic 5% (mL) 0 0 0 5.0 5.0 5.0 0 0 0
Pineapple solution that contains 0.2 0.2 0.2 0 0 0 0.2 0.2 0.2 bromelain (mL)
Step 2: Shake each tube well and keep them still for 10 minutes at 370C, then filter the all tubes.
Step 3: Transfer 2mL of filtered solution of each tube into new tubes
Step 4: Add 5mL of 0.5M NaOH solution and 1mL of Folin-Ciocalteu reagent
Step 5: Shake the tubes well, then put the tubes at the stand for 10 minutes and measure the A660nm
4. Results and data analysis
With the molecular weight of tyrosine is: MW =181 g/mole, the number of moles of the sample tyrosine is: msample (mg) 3 ( mole) nsample = =10 181(mg/mmole) lOMoAR cPSD| 59085392
The enzyme activity of bromelain is then determined as the number of µmole of tyrosine liberated from casein per minute: 𝑛sample Enzyme activity =
= (𝜇mole/min) or (𝑈) proteolytic time
As the volume of bromelain solution used in this experiment is Vsample (0.2 mL), the enzyme activity of 1 mL bromelain solution is: 1 nsample Enzyme activity = ´ = (U/mL)
proteolytic time Vsample(mL)
The activity of bromelain enzyme is determined depending on quantity (μg) of tyrosine produced from
casein degradation under catalysis of enzyme in 1mL of solution or 1mg of bromelain mixture for 1 minute.
EXPERIMENT 3 Soluble carbohydrate quantification applying Anthrone assay 1. Principle
Carbohydrates are a vital component of many foods, and can be categorized as monosaccharides,
oligosaccharides or polysaccharides based on the number of monomers they contain. Some carbohydrates
are digestible and provide energy, while others are indigestible and don't provide energy but offer benefits
such as reducing the risk of certain diseases. Carbohydrates also contribute to the sweetness, appearance,
and texture of foods, and it's important to determine their type and concentration for various reasons.
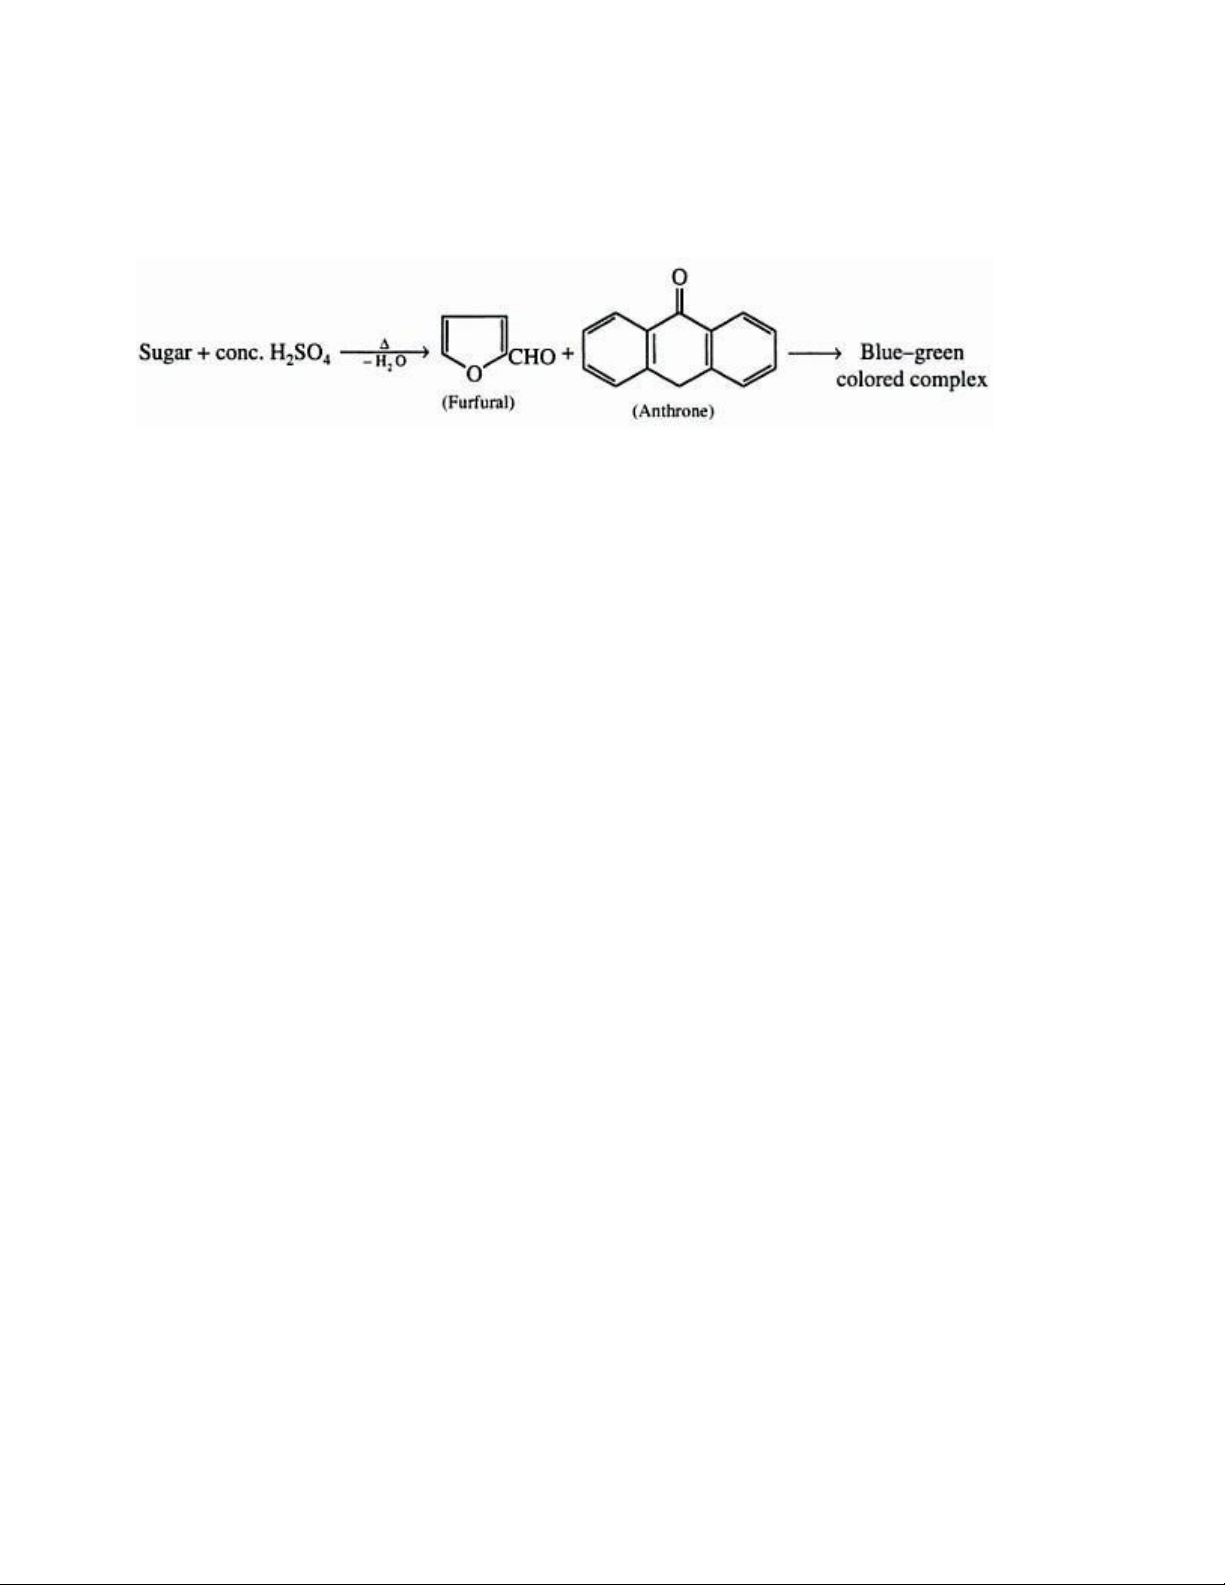
The anthrone method is a colorimetric technique utilized to measure the total sugar concentration in a
sample. When combined with the anthrone reagent under acidic conditions, sugars create a blue-green
color. To perform the test, the sample is mixed with the reagent and sulfuric acid and then boiled. After
cooling, the solution's absorbance is measured at 630 nm. The test determines both reducing and
nonreducing sugars due to the strong oxidizing nature of sulfuric acid, and a calibration curve with known
carbohydrate concentrations is needed since the method is non-stoichiometric.
The anthrone-sulfuric method is best suited for solutions containing a single type of hexose as sugars with
similar structures have varying rates and quantities of color development. While other sugars, like lOMoAR cPSD| 59085392
pentoses and hexuronic acids, also produce colored compounds that absorb at the same wavelength, it
only poses an issue when their levels exceed a certain threshold. This method can also quantitatively
analyze oligo- and polysaccharides, as long as only one type is present in the solution.
The accuracy of the reaction is based on the cleanness of equipment, the purification of the reagent,
especially for sulfuric acid and the constant temperature during the boiling time.
2. Equipment and chemicals 2.1 Equipment
+ Volumetric flasks (50mL and 100mL) + Beakers (50mL and 100mL) + Stone mortar + Filter paper (11mm) + Test tubes + Pipettes (1mL and 10mL) + Spectrophotometer 2.2 Chemicals + Alcohol 90o + Alcohol 80o
+ Anthrone reagent: 0.002 g/ml in concentrated H2SO4
+ 0.01% Glucose solution: dissolve 0.01 g of glucose, which has been dried in the desiccator, in 100 mL of distilled water.
3. Practical procedures
3.1 Preparation of sample
Step 1: Take 2g of pulverized raw material and put it into the beaker of 50mL.
Step 2: Add 10mL of alcohol 90o into the beaker.
Step 3: Put the beaker in the water bath at 80oC. Using the stirring rod to stir the solution well during the heating process.
Step 4: Get the solutes in alcohol by filtering the cloth. lOMoAR cPSD| 59085392
Step 5: Add 10mL of alcohol 80o into the beaker of grain and do the same at step 3 and 4. Alcohol can be
vaporized naturally or by providing heat slight to the beaker. Do step 5 two times.
Step 6: Dissolve the extracted soluble carbohydrate in 100mL of water to make 100-diluted solution by
using the volumetric flask. If there is the sediment in sample, let it settle down.
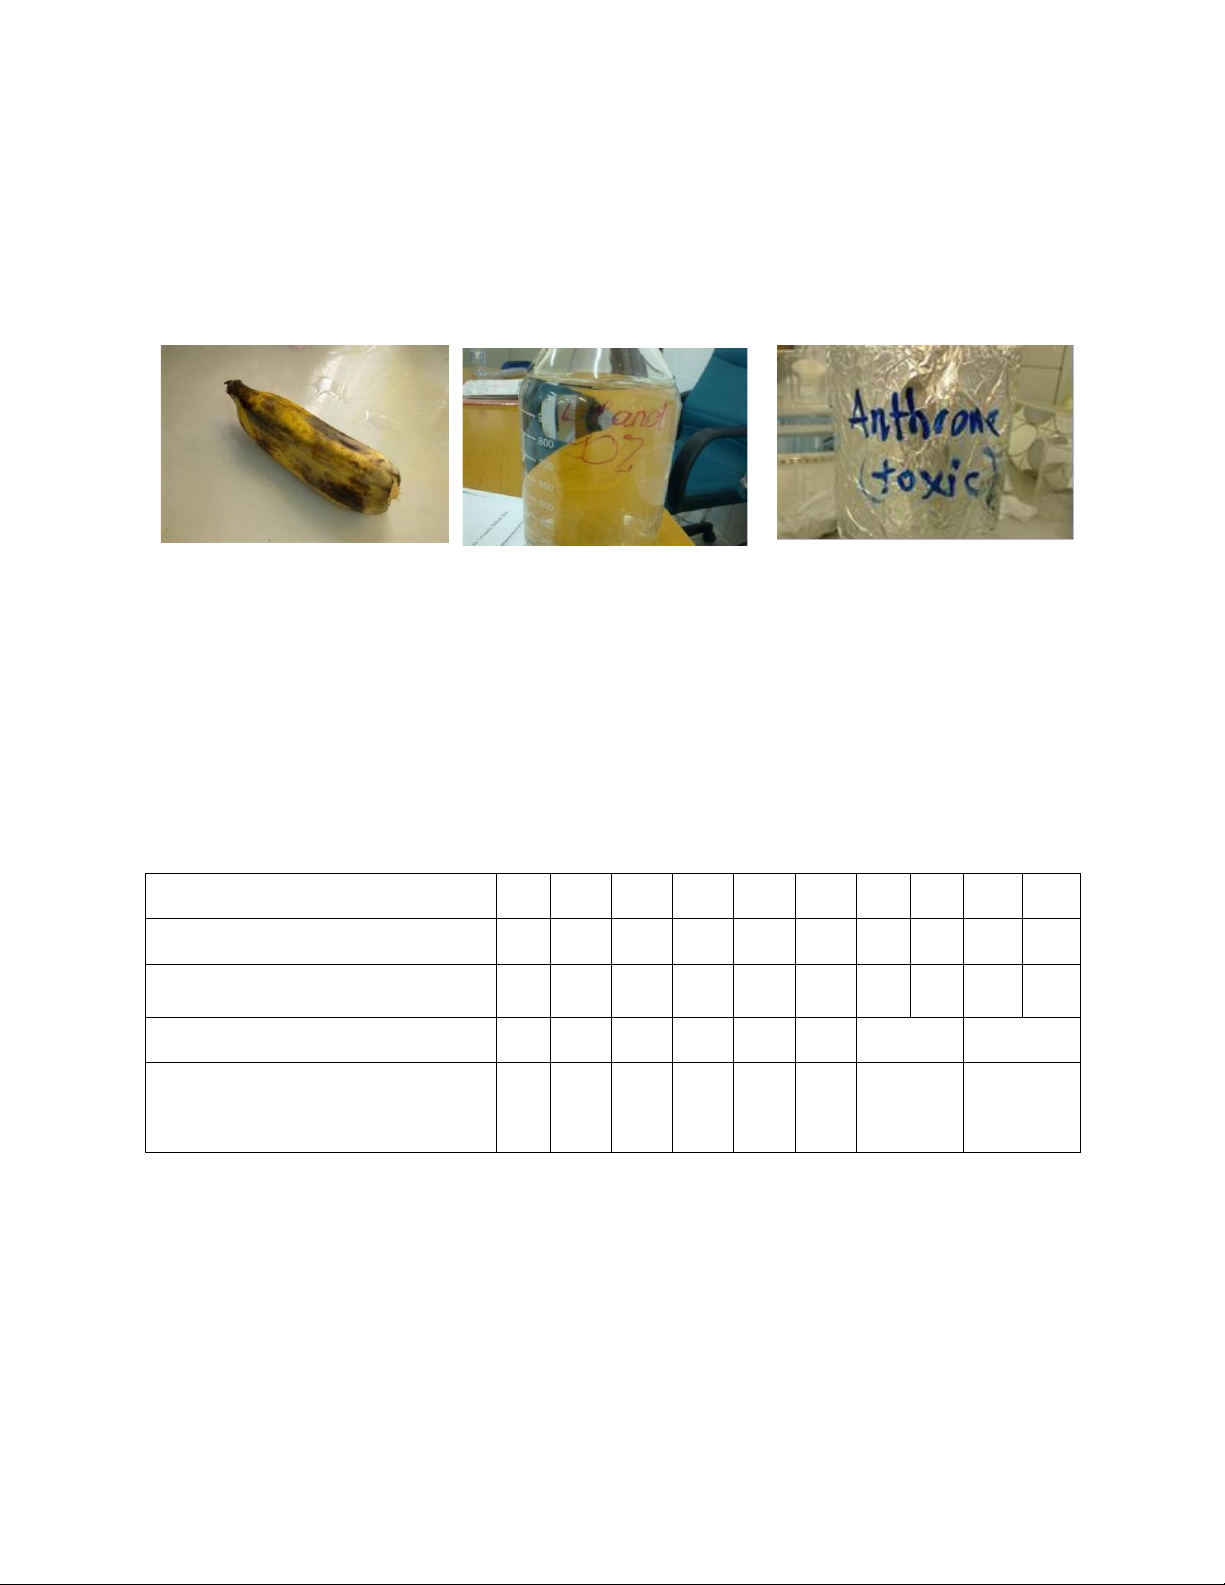
Figure 3.1 Banana Figure 3.2 Alcohol Figure 3.3 Anthrone reagent
Step 7: Dilute the 100-diluted solution 100 times to get 10,000-diluted solution because the amount of
carbohydrate is unknown. If the absorbance intensity is too high, the sugar sample should be diluted further.
3.2 Color-forming reaction
Preparing 10 test tubes which are labeled from 1 to 10. Place the standard glucose solutions and the
extracted sugar solution as decribed in the table below Tube number 1 2 3 4 5 6 7 8 9 10 0.01% Glucose (mL) 0 1 2 3 4 5 Distilled water (mL) 5 4 3 2 1 0 Sample (mL) 5 5 The concentration in each y 0 0.02 0.04 0.06 0.08 0.1 x Tube (mg/mL)
Step 1: Put all tubes in the ice-water.
Step 2: Put slowly 10 mL of Anthrone reagent into each tube. Let the reagent flow along the insidesurface of the tube.
Step 3: Stir the solution very slowly by a glass stick. Then boil all tubes in hot water for 7.5 minutes.
After that, put all tubes in cool water immediately.
Step 4: Finally, determine at the A630nm. lOMoAR cPSD| 59085392 Adding Anthrone reagent After Color-forming reaction
4. Results and data analysis
Look at the guideline in the experiment 1 to calculate the result
EXPERIMENT 4 Quantitative determination of calcium in powdered milk 1. Principle
Calcium is crucial for bone and teeth development in growing children, which is why they're encouraged
to consume milk, a calcium-rich source. Additionally, calcium is necessary for proper blood clotting and
heartbeat regulation in adults, with the recommended dietary allowance being 800 milligrams for both sexes.
One of the oldest known methods for determining calcium involves precipitation as oxalate, which is then
solubilized with sulfuric acid and titrated with potassium permanganate. However, while this method is
inexpensive, it involves ashing and multiple steps, making it unsuitable for rapid analysis.
Oxalate ammonium will precipitate all calcium ion in any solution when the experimenter set up all
following conditions severely:
+ pH of solution environment is greater than 4
+ The hot, saturated (COONH4)2 solution is filled only one time into the sample containing calcium ion.
+ Freeze the solution immediately after the solution has heated up for 1 minute lOMoAR cPSD| 59085392
In acid solution, calcium exists in its ionic form, Ca2+. Upon addition of the oxalate ion to a solution,
calcium if present, forms insoluble calcium oxalate Ca(COO)2 Ca2+ + (COONH + 4)2 = 2NH4 + Ca(COO)2 (1)
After the calcium oxalate precipitate forms, it is isolated from the solution and washed extensively to
remove excess oxalate. Then, the precipitate is dissolved by reacting it with sulfuric acid, a strong acid, to
recover the oxalate. When combined with hydrogen in sulfuric acid solution, oxalate forms oxalic acid, H2C2O4 ((COOH)2):
Ca(COO)2 + H2SO4 = CaSO4 + (COOH)2 (2)
The quantity of oxalic acid, which is an indirect indicator of the initial calcium amount, can be
conveniently calculated through titration with potassium permanganate. This reaction involves the
transfer of 5 electrons to each formula unit of KMnO4, while each formula unit of oxalic acid loses only 2
electrons. These types of reactions, which involve electron transfer between species, are referred to as
oxidation-reduction (REDOX) reactions, where potassium permanganate acts as the oxidizing agent and
oxalic acid serves as the reducing agent.
5(COOH)2 + 2KMnO4 + 3H2SO4 = K2SO4 + 2MnSO4 + 10CO2 + 8H2O (3)
During the REDOX titration, the endpoint is signified by the sudden appearance of a purple pink color,
indicating an excess of KMnO4. The quantity of calcium present in the milk sample can be calculated
based on the volume of KMnO4 used to titrate oxalic acid in the reaction.
2. Equipment and chemicals 2.1 Equipment + Racemic crucibles + Muffle furnace + Desiccator + Burette + Erlenmeyer flasks (250mL) + Beakers (100mL) + pH meter + Filter papers (11mm) 2.2 Chemicals + Powdered milk + Saturated (COONH4)2 + Concentrated HCl lOMoAR cPSD| 59085392 + Methyl red + 0.1M NH4OH + Acetic acid + Saturated Calcium chloride + 1N H2SO4 + 0.02N KMnO4
3. Practical procedures
3.1 Preparation of sample
Take three labeled ceramic cups and weigh precisely 0.5-0.6 g of milk powder in each of them. Put these
cups in the furnace for half an hour. Repeat the experiment thrice using these three milk samples.
3.2 Calcium quantification
Step 1: Take three separate milk ash samples from the desiccator, each contained in a ceramic crucible.
Allow them to cool to room temperature and add 5 mL of distilled water, followed by 5 drops of
concentrated hydrochloric acid.
Step 2: Mix well and transfer these solutions separately into 3 different beakers of 250mL to adjust pH.
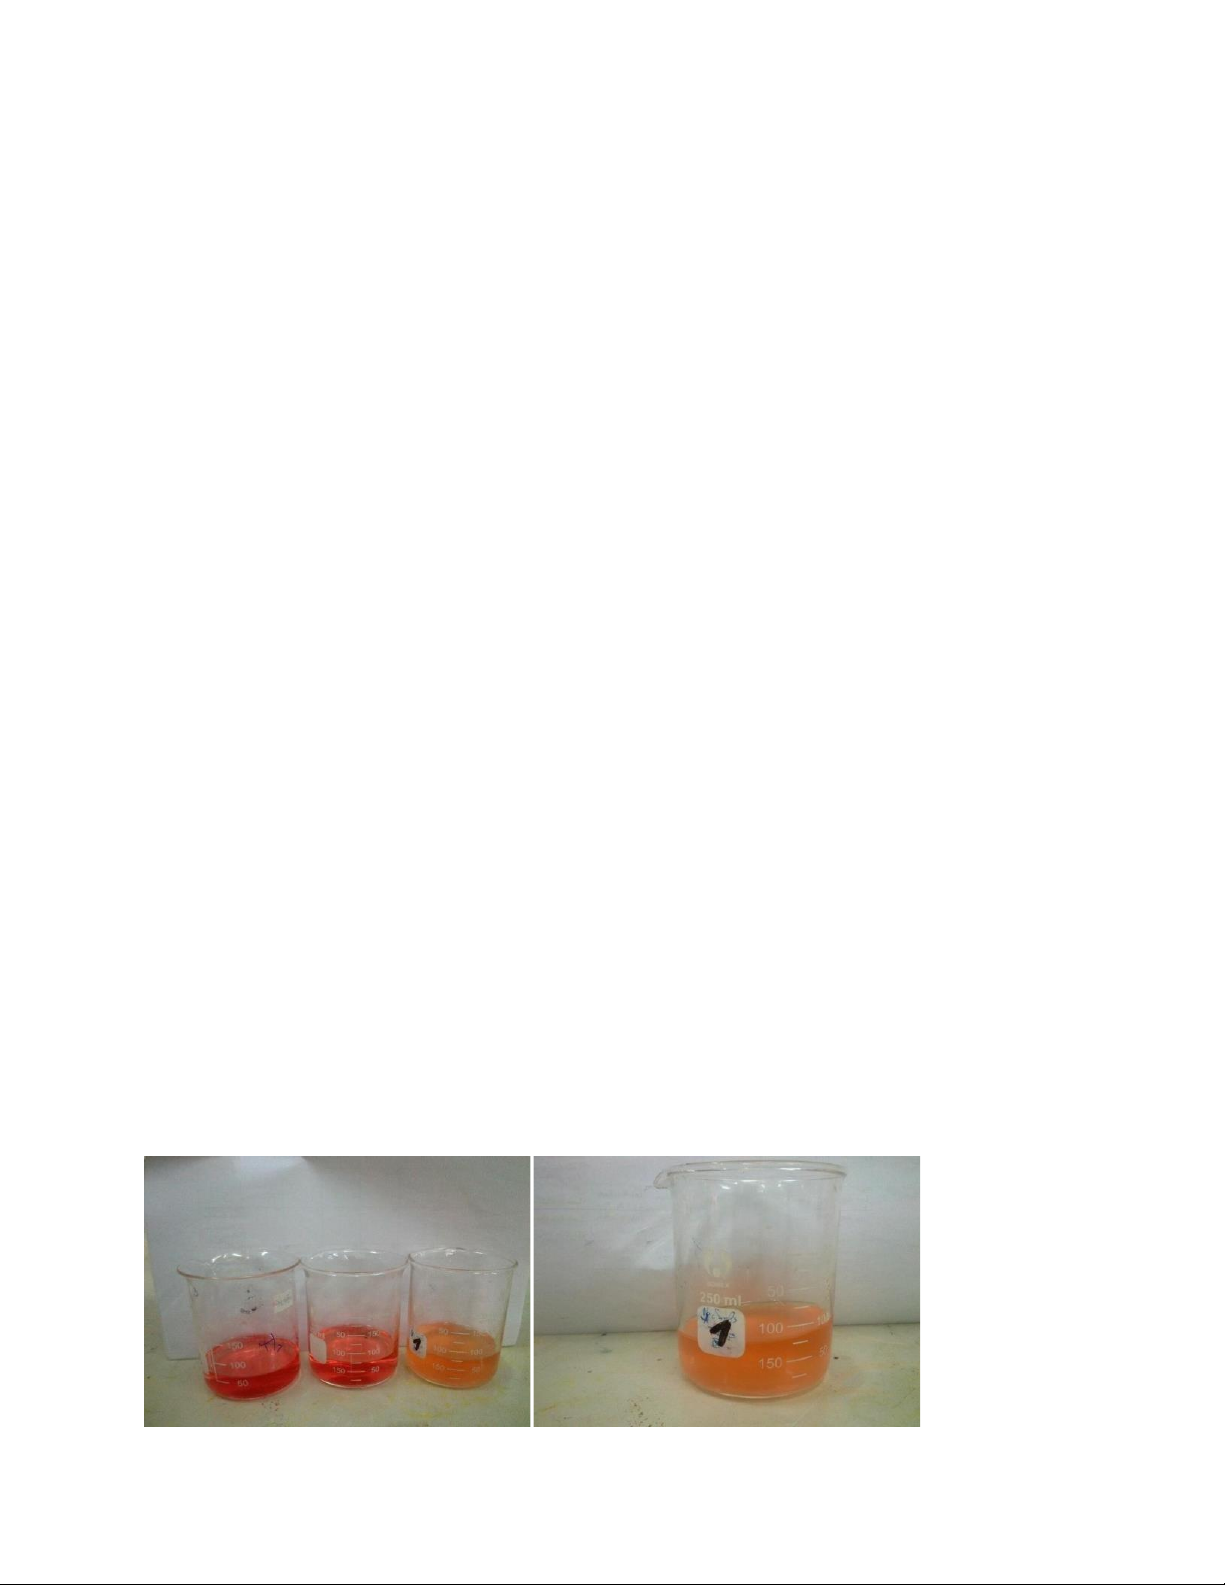
Step 3: Neutralize the excess HCl after dissolving the milk ash, then add 2-3 drops of methyl red as an
organic indicator. Add NH4OH 0.1 N until the solution turns yellow (about 20 mL), then adjust the pH to
5-5.2 with acetic acid 0.01 N to achieve an orange-pink solution color.
Step 4: Adjust the pH of the solution to from 5 to 5.2 by acetic acid of weak concentration. At that point,
the solution color is orange-pink. Due to the instrumental error, each pH meter will give a different value
of pH. Therefore, observe the color of solution is also very important. Do not over-rely on any type of machine.
Sample solution after filling 2-3mL of saturated (COONH4)2 lOMoAR cPSD| 59085392
Step 5: The solution is heated in a water bath at 70oC and stirred while adding 2-3mL of saturated
ammonium oxalate solution for 10 minutes. A white insoluble precipitate (Ca(COO)2) should start to form.
Step 6: The beaker is then removed from heat and placed in cool basin of water immediately.
Step 7: Keep the beaker in the basin of water for about 30 minutes.
Step 8: To separate the precipitate from the liquid in the solution, use a filter paper. Pour the solution onto
the filter paper, allowing the liquid to filter through while the precipitate remains on the filter paper. To
ensure that all of the precipitate is transferred to the filter paper, rinse the beaker with a minimal amount
of water. Additionally, rinse the filter paper with water to eliminate any unreacted oxalate ions (COO) 2- 2 ) from the precipitate. Filtering the precipitate
Step 9: To verify if all (COO) 2-
2 ) ions have been eliminated, a saturated calcium chloride solution is utilized
Step 10: Collect precipitate retained by filter paper and put them into Erlenmeyer flask
Step 11: Add 20mL of 1N sulfuric acid solution into each Erlenmeyer flask and heat them in water bath
with temperature of 70oC for 1 minute.
Step 12: Titrate the solution with 0.02 N potassium permanganate solution to determine the concentration of (COO) 2-
2 ) ion in the solution. The end point is a definite purple-pink color that appears and remains for
at least 30 seconds. Record the volume of KMnO4 required to reach the end point.
4. Results and data analysis
Step 1: Base on the reaction (3): Mn7+ + 5e → Mn2+
The relation between the concentration (M) and the concentration (N) is: lOMoAR cPSD| 59085392 N M = ne
Where ne is quantity of electron(s) that is/are used to transfer from reductive substance to oxidative
substance in the reaction. M is the concentration of the oxidative substance (Mn2+). N is the concentration
of the reductive substance (5(COOH)2 in this case Step 2:
+ The moles of 0.02 N KMnO4 that contains in 1 liter of solution is: = 4×10⁻³ (mol)
+ The moles of 0.02 N KMnO4 that contains in V liter of solution is: V×4×10⁻³ (mol) +
Base on the reactions (1), (2), (3), we have:
nCa2+ = 5/2 × nKMnO4 = 5/2×V×4×10-3 (mol) = 0.01V (mol) +
The gram of Calcium that contains in (m) g of milk powder:
mCa2+ = 0.01V× 40 (g) = 0.4V (g)
+ The gram of Calcium that contains in 100g of milk powder: mCa2+= 0.4V×100/0.5 = 80V (g) Where
V: the volume (L) of 0.02 N KMnO4 that is used to determine the quantitative measurement m:
the weight of the powdered milk (m=0.5g)
Tài liệu liên quan:
-
Genetically Modified Microorganisms for Biofuels | Môn Biochemistry - Trường Đại học Quốc tế, Đại học Quốc gia Thành phố Hồ Chí Minh
123 62 -
Introductory Report on Key Learnings | Môn Biochemistry - Trường Đại học Quốc tế, Đại học Quốc gia Thành phố Hồ Chí Minh
132 66 -
Midterm Review: Enzymes, Metabolism, and Applications | Môn Biochemistry - Trường Đại học Quốc tế, Đại học Quốc gia Thành phố Hồ Chí Minh
120 60 -
Biochemistry Unit Notes: Carbohydrates, Amino Acids, and More | Môn Biochemistry - Trường Đại học Quốc tế, Đại học Quốc gia Thành phố Hồ Chí Minh
126 63