Chapter 3: The Balance of Payments - International Money and Finance | Tài chính quốc tế | Trường Học Viện nông nghiệp Việt Nam
Summing up the debits and credits shows the balance on a subsection of the international transactions.The balance of payments entries in Fig. 3.1 actually end at line 29. Lines 30–35 are summaries drawn from lines 1 to 28.The summaries come from drawing lines in the balance of payments at different places. A line is drawn in the balance of payments schedule and then the debit and credit items above such a line are summed. For example, if we draw a line at the current account balance items ending with secondary income (line 16) and sum all credit and debit entries above, this would give us the current account surplus/deficit. Tài liệu được sưu tầm và soạn thảo dưới dạng file PDF để gửi tới các bạn cùng tham khảo, ôn tập đầy đủ kiến thức, chuẩn bị cho các buổi học thật tốt. Mời bạn đọc đón xem!
Môn: Tài chính quốc tế (hvnn) 130 tài liệu
Trường: Học viện Nông nghiệp Việt Nam 2.4 K tài liệu
Tác giả:
Preview text:
CHAPTER 3 The Balance of Payments Contents Current Account 61 Financing the Current Account 64 Additional Summary Measures 67 Transactions Classifications 69 Current Account Disequilibria 71
Balance of Payments Equilibrium and Adjustment 74 The US Foreign Debt 77
How Serious Is the US Foreign Debt? 79 Summary 79 Exercises 80 Further Reading 81
We have all heard of the balance of payments. Unfortunately, common
usage does not allow us to discuss the balance of payments because there
are several ways to measure the balance, and the press often blurs the dis-
tinctions among these various measures. In general, the balance of payments
records a country’s trade in goods, services, and financial assets with the
rest of the world. Such trade is divided into useful categories that provide
summaries of a nation’s trade.
In June 2014, the US Bureau of Economic Analysis released compre-
hensively restructured international economic accounts. The restructur-
ing was done to closer align with the latest revision of the International
Monetary Fund’s (IMF) Balance of Payments and International Investment
Position Manual, 6th edition. Most countries in the world have followed the
IMF update, resulting in international economic accounting that is almost
identical across countries. Therefore the following discussion applies equally
Li nteo the United States as well as other countries. Fig. 3.1 presents the 1970 1985 2000 2005 2010 2015 Current account general1 ca Extpeorg ts o ofr i g e oo sd s o
an fd steh rvi e ce s ba and l ia n n co c m e e r eo
cei fp tspa (crey di m
ts) ents for the United States. This 68.4 394.1 1,471.5 1,896.0 2,630.8 3,138.7 2 Exports of goods and services 56.6 289.1 1,075.3 1,286.0 1,853.6 2,223.6 figure u 3 se s t h Go e
od sgeneral categories to make it easier to identify the popular 42.5 215.9 784.9 913.0 1,290.3 1,513.5 4 Services 14.2 73.2 290.4 373.0 563.3 710.2 summa5ry m Pr e imaarsyu in r c e omse r o ec f ei pt t
s he balance of payments. Table 3A in the appen- 11.7 105.0 358.8 544.0 684.9 783.1 6 Investment income 11.7 105.0 354.4 539.2 679.0 776.0 dix pre 7 se nt s Coth mp e en sade tion t of a e il m e plod yee ba s
lance of payments for a country, in this case – – 4.4 4.8 5.9 7.0 8
Secondary income (current transfer) receipts – – 37.4 66.0 92.3 132.0 for Bra9zilI. m B por e ts c o a f u go s o e ds am nd o sersvt i ce c s o an u d i n nc tor m iee p s a y f m o en ltl s o (d w ebi
ts t)he IMF directive for balance of 66.1 512.3 1,882.3 2,641.4 3,072.8 3,622.8 10 Imports of goods and services 54.4 411.0 1,447.8 2,000.3 2,348.3 2,763.4 11 Goods 39.9 338.1 1,231.7 1,695.8 1,939.0 2,272.8 12 Services 14.5 72.9 216.1 304.4 409.3 490.6 13 Primary income payments Copyright © 201 7 Elsevier Inc. 5.5 79.3 339.6 476.3 507.3 591.8 Internation 1 a 4 l M o In n evy estan m d ent F i i n n c a o n m c e e. 460.4 493.3 All rights reserved. 59 5.5 79.3 328.7 574.5 15 Compensation of employees – – 11.0 15.9 14.0 17.3 16
Secondary income (current transfer) payments 6.2 22.0 94.8 164.8 217.2 267.7 Financial account 19
Net US acquisition of financial assets excluding financial derivatives (net increase in assets/financial outflow (+)) 9.3 47.1 589.3 572.3 963.4 242.2 20 Direct investment assets 7.6 21.2 188.0 61.9 354.6 345.1 21 Portfolio investment assets 1.1 3.0 159.7 267.3 199.6 186.3 22 Other investment assets 3.2 19.0 241.3 257.2 407.4 –282.9 23 Reserve assets –2.5 3.9 0.3 –14.1 1.8 –6.3 24
Net US incurrence of liabilities excluding financial derivatives (net increase in liabilities/financial inflow (+)) 7.2 146.5 1,067.0 1,273.0 1,386.3 426.0 25 Direct investment liabilities 1.5 22.1 350.1 138.3 259.3 409.9 26
Portfolio investment liabilities 11.7 68.0 442.0 832.0 820.4 263.4 27 Other investment liabilities –5.9 56.5 275.0 302.7 306.6 –247.2 28
Financial derivatives other than reserves, net transactions n.a. n.a. n.a. n.a. –14.1 –25.4 Statistical discrepancy 29 Statistical discrepancy –0.2 18.7 –66.9 31.6 5.1 274.9 Balances 30
Balance on current account (line 1 less line 9) 2.3 –118.2 –410.8 –745.4 –442.0 –484.1 31
Balance on goods and services (line 2 less line 10) 2.3 –121.9 –372.5 –714.2 –494.7 539.8 32
Balance on goods (line 3 less line 11) 2.6 –122.2 –446.8 –782.8 –648.7 –759.3 33
Balance on services (line 4 less line 12) –0.3 0.3 74.3 68.6 154.0 219.6 34
Balance on primary income (line 5 less line 13) 6.2 25.7 19.2 67.6 177.7 191.3 35
Balance on secondary income (line 8 less line 16) –6.2 –22.0 –57.4 –98.8 –125.0 –135.6
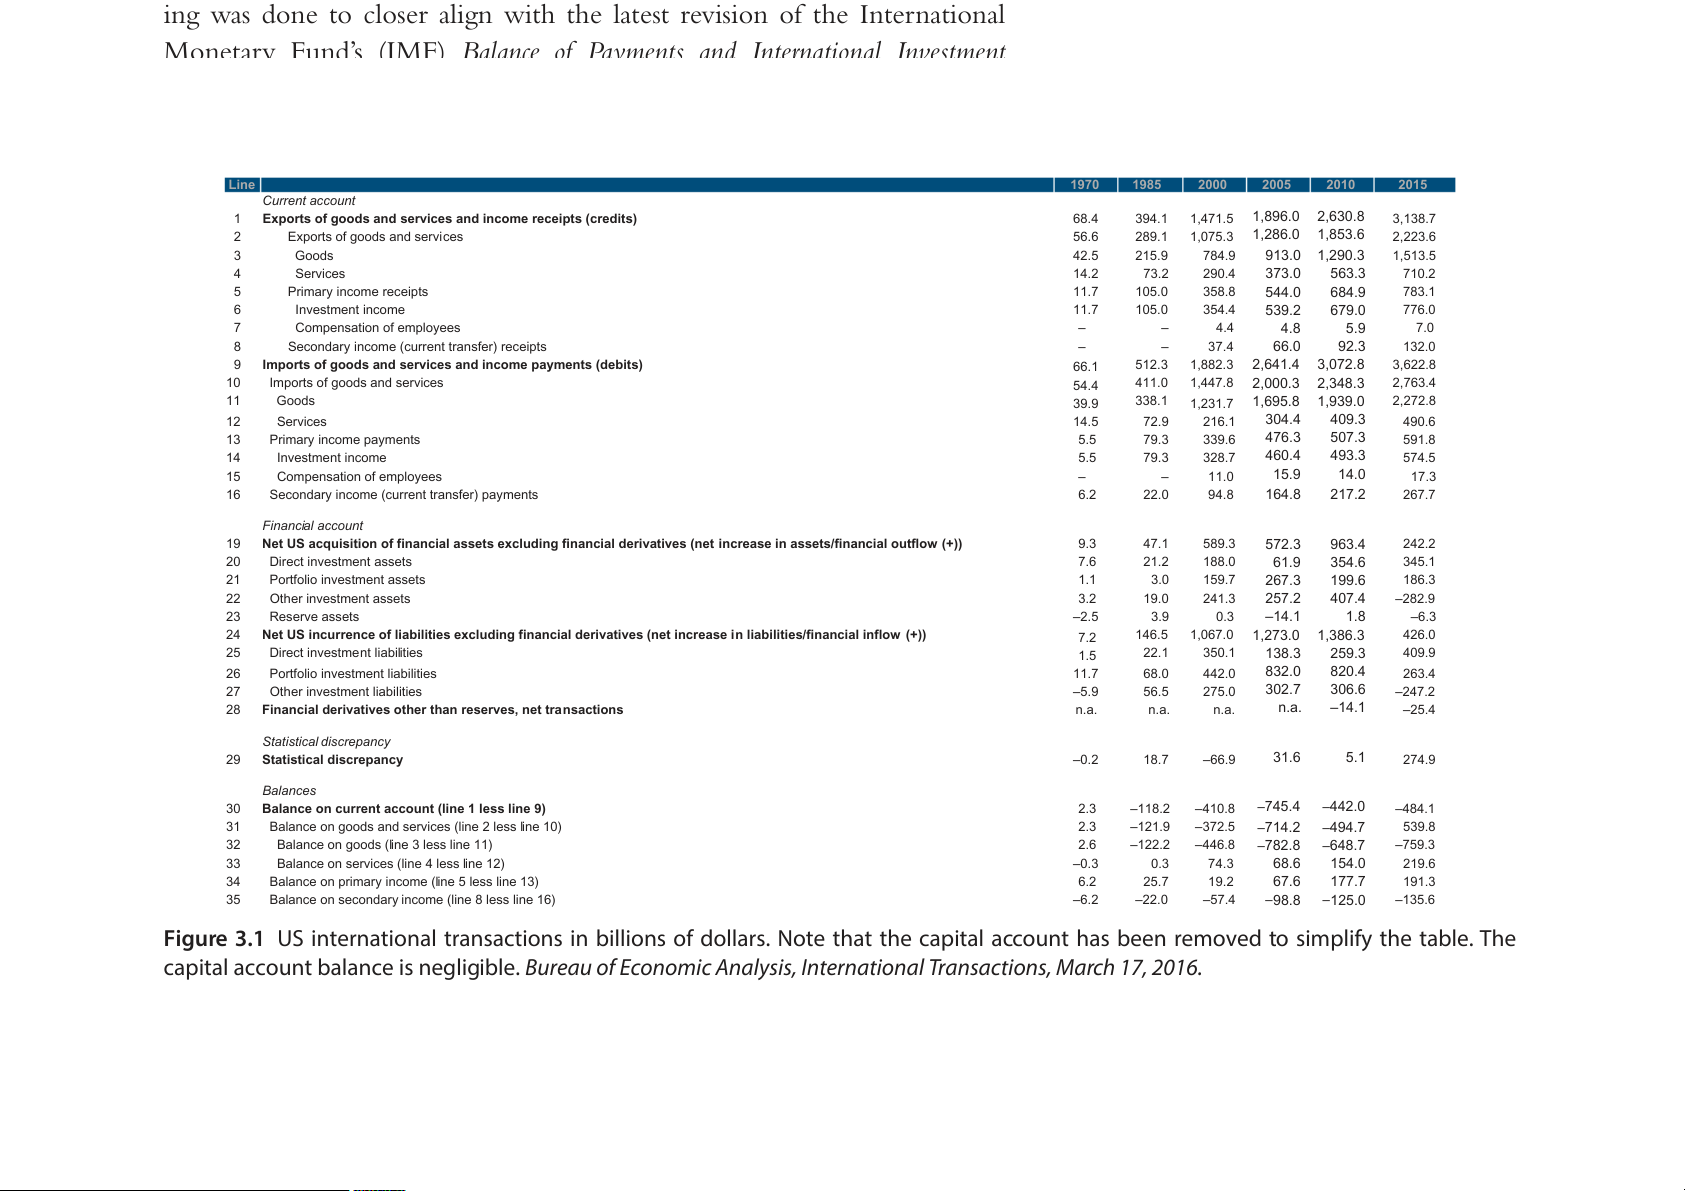
Figure 3.1 US international transactions in billions of dollars. Note that the capital account has been removed to simplify the table. The
capital account balance is negligible. Bureau of Economic Analysis, International Transactions, March 17, 2016. The Balance of Payments 61
payments, the particular country does not matter. In this chapter we will
discuss several summary measures of the balance of payments, pointing out
their uses as well as their drawbacks.
The balance of payments is an accounting statement based on double-
entry bookkeeping. Every transaction is entered on both sides of the bal-
ance sheet, as a credit and as a debit. Credit entries are those entries that
will bring foreign exchange into the country, whereas debit entries record
items that would mean a loss of foreign exchange. In Fig. 3.1, debit entries
enter the balance of payments as a negative value. For instance, suppose
we record the sale of a machine from a US manufacturer to a French
importer and the manufacturer allows the buyer 90 days credit to pay.
The machinery export is recorded as a credit in the merchandise account,
whereas the credit extended to the foreigner is a debit to the financial
account. Thus, credit extended belongs in the same broad account with
stocks, bonds, and other financial instruments of a short-term nature.
If, for any particular account, the value of the credit entries exceeds
the debits, we say that a surplus exists. On the other hand, where the debits
exceed the credits, then a deficit exists. Note that a surplus or deficit can
apply only to a particular area of the balance of payments, since the sum of
the credits and debits on all accounts will always be equal; in other words,
the balance of payments always balances. This will become apparent in the
following discussion. Let us consider some of the popular summary mea-
sures of the balance of payments. CURRENT ACCOUNT
The current account deals primarily with trade in goods and services, and is
defined as including the value of trade in merchandise services primary
defined as including the value of trade in merchandise, services, primary
income, and secondary income. Merchandise is the export and import in
tangible commodities. The services category refers to trade in the services
of factors of production: land, labor, and capital. Included in this category
are travel, tourism, royalties, transportation costs, and insurance premiums. 62
International Money and Finance
The primary income account (formerly known as investment income) reflects
investment income and compensation to employees. The payment for the that s e a rv e i c t e r s a no sff e c r a r pi e t d a i l, n or n t e h e di r r e e t c u ti r on ,o n e. g i.n , ve U st S m f e orn e tis, g i n s ariec d, o g ride fts d , a a ns i d n r v e e ti srtm e- ent me i n n t co pem n e si . o T n h s. e T a h m e ou U n ni tse o d f Stin at teesr e ust u a aln l d y rdi e v c i o de r n ds ds a lapa rg id e in deftie c rin t at o i no n t a h l elsye are ite l m a s r
. ge and are growing rapidly as the world financial markets become more i Sn uteg m r maite n d. g T u h p et f h ien al deco bi m ts p a o n ne d n c t r eof di ttsh e s hcu o r w r s e n t t h ea cco bal u a n n t c ei s l o a nbe a l esd u se bs ceon c-dary tioni nc o o f m t e h ( e f o i r n m te e r r n lay t i kn on o al w t n r a a n s s a u c n ti il oat n e s r . al T t h ra e nsf baelras) n . cT e hi o s f c pate y g mo e ry nt si n e c nltu r de ies s iit n e ms
Fig. 3.1 actually end at line 29. Lines 30–35 are summaries drawn from
lines 1 to 28. The summaries come from drawing lines in the balance of
payments at different places. A line is drawn in the balance of payments
schedule and then the debit and credit items above such a line are summed.
For example, if we draw a line at the current account balance items ending
with secondary income (line 16) and sum all credit and debit entries above,
this would give us the current account surplus/deficit. A current account
deficit implies that a country is running a net surplus below the line and
that the country is a net borrower from the rest of the world.
Returning to Fig. 3.1, line 30 shows that there was a current account
surplus of $2.3 billion in 1970 and a deficit of $484.1 billion in 2015. The
$484.1 billion current account deficit of 2015 is the sum of a $759.3 bil-
lion merchandise trade deficit, a $219.6 billion services surplus, a $191.3
billion primary income surplus, and a $135.6 billion secondary income
deficit. In 1970, the United States ran a merchandise trade surplus of $2.6
billion. Following a $2 billion deficit in 1971, the merchandise account
has been in deficit every year since, except 1973 and 1975.
Fig. 3.2 illustrates how the current account has changed over time. The
current account is shown as a fraction of GDP, to control for inflation and
the growth of the US economy over the time period. The current account 2% 1% 1% 0% 0 5 0 5 0 5 0 5 0 5 0 5 6 6 7 7 8 8 9 9 0 0 1 1 – 1% 9 9 9 9 9 9 9 9 0 0 0 0 1 1 1 1 1 1 1 1 2 2 2 2 – 2% – 3% – 4% The Balance of Payments 63 – 5% – 6%
deficit growth of the 1980s was unprecedented at the time, but has since –7%
been dwarfed by the deficits of recent years. The current account deficit
Figure 3.2 Current account as a fraction of GDP. Federal Reserve of St. Louis FRED 2 data-
peaked in 2005–2006 with the current account fraction of GDP exceed- base, authors’ calculation.
ing 6%, and has settled at 2.5–3.0% in recent years.
The current account excludes financial account transactions—pur-
chases and sales of financial assets. Since the items below the line of the
current account must be equal in value (but opposite in sign) to the cur-
rent account balance, we can see how the current account balance indi-
cates financial activity (below the line) as well as the value of trade in
merchandise, services, primary and secondary income that are recorded
above the line. In a period (year or quarter) during which a current
account deficit is recorded, the country must borrow from abroad an
amount sufficient to finance the deficit.
Since the balance of payments always balances, the massive current
account deficits of recent years are matched by massive financial account
surpluses. This means that foreign investment in US assets, such as securi-
ties, has been at very high levels. Some analysts have expressed concern
over the growing foreign indebtedness of the United States. The end of the chapter reviews the issue.
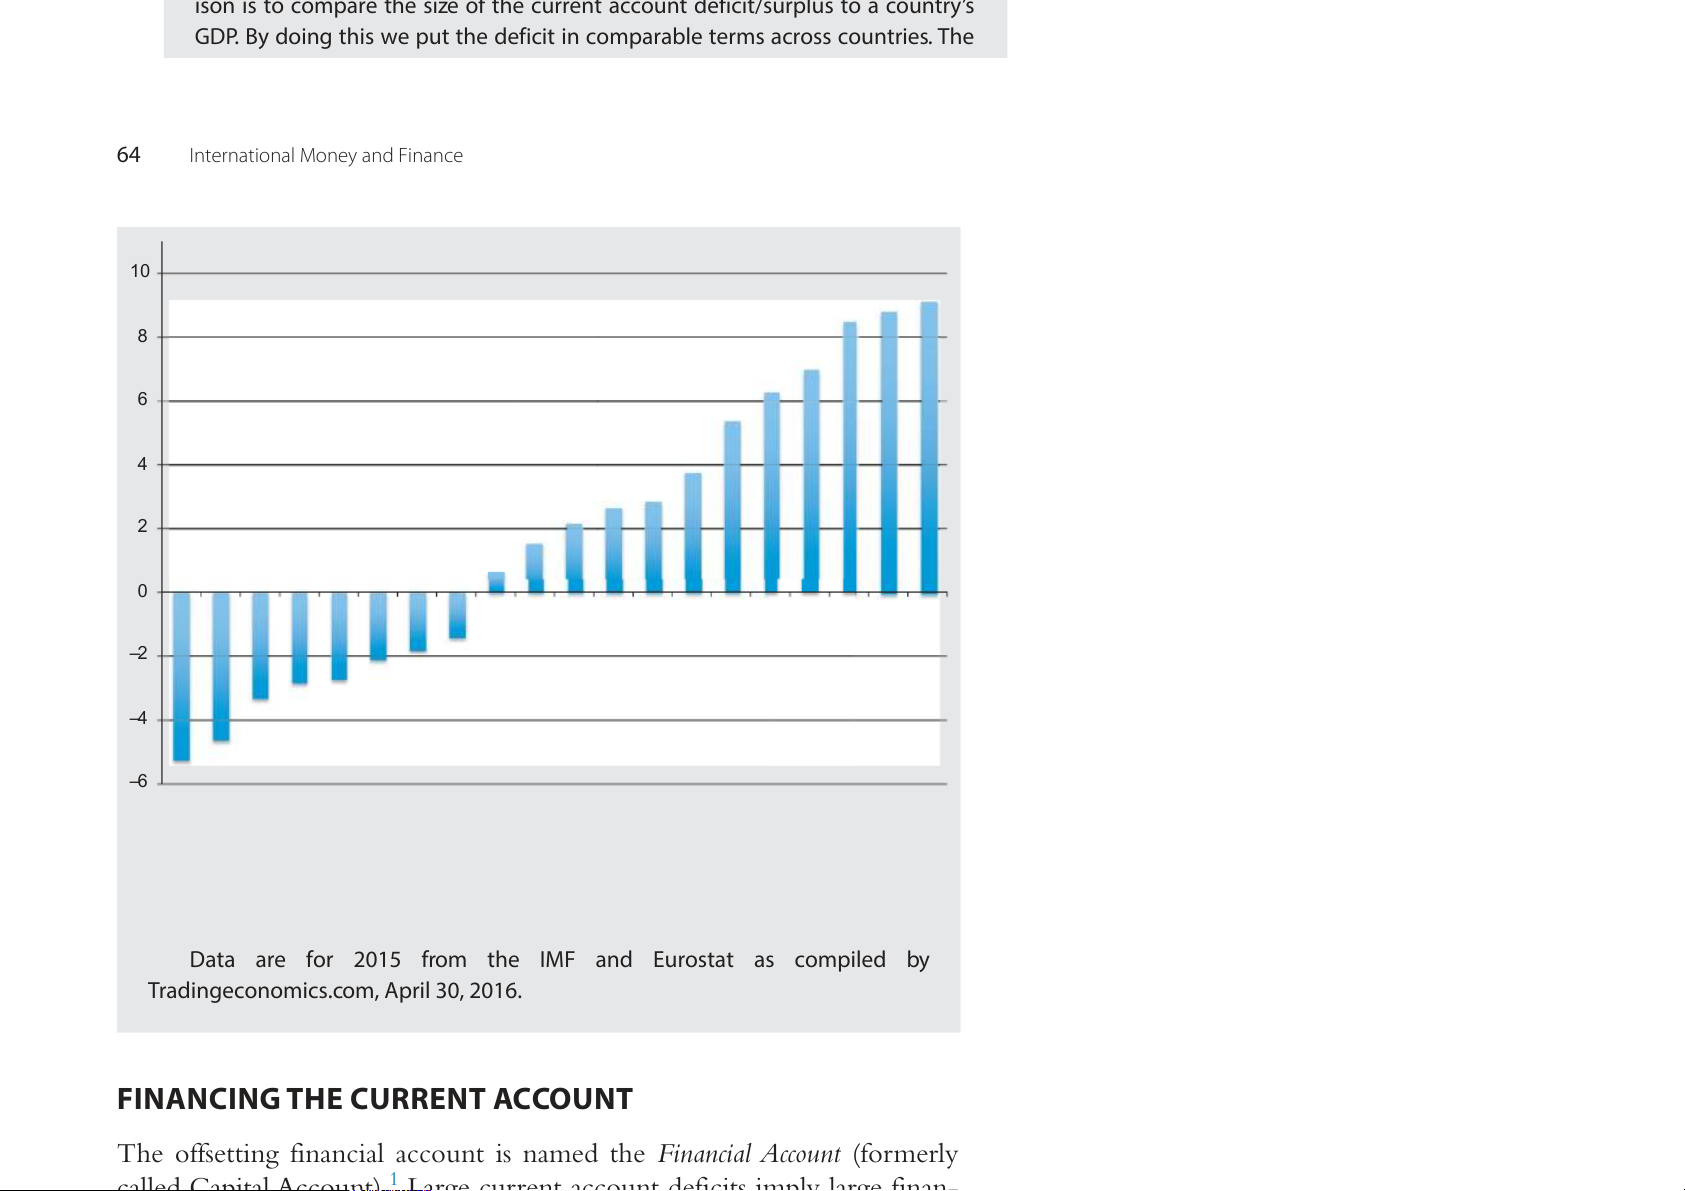
FAQ: How big is the US current account deficit compared to other countries?
The US current account deficit is the largest in the world in absolute size.
However, the dollar amount of the current account deficit can be deceiving,
because the United States is the largest economy in the world. A better compar- i i t th i f th t t d fi it/ l t t ’
ison is to compare the size of the current account deficit/surplus to a country’s
GDP. By doing this we put the deficit in comparable terms across countries. The
following figure shows the current account deficit/surplus for selected coun-
tries in 2015. The figure shows that the United States does not have the largest
current account deficit as a fraction of GDP. The United Kingdom has one of the 64 Ila ntrg er e n s a tti c o ur nal r e M n o tn a e c y c a o n un d Fi t n d a e ncfi
e cits with a 5.2% of GDP. That is almost twice the US
current account deficit. In contrast, some other European countries have very
large current account surpluses. The Netherlands and Germany have gigantic
surpluses due to the weak Euro, and Norway and Sweden also have large sur- 10
pluses. Note that China has a much more reasonable surplus at 2.7%. 8 6 4 2 0 –2 –4 –6 l m il o s a e e a in ly a n d n a d y y s o lia z ic te d c c g a in a n e re n a n d d ra x a e n p Ita h p d o a n g tra n ila rw s B e ta re ra rtu S C a a e K rla o rm rla in a J u M S w e C G F o h S N e e K A d P T itz G th d ite w e S ite n N n U U
Data are for 2015 from the IMF and Eurostat as compiled by
Tradingeconomics.com, April 30, 2016.
FINANCING THE CURRENT ACCOUNT
The offsetting financial account is named the Financial Account (formerly
called Capital Account) 1 Large current account deficits imply large finan-
called Capital Account). Large current account deficits imply large finan-
cial account surpluses. The financial account transactions are recorded
below the current account items in the balance of payments. Referring
back to Fig. 3.1, lines 19–28 record financial account transactions. We
see that financial account transactions include both official and private transactions.
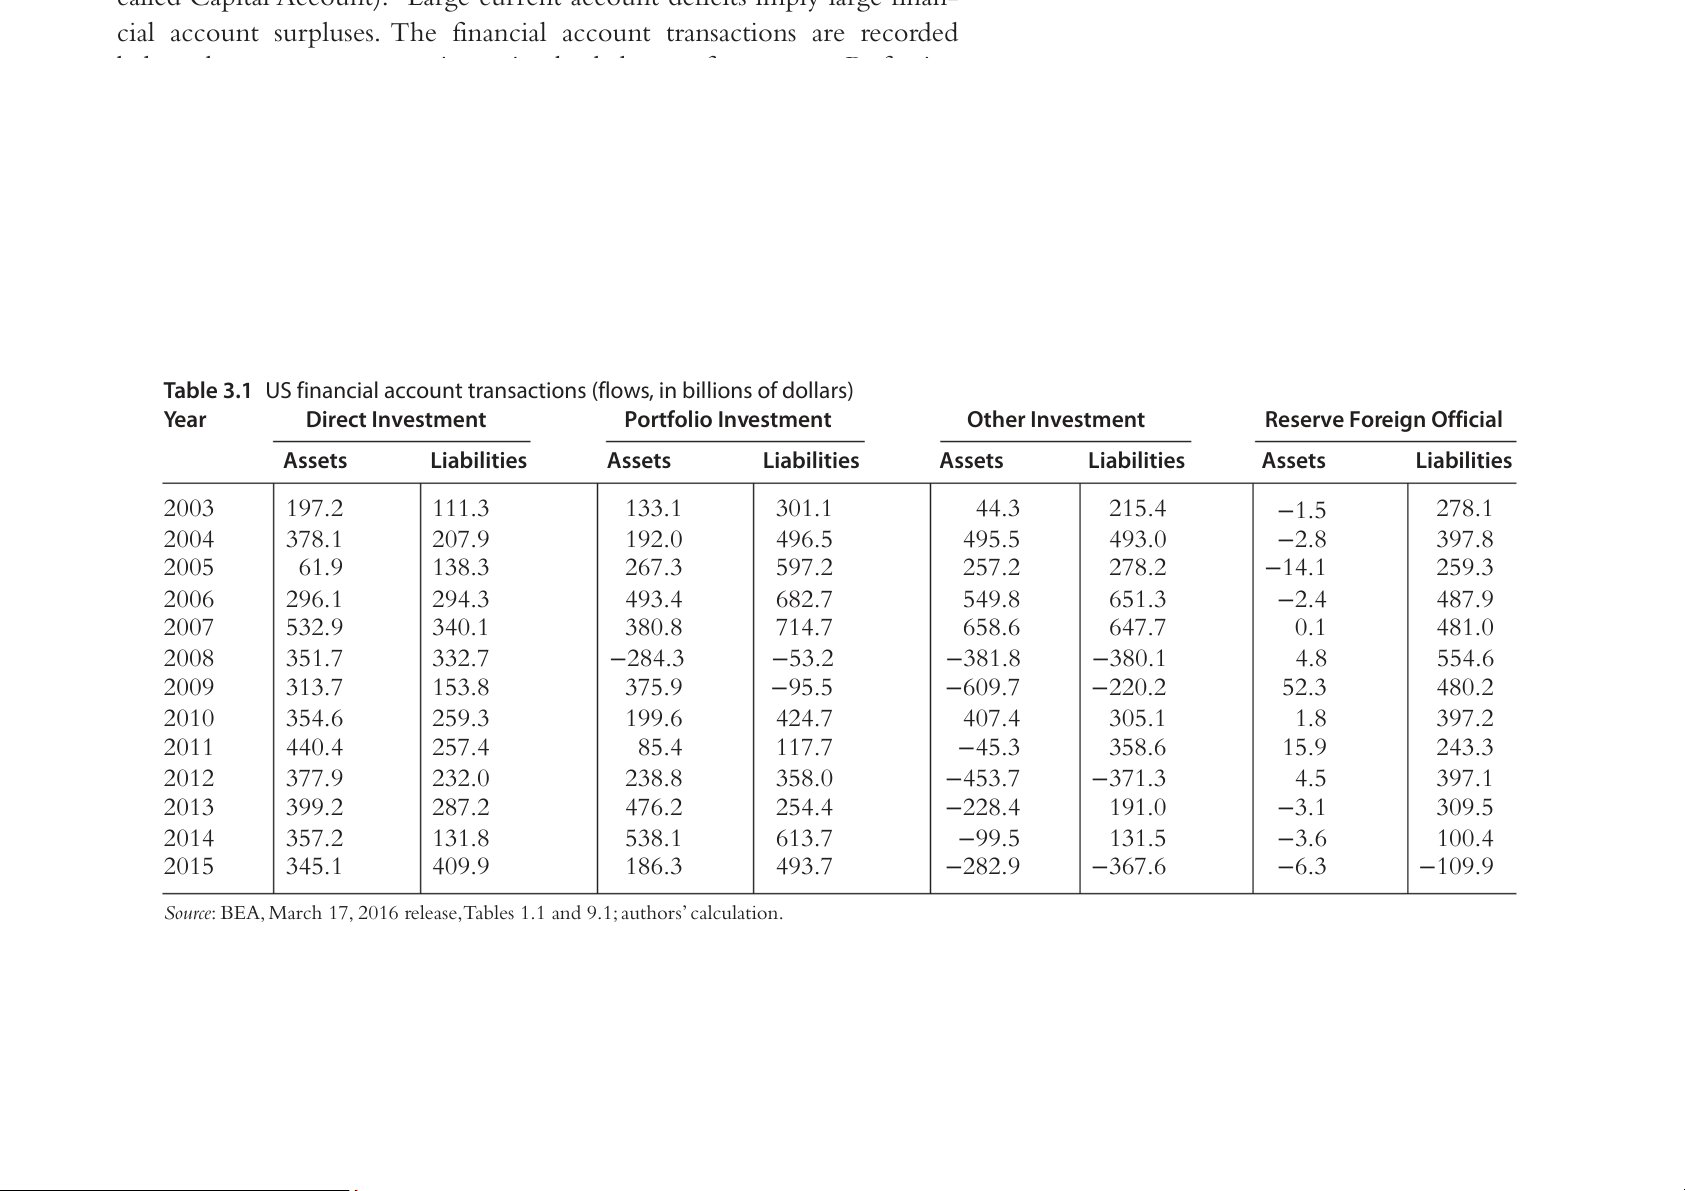
For ease of understanding, Table 3.1 provides a summary of US finan-
cial account transactions from 2003 to 2015. In this table, the debit and
1 Technically the Capital Account still exists, but now refers to transactions not related to
production, such as debt forgiveness and other transfers not related to production. These
transactions were formerly reported in Unilateral Transfers and are fairly minor. Because
of the small amounts we do not include the Capital Account in Fig. 3.1.
Table 3.1 US financial account transactions (flows, in billions of dollars) Year Direct Investment Portfolio Investment Other Investment
Reserve Foreign Official Assets Liabilities Assets Liabilities Assets Liabilities Assets Liabilities 2003 197.2 111.3 133.1 301.1 44.3 215.4 −1.5 278.1 2004 378.1 207.9 192.0 496.5 495.5 493.0 −2.8 397.8 2005 61.9 138.3 267.3 597.2 257.2 278.2 −14.1 259.3 2006 296.1 294.3 493.4 682.7 549.8 651.3 −2.4 487.9 2007 532.9 340.1 380.8 714.7 658.6 647.7 0.1 481.0 2008 351.7 332.7 −284.3 −53.2 −381.8 −380.1 4.8 554.6 2009 313.7 153.8 375.9 −95.5 −609.7 −220.2 52.3 480.2 2010 354.6 259.3 199.6 424.7 407.4 305.1 1.8 397.2 2011 440.4 257.4 85.4 117.7 −45.3 358.6 15.9 243.3 2012 377.9 232.0 238.8 358.0 −453.7 −371.3 4.5 397.1 2013 399.2 287.2 476.2 254.4 −228.4 191.0 −3.1 309.5 2014 357.2 131.8 538.1 613.7 −99.5 131.5 −3.6 100.4 2015 345.1 409.9 186.3 493.7 −282.9 −367.6 −6.3 −109.9
Source: BEA, March 17, 2016 release, Tables 1.1 and 9.1; authors’ calculation. 66
International Money and Finance
credit items are entered separately so that we can identify the sources of
changes in net financial flows (financial inflows less financial outflows).
For instance, in 2015 we see that US private portfolio investment pur-
chases abroad totaled $186.3 billion. This is a financial account debit entry
because it involves foreign exchange leaving the United States. Note that
this corresponds to the line 21 in Fig. 3.1. Table 3.1 indicates that private
portfolio investment purchases in the United States by foreigners totaled
$493.7 billion in 2015. This is a credit item in the financial account since
it brings foreign exchange to the United States. Note that this is differ-
ent from line 26 in Fig. 3.1, because the liabilities in the financial account
include both private and official liabilities. In Table 3.1 the private and
official liabilities have been separated.
Before interpreting the recent history of US international financial
flows, we will consider the definitions of each of the individual financial account items. ●
Direct investment: Private financial transactions that result in the owner-
ship of 10% or more of a business firm. ●
Portfolio investment: Private sector net purchases of equity (stock) and debt securities. ●
Other investment: Currency, deposits, loans, insurance technical reserves, trade credit, and advances. ●
Reserve assets: Changes in US official reserve assets (gold, SDRs, foreign
currency holdings, and reserve position in the IMF). ●
Foreign official liabilities: Net purchases of US government securities,
obligations of US government corporations and agencies, securities of
US state and local governments, and changes in liabilities to foreign
official agencies reported by US banks.
Some financial account transactions are a direct result of trade in mer-
Some financial account transactions are a direct result of trade in mer
chandise and services. For instance, many goods are sold using trade credit.
The exporter allows the importer a period of time—typically 30, 60, or
90 days—before payment is due. This sort of financing will generally be
reflected in other investment assets, because such transactions are handled The Balance of Payments 67
by the exporter’s bank. Portfolio management by international inves-
tors would result in changes to the portfolio investment account. Official transa t c h t ei on U s S i nv di o relv c e t g i o n v vee s r t nm me e n n t ts a a br n o d ada re h a m s o e t xiv c a e t e ed de by d t a h e h o dist r e o c f t e i c n o v n es o t m m i e c n t by and po fo l r ietiic g a n l e c rso n i s n i de th r e a ti U o n n its.
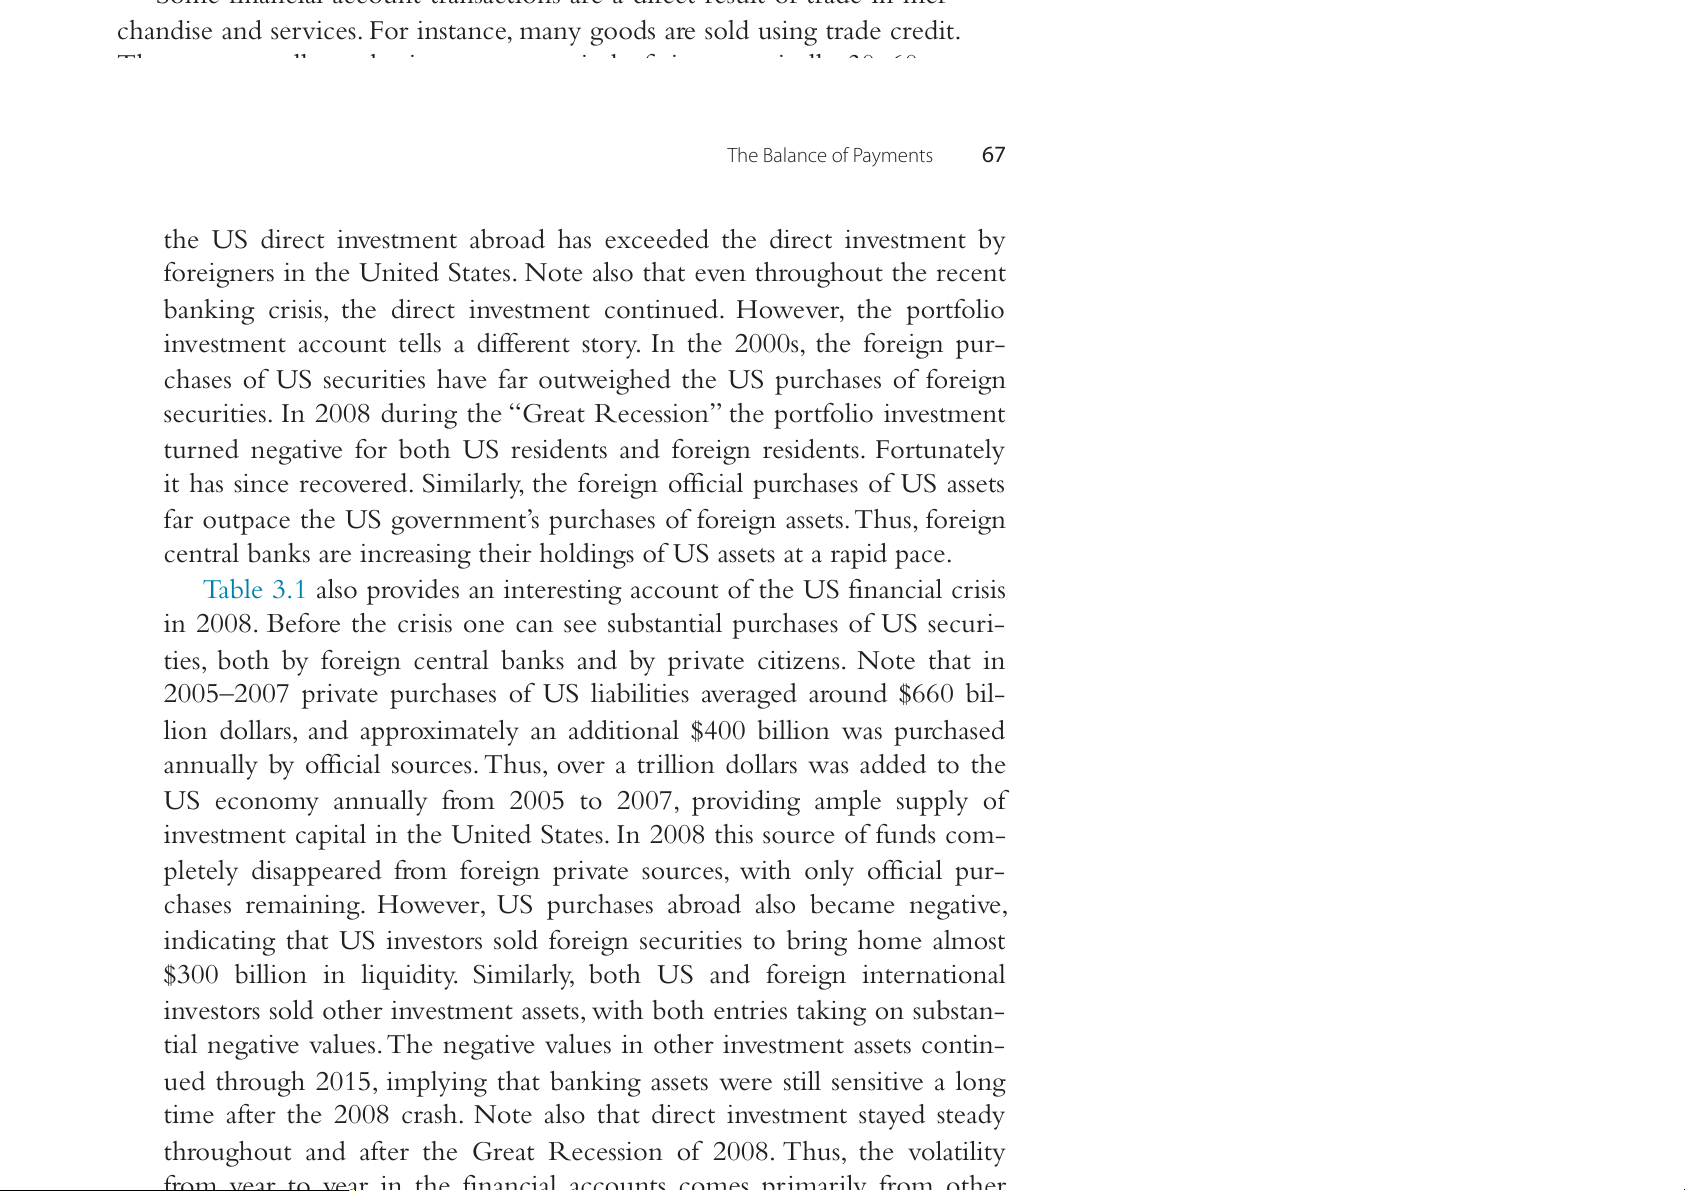
ed States. Note also that even throughout the recent Th bae n re ki c n e g n t c rfiisn isa,n tci h a e l ac di c r o ecu t nit n t vreasn t sa m c e t nio t n c s o a n rte i n v u ery d. in H te o re w st v ien r g , tfr h o e m a po n rt folio econio nm v i e c st v mie e w nt po acin c t o . u In nt g t e eln lse ra a l, o dif n feer ec natn s s t e o e r y.t h I a nt tgl h o e ba 2 l 0iz 0 a 0 tsi,o tn h i e s fe ov r iede ig n n t pur- in the c h sah s a e r s p o ifn c Ure S asse e s c uin ri tt i h ese o h v a e v r afll a rs iz o e u tof w e t i h g e h e tra d n t s h a e c ti Uo S n s. puIrn c m haso e st y ofe afr osr eign
securities. In 2008 during the “Great Recession” the portfolio investment
turned negative for both US residents and foreign residents. Fortunately
it has since recovered. Similarly, the foreign official purchases of US assets
far outpace the US government’s purchases of foreign assets. Thus, foreign
central banks are increasing their holdings of US assets at a rapid pace.
Table 3.1 also provides an interesting account of the US financial crisis
in 2008. Before the crisis one can see substantial purchases of US securi-
ties, both by foreign central banks and by private citizens. Note that in
2005–2007 private purchases of US liabilities averaged around $660 bil-
lion dollars, and approximately an additional $400 billion was purchased
annually by official sources. Thus, over a trillion dollars was added to the
US economy annually from 2005 to 2007, providing ample supply of
investment capital in the United States. In 2008 this source of funds com-
pletely disappeared from foreign private sources, with only official pur-
chases remaining. However, US purchases abroad also became negative,
indicating that US investors sold foreign securities to bring home almost
$300 billion in liquidity. Similarly, both US and foreign international
investors sold other investment assets, with both entries taking on substan-
tial negative values. The negative values in other investment assets contin-
ued through 2015, implying that banking assets were still sensitive a long
time after the 2008 crash. Note also that direct investment stayed steady
throughout and after the Great Recession of 2008. Thus, the volatility
from year to year in the financial accounts comes primarily from other
from year to year in the financial accounts comes primarily from other
investment assets and liabilities.
ADDITIONAL SUMMARY MEASURES 68
International Money and Finance
So far we have focused primarily on the current account of the balance
of payments. In terms of practical importance to economists, government line po 1 l 1i ciy nm a F k i e g. r s 3, .a 1 n ) d rebu co srin ds e sas sfi urms, plu st hi ws h em n ph m a e s r ics h o a n n t di h s e e c e u x rr poe r n tst a e c x c c o e u e n d t is im w po a rtrsr.a n Dte o d. m H est o i w c ev bu e sir, n t eh sse rfe i r ar m e s o a t n he d r l a sum bor m u a n r i y o nm s e oafstu e r ne s u o s f e ba th l ea nc ba e l a o n f c pa e y- of t m ra en de t st ph o e jun sto i m fy en a a. n Wi ee t d htin o th pr e o t c e u ctr rten het acc do o m u e n st ti cc ate magro k r e ite sf, r t ohe m ba fo lra e n i c g e n on co m m e pe r t c it h i a o n n di . se tr Whe a n de a ics oo uft n e t n r y c i i t s e d ru in n n t i h n e g po a l pu ar l g a e r pr ba e lass n ( c be e c ofa u t s r e a it de is r defeipo cit r , ted locao l n i n a m dusto r n ietsh lty h a ba t s a i r s e by be i t nh ge hU u n rt i ted by i St m ate po s r ) t . T cohe m b peatlia t n i c o e n of witlrla d a e r g (l u ien e t h 3 at less
the trade balance reflects the harm done to the economy. Because of the
political sensitivity of the balance of trade, it is a popularly cited measure.
The official settlements balance measures changes in financial assets
held by foreign monetary agencies and official reserve asset transactions.
The official settlements balance serves as a measure of potential foreign
exchange pressure on the dollar, in that official institutions may not want
to hold increasing stocks of dollars but would rather sell them, which
would drive down the foreign exchange value of the dollar. Yet if there is a
demand for the dollar, official stocks of dollars may build without any for-
eign exchange pressure. Furthermore, in the modern world it is not always
clear whether official holdings are what they seem to be, since (as we will
see in a later chapter) the Eurodollar marketallows central banks to turn
official claims against the United States into private claims. Still, mone-
tary economists have found the official settlements account to be useful
because changes in international reserves are one element on which the
nation’s money supply depends.
Because it is hard to distinguish official and private liabilities, the
Bureau of Economic Analysis only reports the combination in Fig. 3.1. In
Table 3.1 the foreign official liabilities have been calculated so that an official
settlements balance can be computed. The official settlements balance in
Table 3.1 is the difference between the last two columns. In the 2000s and
2010s the official settlements balance has been substantially negative, but
the foreign official liabilities have been reduced in 2014 and even turned
the foreign official liabilities have been reduced in 2014 and even turned
negative in 2015, as the dollar strengthened.
The foreign monetary agency holdings of the liabilities of most coun-
tries are trivial, so that the official settlements balance essentially measures
international reserve changes. In the case of the United States, the official The Balance of Payments 69
settlements balance primarily records changes in short-term US liabilities
held by foreign monetary agencies. This demand for dollar-denominated short- T te R rm A N de S bt A C by TI f Oor Nei S g n C Lce A n Str SaIl F ba I n C ks AT Iis O w N h
Sat allows the United States
to finance current account deficits largely with dollars. Other countries
So far we have defined the important summary measures of the balance of
must finance deficits by selling foreign currency, and, as a result, they face a
payments and have developed an understanding of the various categories
greater constraint on their ability to run deficits as they eventually deplete
included in a nation’s international transactions. The actual classification of
their stocks of foreign currency.
transactions is often confusing to those first considering such issues. To aid
in understanding these classification problems, we will analyze six transac-
tions and their placement in a simplified US balance of payments.
First, we must remember that the balance of payments is a balance sheet,
so, at the bottom line, total credits equal total debits. This means that we
use double-entry bookkeeping—every item involves two entries, a credit
and a debit, to the balance sheet. The credits record items leading to inflows
of payments. Such items are associated with a greater demand for domestic
currency or supply of foreign currency to the foreign exchange market. The
debits record items that lead to payments outflows. These are associated with
a greater supply of domestic currency or demand for foreign currency in
the foreign exchange market. Now consider the following six hypothetical
transactions and their corresponding entries in Table 3.2.
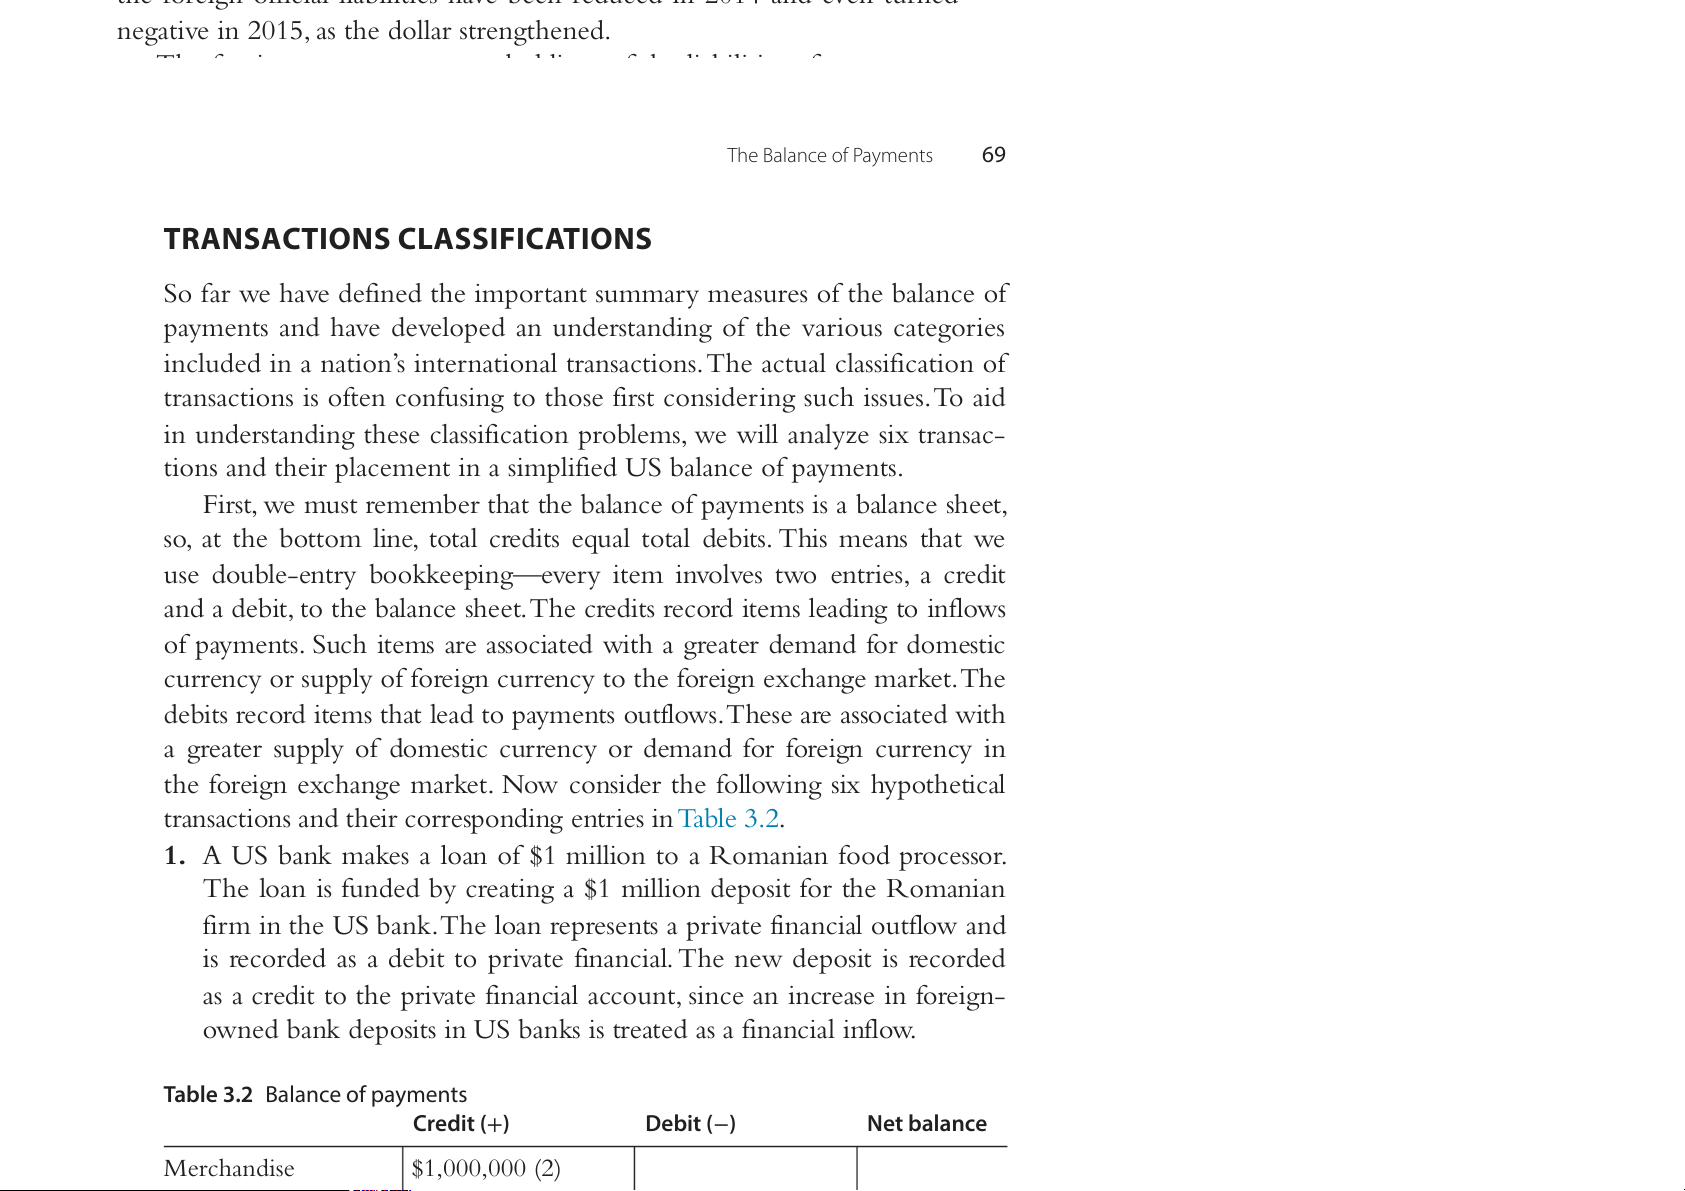
1. A US bank makes a loan of $1 million to a Romanian food processor.
The loan is funded by creating a $1 million deposit for the Romanian
firm in the US bank. The loan represents a private financial outflow and
is recorded as a debit to private financial. The new deposit is recorded
as a credit to the private financial account, since an increase in foreign-
owned bank deposits in US banks is treated as a financial inflow.
Table 3.2 Balance of payments Credit (+) Debit (−) Net balance Merchandise $1,000,000 (2) 100,000 (5) Services $10,000 (4) Primary income 10,000 (3) Secondary income 100,000 (5) Current account $1,000,000 70
International Money and Finance Official financial $50,000,000 (6) $50,000,000 (6) Private financial 1,000,000 (1) 1,000,000 (1) $10,000 (4) 1,000,000 (2)
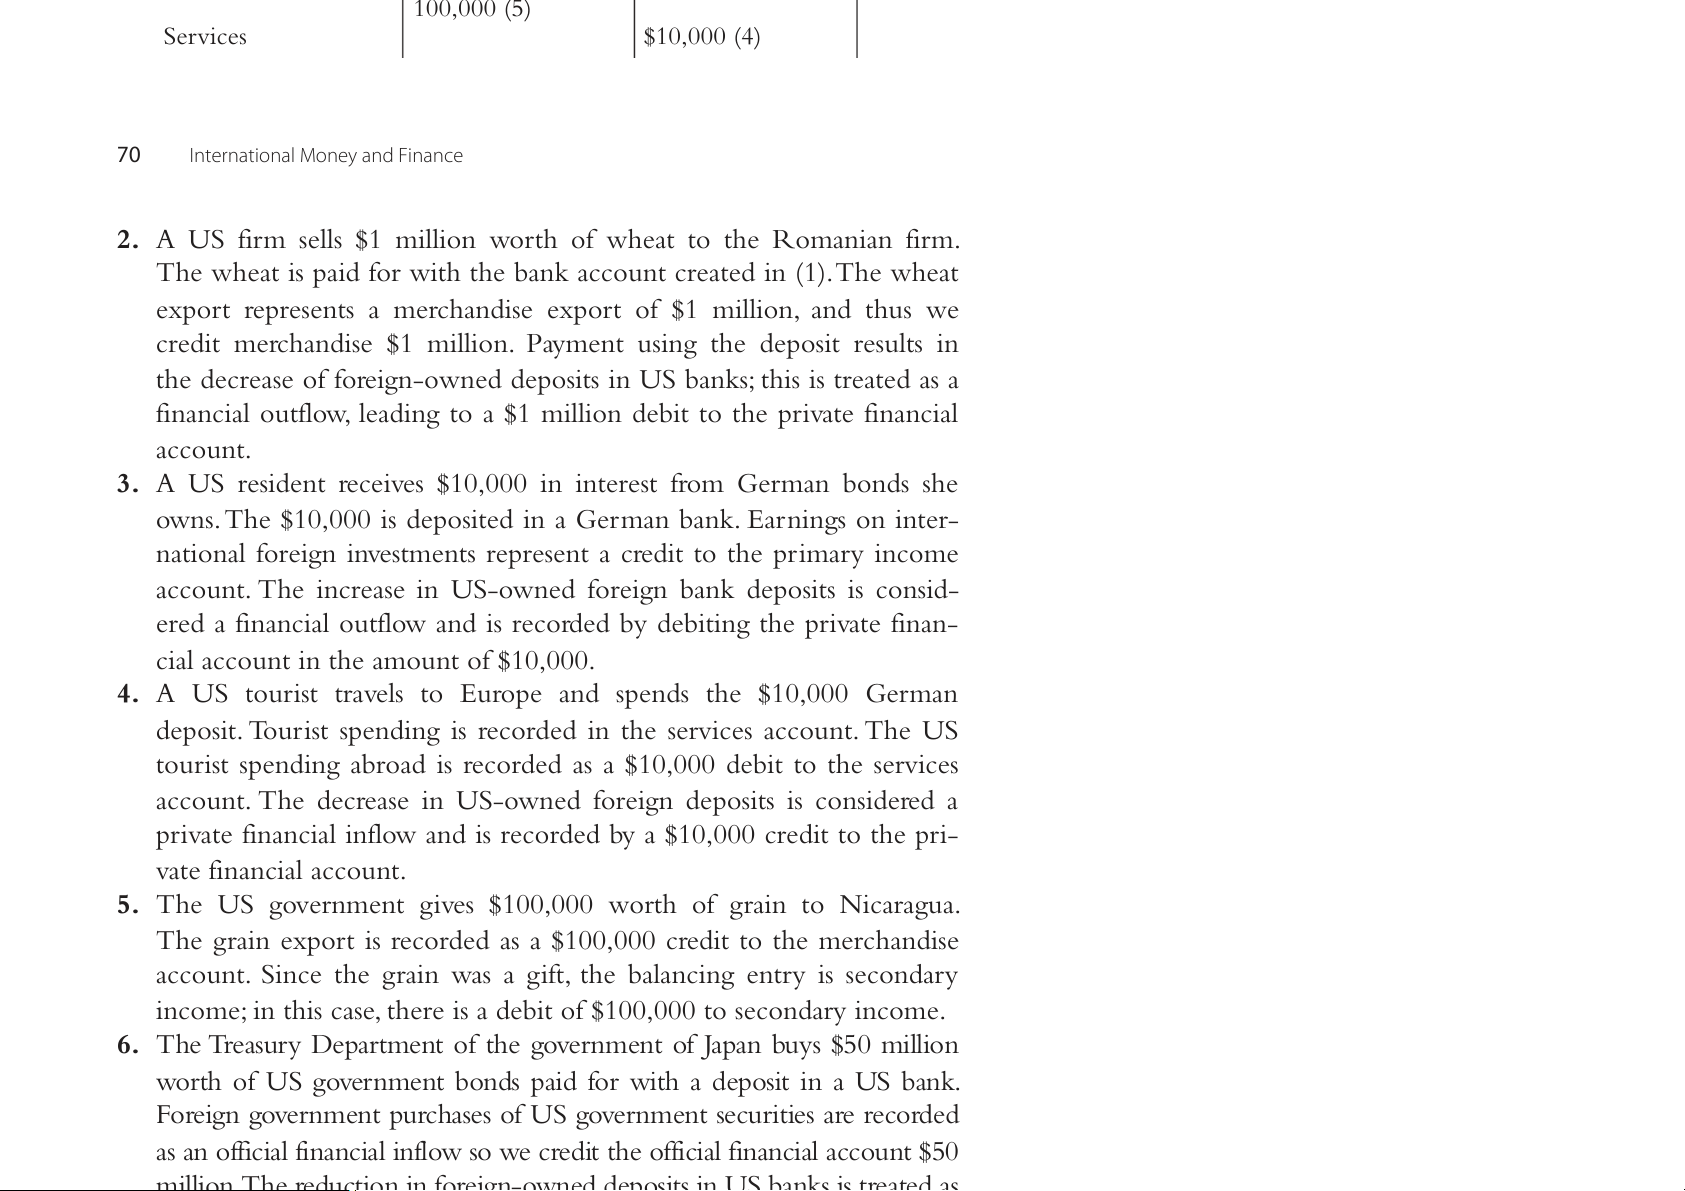
2. A US firm sells $1 million worth of wheat to the Romanian firm. $10,000 (3)
The wheat is paid for with the bank account created in (1). The wheat F e i xnan po c
r ita l ra ecco pru en
s tents a merchandise export of $1 million, and t $ − h 1 u ,s0 00 w , e 0 00 Total $52,120,000 $52,120,000
credit merchandise $1 million. Payment using the deposit results in N thot ee : Th de e c rnu e m as be e rs o fin f pa orre e n i t ghe n s-es o re w fe nr e to d the de six po tsriatnss aict n i ons U w S e bhaav n e a ks n ; atly hziesd. is treated as a
financial outflow, leading to a $1 million debit to the private financial account.
3. A US resident receives $10,000 in interest from German bonds she
owns. The $10,000 is deposited in a German bank. Earnings on inter-
national foreign investments represent a credit to the primary income
account. The increase in US-owned foreign bank deposits is consid-
ered a financial outflow and is recorded by debiting the private finan-
cial account in the amount of $10,000.
4. A US tourist travels to Europe and spends the $10,000 German
deposit. Tourist spending is recorded in the services account. The US
tourist spending abroad is recorded as a $10,000 debit to the services
account. The decrease in US-owned foreign deposits is considered a
private financial inflow and is recorded by a $10,000 credit to the pri- vate financial account.
5. The US government gives $100,000 worth of grain to Nicaragua.
The grain export is recorded as a $100,000 credit to the merchandise
account. Since the grain was a gift, the balancing entry is secondary
income; in this case, there is a debit of $100,000 to secondary income.
6. The Treasury Department of the government of Japan buys $50 million
worth of US government bonds paid for with a deposit in a US bank.
Foreign government purchases of US government securities are recorded
as an official financial inflow so we credit the official financial account $50
million The reduction in foreign-owned deposits in US banks is treated as
million. The reduction in foreign owned deposits in US banks is treated as
a financial outflow; but, since the deposit was owned by a foreign govern-
ment, there is a $50 million debit to the official financial account.
Note that the current account balance is the sum of the merchandise,
services, primary income and secondary income accounts. Summing the The Balance of Payments 71
credits and debits, we find that the credits sum to $1,110,000, whereas the
debits sum to $110,000, so that there is a positive, or credit, balance of $1 mi a l li c o ren di o t n t ot h t e h ec ur pr r i e v n at te afc i c n o a u n n ci t
a .l account of the United States. This may seem Th c e o n f f i un s a i n n c g ia b l e e c n a t u r s i e e s e aarrle y tiy n p tic h a e l ly c h tahe pt e m r io t st w c a o s n s f uu g si g n e g st , e pa d trt h ic at u l c a r r e ly di t t h ito e se m s are relatin it g e t m o s tch ha a t n g breis n i g n f b ora en i k gn de e po xc s h i a ts n . g F e o i r n t in o st a an c c o e u , n t t h r e y, th w i h r i d le tra de ns bi a t citieon m s w i e n volve analyfze ord ei r g e nc or e de xc d h a t nh g e de le po avi si n t g otf h $ e 1 0 c ,0 o 0 u 0 nt r in y. a B G ut er nm ei a t n h e b r an o k f tas h e a s e de t bi ra t n s t ao c tions the pr af i f v e a c tte f d in baan n c k ial de ac po c si o tsu int t o h f e th U e n it U edn i Stead tesS , tat jusets .f T or h eie g nfo u de rt p h o si tr s a . n Tsa h c e t i ko e n y is to recorde thi d n t k he of U th S e to de u p ri o s s t i ’ t s s ofpe $ n 1 d 0 i,n 0 g 0 0o f i n t h a e $ G 1 er0, m0 a 0 n0 G ba e n r k m a a s n m ba onn e k y d t e h po at s h it a a d sc ome
from a US bank account. Increases in US-owned deposits in foreign banks
are debits whether or not the money was ever in the United States. What
matters is not whether the money is ever physically in the United States, but
the country of residence of the owner. Similarly, decreases in US-owned for-
eign deposits are recorded as a credit to private financial, whether or not the
money is actually brought from abroad to the United States.
The item called “statistical discrepancy” (line 29) in Fig. 3.1 is not the
result of not knowing where to classify some transactions. The interna-
tional transactions that are recorded are simply difficult to measure accu-
rately. Taking the numbers from customs records and surveys of business
firms will not capture all of the trade actually occurring. Some of this
may be due to illegal or underground activity, but in the modern dynamic
economy we would expect sizable measurement errors even with no ille-
gal activity. It is simply impossible to observe every transaction, so we must
rely on a statistically valid sampling of international transactions.
CURRENT ACCOUNT DISEQUILIBRIA
So far in this chapter we have studied the accounting procedures and defi-
nitions of the balance of payments. Now we want to consider the reasons
for why a country would be in a current account surplus or deficit. Using i l i d d i (NIPA) h
some national income and product accounting (NIPA), we can see what
must be true about the domestic economy for the country to be in a cur-
rent account deficit or surplus.
Let us derive a relationship between the current account and domestic
variables. Starting with the definition of GDP: 72
International Money and Finance Y = C + I + G + (X − M) wh w er h e eSr eis Y t his e G prD iv P a, tC e sias vionugr ado n m d e T satric e c t o h n e stu a m xe pt s io pai n, d. I T is h eo u n r a tido onm al e ist n ic c o pr m iev ate rela itn i v o e n ssthm i e p n sat,y sG t hisa tt h i e n g di o vi ve duranlsm e w n il tl’ ss co pe n n su d t m h pt eir i oen a ,r X nin igss o Yu ro e n xcpo onrsts u , a m nd p- M tioni s a o n u d rt aim xe po s, art n s. d O sa u ver tchuer rre e nt m aaic n co de u
r. nt is then the net exports, (X − M), in th N e o a w,bo sevte t rheela ttio w n o sh e ip qu . aA ti dd ons t h e e n quaalt ito o n a e la i c n h c o otm h e e rr e a lnati d o c n a s n h c iep: l out the C,
and after some rearranging you will be left with: Y = C + S + T
(S − I) + (T − G) = (X − M)
In other words, the current account balance depends on the private
saving/investment relationship, (S − I), and the government’s fiscal sur-
plus/deficit, (T − G). A current account deficit could come from a fiscal
deficit and/or that private investment exceeding private saving, whereas
a current account surplus implies a fiscal surplus and/or private saving
exceeding private investment. We will look at (S − I) and (T − G) in the
case of the US current account deficit.
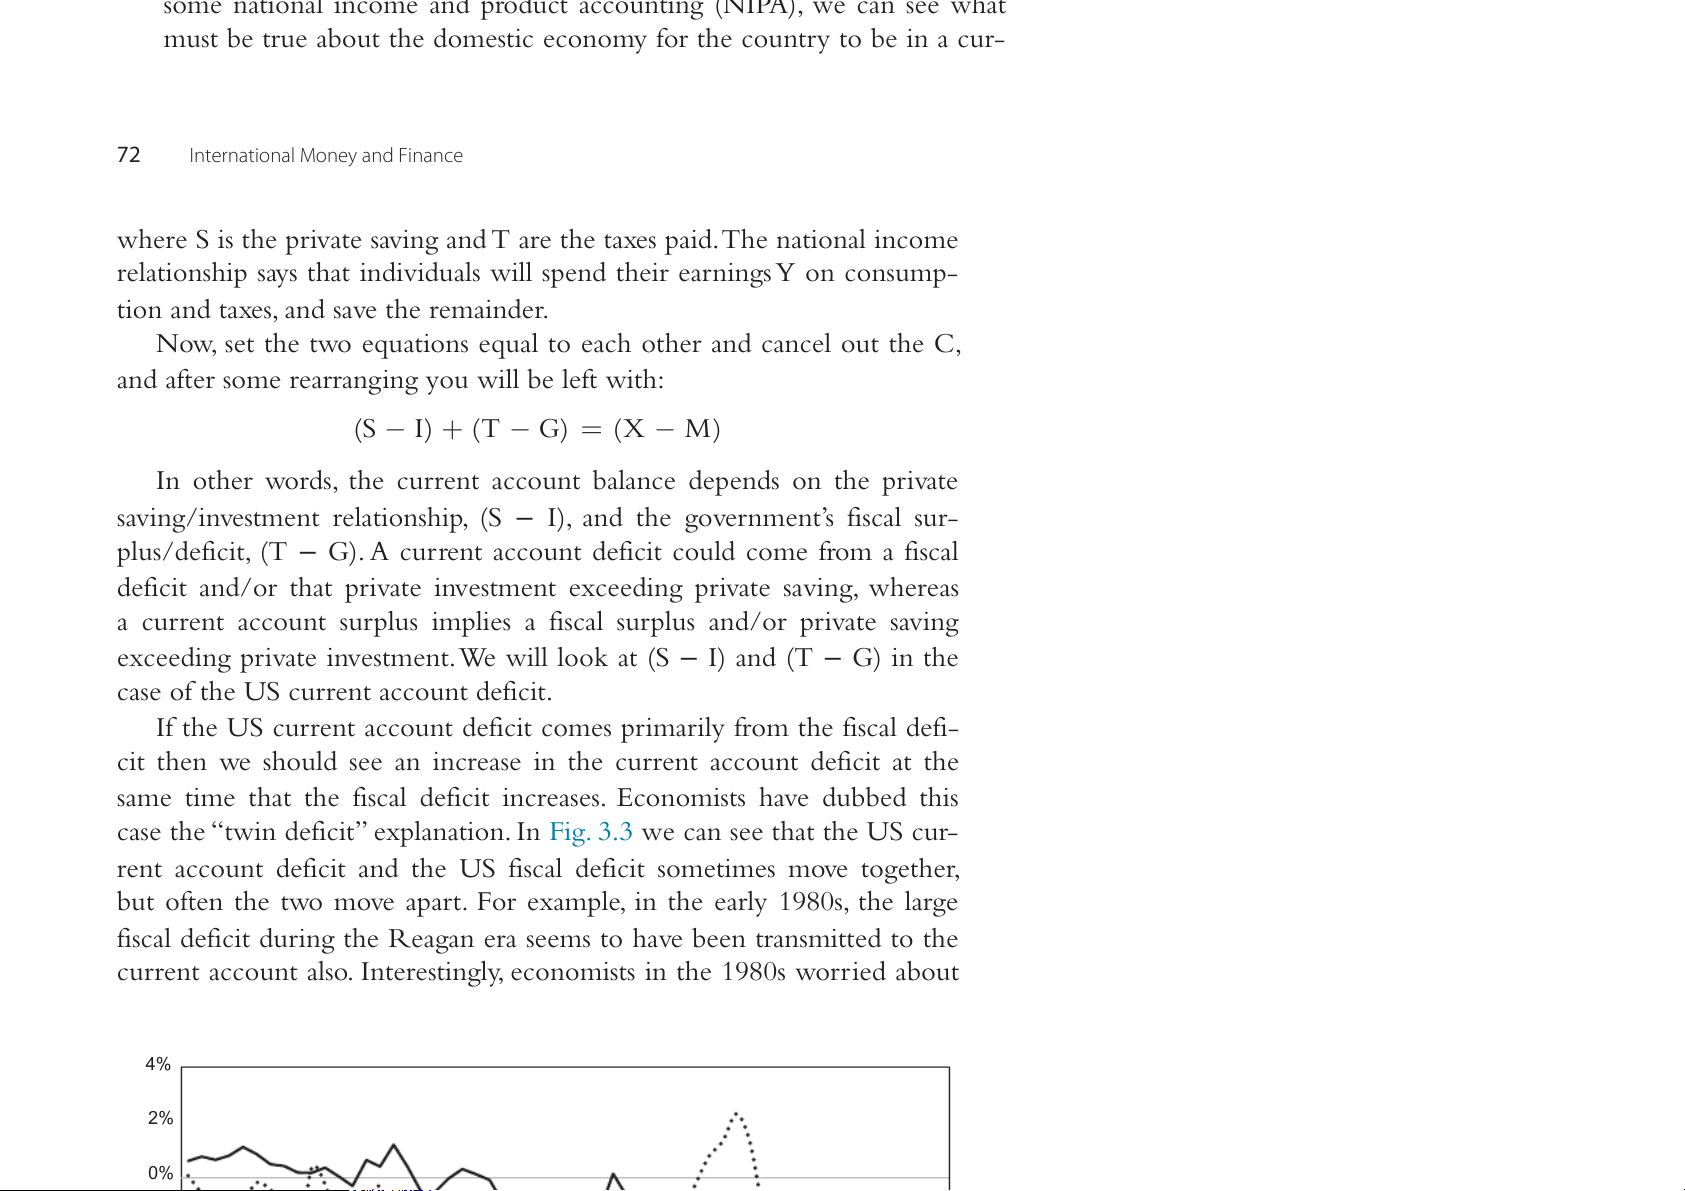
If the US current account deficit comes primarily from the fiscal defi-
cit then we should see an increase in the current account deficit at the
same time that the fiscal deficit increases. Economists have dubbed this
case the “twin deficit” explanation. In Fig. 3.3 we can see that the US cur-
rent account deficit and the US fiscal deficit sometimes move together,
but often the two move apart. For example, in the early 1980s, the large
fiscal deficit during the Reagan era seems to have been transmitted to the
current account also. Interestingly, economists in the 1980s worried about 4% 2% 0% 0 5 0 5 0 5 0 5 0 5 0 5 6 6 7 7 8 8 9 9 0 0 1 1 6 6 7 7 8 8 9 9 0 0 1 1 9 9 9 9 9 9 9 9 0 0 0 0 1 1 1 1 1 1 1 1 2 2 2 2 –2% –4% –6% The Balance of Payments 73
Current account as a fraction of –8% GDP
Fiscal surplus as a fraction of GDP
the US current account deficits as unsustainable. However, as we can see
–10%the United States has continued to grow with even larger current account
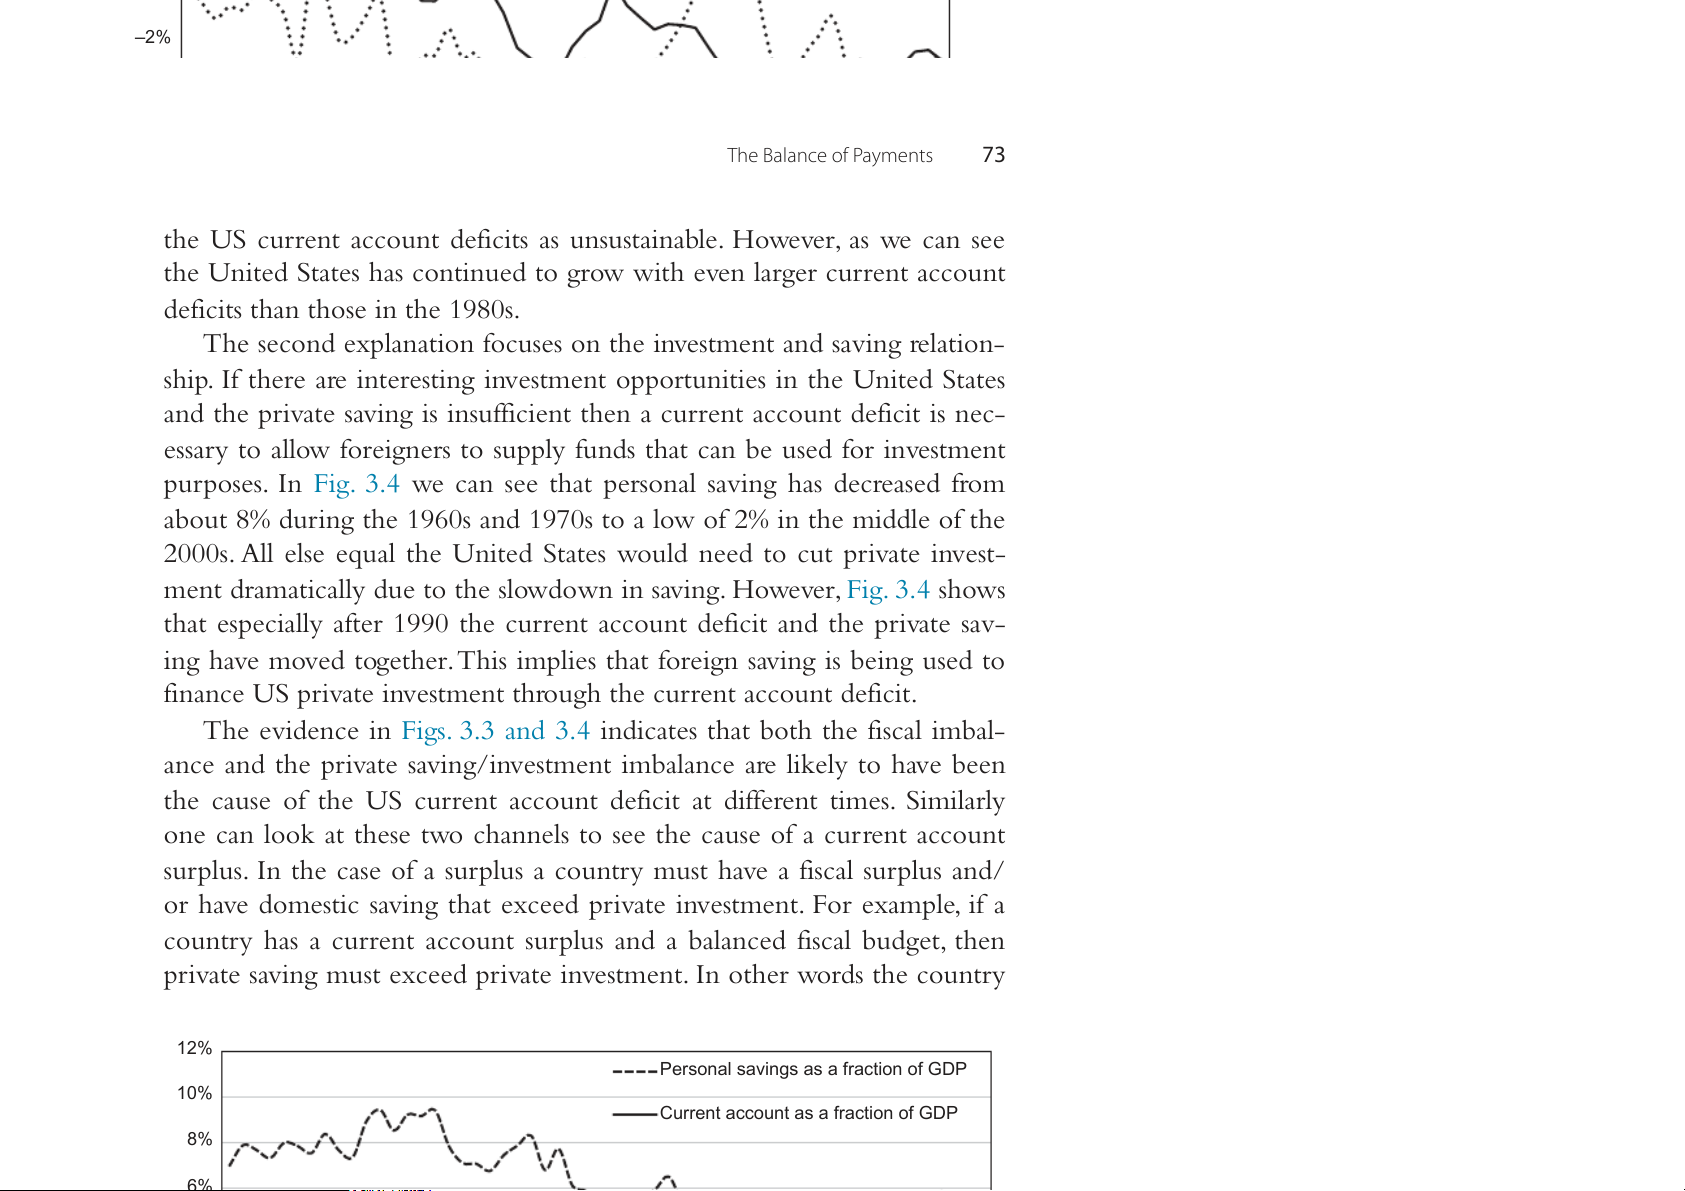
–12%deficits than those in the 1980s. Figure 3.3 T C h ur e sre e n c to a n cc d o e un x t pla annadti f o is n c afl o s c ur us pelsu so/d n e tfic h iet i ans v a es tfra m cetinotn a o n f d G s D avPi. nFed g r er el aalt ion- Reserv s e h o i f p .S tI. fL o t u h is e rFeR E a D r e2 ida ntta e b r a es ste i , nau g tiho nvrs e ’ sctalc m u e la nt t io o n.
pportunities in the United States
and the private saving is insufficient then a current account deficit is nec-
essary to allow foreigners to supply funds that can be used for investment
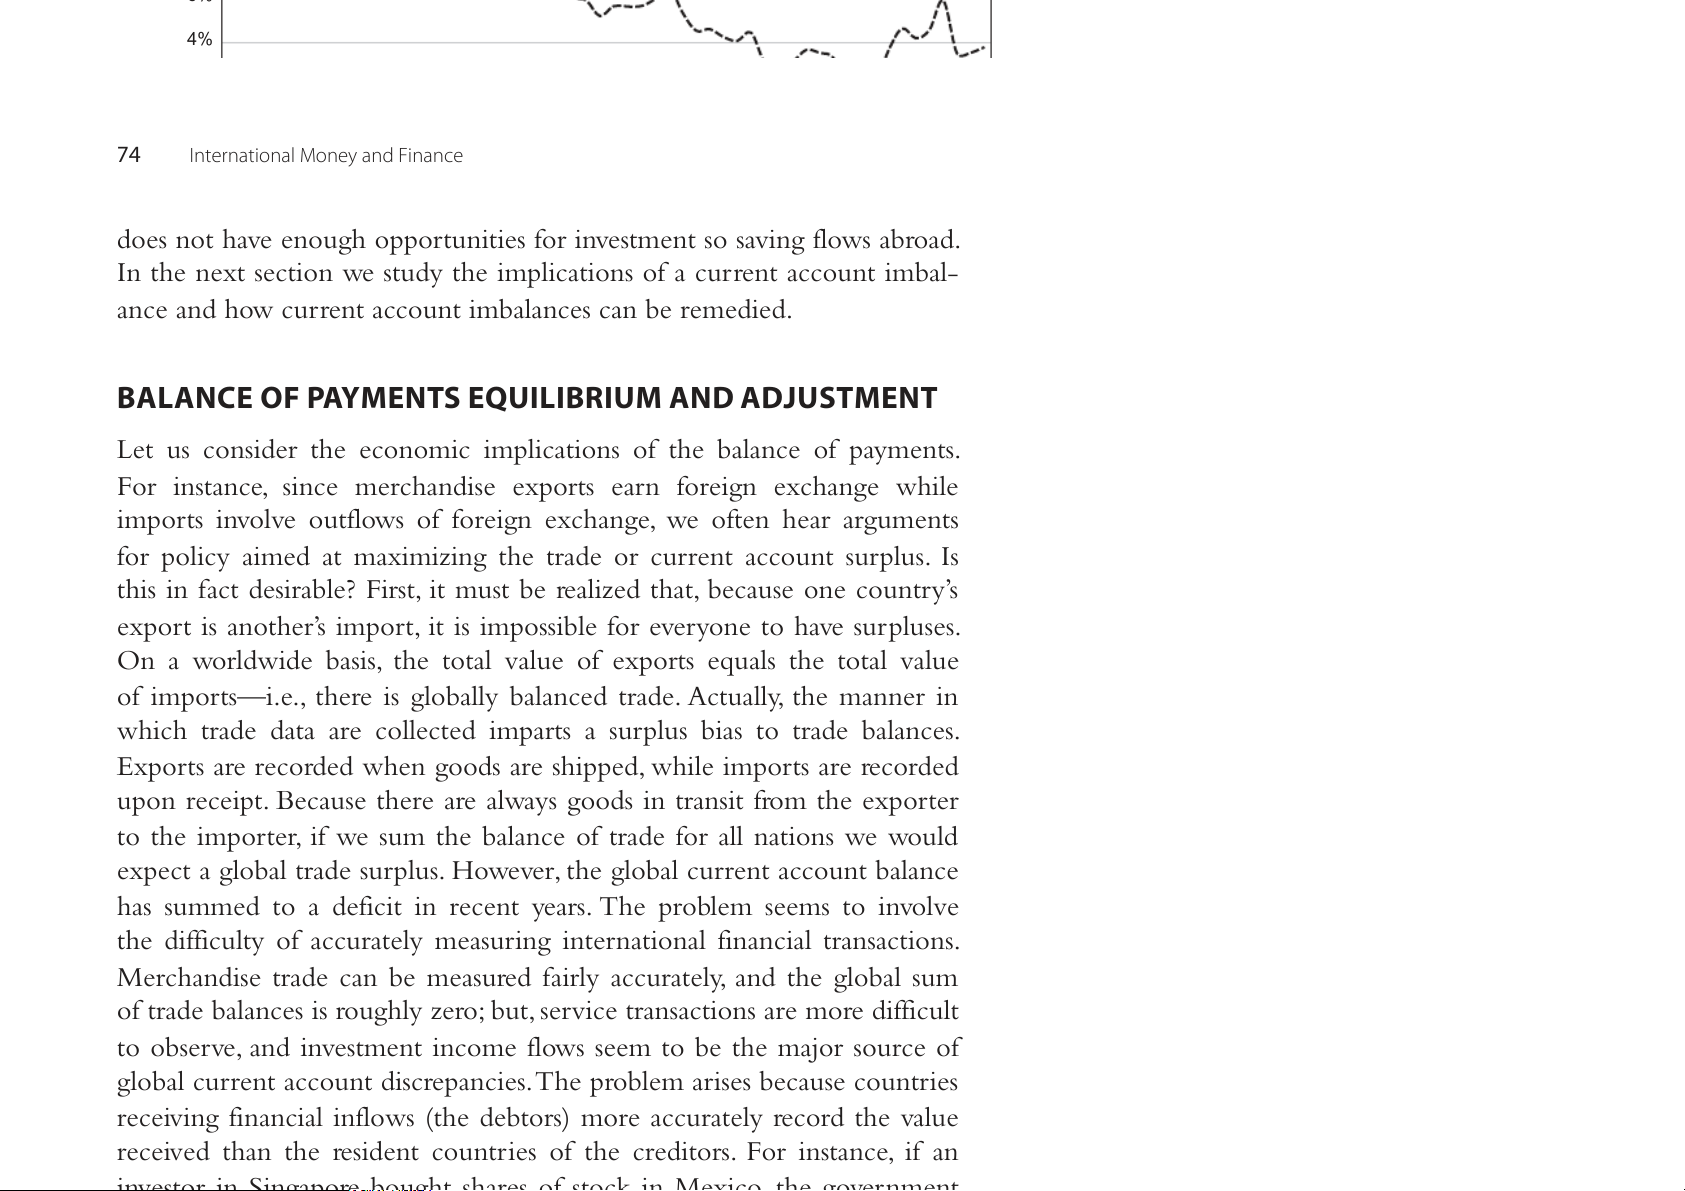
purposes. In Fig. 3.4 we can see that personal saving has decreased from
about 8% during the 1960s and 1970s to a low of 2% in the middle of the
2000s. All else equal the United States would need to cut private invest-
ment dramatically due to the slowdown in saving. However, Fig. 3.4 shows
that especially after 1990 the current account deficit and the private sav-
ing have moved together. This implies that foreign saving is being used to
finance US private investment through the current account deficit.
The evidence in Figs. 3.3 and 3.4 indicates that both the fiscal imbal-
ance and the private saving/investment imbalance are likely to have been
the cause of the US current account deficit at different times. Similarly
one can look at these two channels to see the cause of a current account
surplus. In the case of a surplus a country must have a fiscal surplus and/
or have domestic saving that exceed private investment. For example, if a
country has a current account surplus and a balanced fiscal budget, then
private saving must exceed private investment. In other words the country 12%
Personal savings as a fraction of GDP 10%
Current account as a fraction of GDP 8% 6% 6% 4% 2% 0% 0 5 0 5 0 5 0 5 0 5 0 5 6 6 7 7 8 8 9 9 0 0 1 1 74
Inter 9national 9Money a9nd Fina 9nce 9 9 9 9 0 0 0 0 1 1 1 1 1 1 1 1 2 2 2 2 –2% –4%
does not have enough opportunities for investment so saving flows abroad. –6%
In the next section we study the implications of a current account imbal- ance –8 a %
nd how current account imbalances can be remedied.
Figure 3.4 Current account and saving as a fraction of GDP. Federal Reserve of St. Louis
FRED 2 database, authors’ calculation.
BALANCE OF PAYMENTS EQUILIBRIUM AND ADJUSTMENT
Let us consider the economic implications of the balance of payments.
For instance, since merchandise exports earn foreign exchange while
imports involve outflows of foreign exchange, we often hear arguments
for policy aimed at maximizing the trade or current account surplus. Is
this in fact desirable? First, it must be realized that, because one country’s
export is another’s import, it is impossible for everyone to have surpluses.
On a worldwide basis, the total value of exports equals the total value
of imports—i.e., there is globally balanced trade. Actually, the manner in
which trade data are collected imparts a surplus bias to trade balances.
Exports are recorded when goods are shipped, while imports are recorded
upon receipt. Because there are always goods in transit from the exporter
to the importer, if we sum the balance of trade for all nations we would
expect a global trade surplus. However, the global current account balance
has summed to a deficit in recent years. The problem seems to involve
the difficulty of accurately measuring international financial transactions.
Merchandise trade can be measured fairly accurately, and the global sum
of trade balances is roughly zero; but, service transactions are more difficult
to observe, and investment income flows seem to be the major source of
global current account discrepancies. The problem arises because countries
receiving financial inflows (the debtors) more accurately record the value
received than the resident countries of the creditors. For instance, if an
investor in Singapore bought shares of stock in Mexico the government
investor in Singapore bought shares of stock in Mexico, the government
of Mexico is more likely to observe accurately the transaction than is the
government of Singapore. Yet even with these bookkeeping problems fac-
ing government statisticians, the essential economic point of one country’s
deficit being another’s surplus is still true. The Balance of Payments 75
Since one country must always have a trade deficit if another has a
trade surplus, is it necessarily true that surpluses are good and deficits bad and tfh r a e t e o i n nte rco nau tin otr n y a lbe tr n a ef de i ts a ra e t an m o or teh er f ’fsi ceix e pe nt ns pre? o In duc to i n o e n s a e nns d ei, nit c rw eao s u e ld d con- seems t uha m t i pt m io po n. r I ts m sh po o rtu s l d allbe o wpr c e ofe u r nrte r d ie tso t e o xrpo eal ritzs. e In a t h e i r g m he sr o li f v c i u n r g r e stn a t n co da n r - d than sumpt t i h o e n y , c m o e ul rc d h ba yn di ju s s e t e haxvpo in r g t s d r o epr me e stsiecn t pr g o oo du ds cti t o h n.a t C w hi illl dr be en c h o avn e s um mo e r d e toys by fo a rte ig C n h riism t po masr ter be sc a an us d e i osf n i o m lo porntg s efrr o av m a ila C b hile n a f. or B a do na m na e s st a ic n d co pi nseuamp- pples are tion. rA e s a w dil e y le a a v r ain l a f brlo e m s du teu dy to i ntg r a in de t ern wi a t t h i otn r a o l pitr c a alde c t o h u e no t r riy, e st.h e If be tr n a ef de i ts o bet f ween
nations is voluntary, then it is difficult to argue that deficit countries are
harmed while surplus countries benefit by trade.
In general, it is not obvious whether a country is better or worse off
if it runs payments surpluses rather than deficits. Consider the following
simple example of a world with two countries, A and B. Country A is a
wealthy creditor country that has extended loans to poor country B. In
order for country B to repay these loans, B must run trade surpluses with
A to earn the foreign exchange required for repayment. Would you rather
live in rich country A and experience trade deficits or in poor country B
and experience trade surpluses? Although this is indeed a simplistic exam-
ple, there are real-world analogues of rich creditor countries with trade
deficits and poor debtor nations with trade surpluses. The point here is
that you cannot analyze the balance of payments apart from other eco-
nomic considerations. Deficits are not inherently bad, nor are surpluses necessarily good.
Balance of payments equilibrium is often thought of as a condition in
which exports equal imports or credits equal debits on some particular
subaccount, like the current account or the official settlements account.
In fact, countries can have an equilibrium balance on the current account
that is positive, negative, or zero, depending upon what circumstances are
sustainable over time. For instance, a current account deficit will be the
equilibrium for the United States if the rest of the world wants to accu-
mulate US financial assets This involves a US financial account surplus
mulate US financial assets. This involves a US financial account surplus
as US financial assets are sold to foreign buyers, which will be matched
by a current account deficit. So equilibrium need not be a zero balance.
However, to simplify the next analysis, let us assume that equilibrium is
associated with a zero balance. In this sense, if we had a current account 76
International Money and Finance
equilibrium, then the nation would find its net creditor or debtor posi-
tion unchanging since there is no need for any net financing—the cur- rent a What cc h o a unt ppe e nsx po if rt t hit e e r m e si sa re a ju di st e ba qu lia linc br e i d u b m y ith n et c h u e rre ban l t a a n c c c e ou ofn t i pam y po - rt me i n te s ms —s. a E y qu th il e i br of ifu i m cia lo sn e tth l e e o m f e fi n c tsi al s ba e si tst?l em N e o n w t st ba he s r i es w wio llu ld be m r e esaen r vn e o a c ssh e atn ge loss i e n s f srh o or m t-te defrim ci t fi c n o a u nc t i r a i l e s as a s nets d r h es elrd ve by a cc fo u re m i ug l n at i m on o n b e y ta s r u y r ag pluse n c c o ie u s n - and trie r s.e s I e nrtv e e r a n s a s tiet o s n. aF l orre sm ero vst e c a o ss u e n ts t ri c e o s, m th pris w e o g u o lld d, si I m M ply F s m pec e i a aln dtrh a at wi t n h g erir s gh to s cks (SDof R )i n ( t r er c n a a ll t ifo r n o al m re C se harv ptes r w 2 o , u I l n d te be rn au tin och naaln g Min o g n .etary Arrangements, that
this is a credit issued by the IMF and allocated to countries on the basis
of their level of financial support for the IMF), and foreign exchange. To
simplify matters (although this is essentially the case for most countries),
let us consider foreign exchange alone. The concept of balance of pay-
ments equilibrium is linked to the supply and demand diagram presented
in this Chapter 1 and Chapter 2, International Monetary Arrangements.
In the case of flexible exchange rates, where the exchange rate is determined
by free market supply and demand, balance of payments equilibrium is
restored by the operation of the free market. Therefore, the official settle-
ments account will be zero. In contrast, as we have learned in Chapter2,
International Monetary Arrangements, exchange rates are not always free
to adjust to changing market conditions. With fixed exchange rates, central
banks set exchange rates at a particular level. When the exchange rate is
fixed the dollar can be overvalued or undervalued and the central banks
must now finance the trade imbalance by international reserve flows.
Specifically, in the case of a trade deficit, the Federal Reserve sells foreign
currency for dollars. In this case, the US trade deficit could continue only
as long as the stock of foreign currency lasts and the official settlements
balance will show such an intervention.
Besides these methods of adjusting a balance of payments disequilib-
rium, countries sometimes use direct controls on international trade, such
as government-mandated quotas or prices, to shift the supply and demand
curves and induce balance of payments equilibrium Such policies are
curves and induce balance of payments equilibrium. Such policies are
particularly popular in developing countries where chronic shortages of
international reserves do not permit financing the free-market-determined
trade disequilibrium at the government-supported exchange rate.
The mechanism of adjustment to balance of payments equilibrium The Balance of Payments 77
is one of the most important practical problems in international eco-
nomics. The discussion here is but an introduction; much of the analysis of Ch T apt HEe rs U 1 S 2 F , D O e R t EeIrm G i Nn an D t E s B o
T f the Balance of Trade, 13, The IS–LM–
BP Approach, 14, The Monetary Approach, and 15, Extensions and
One implication of financial account transactions, in Table 3.1, is the net
Challenges to the Monetary Approach, is related to this issue as well.
creditor or debtor status of a nation. A net debtor owes more to the rest of
the world than it is owed, while a net creditor is owed more than it owes.
The United States became a net international debtor in 1986 for the first
time since World War I. The high current account deficits of the 1980s
were matched by high financial account surpluses. This rapid buildup of
foreign direct investment and purchases of US securities led to a rapid
drop in the net creditor position of the United States in 1982 to a net
debtor status by 1986. Ever since the United States has remained a debtor
nation and has gradually increased its debtor position year after year.
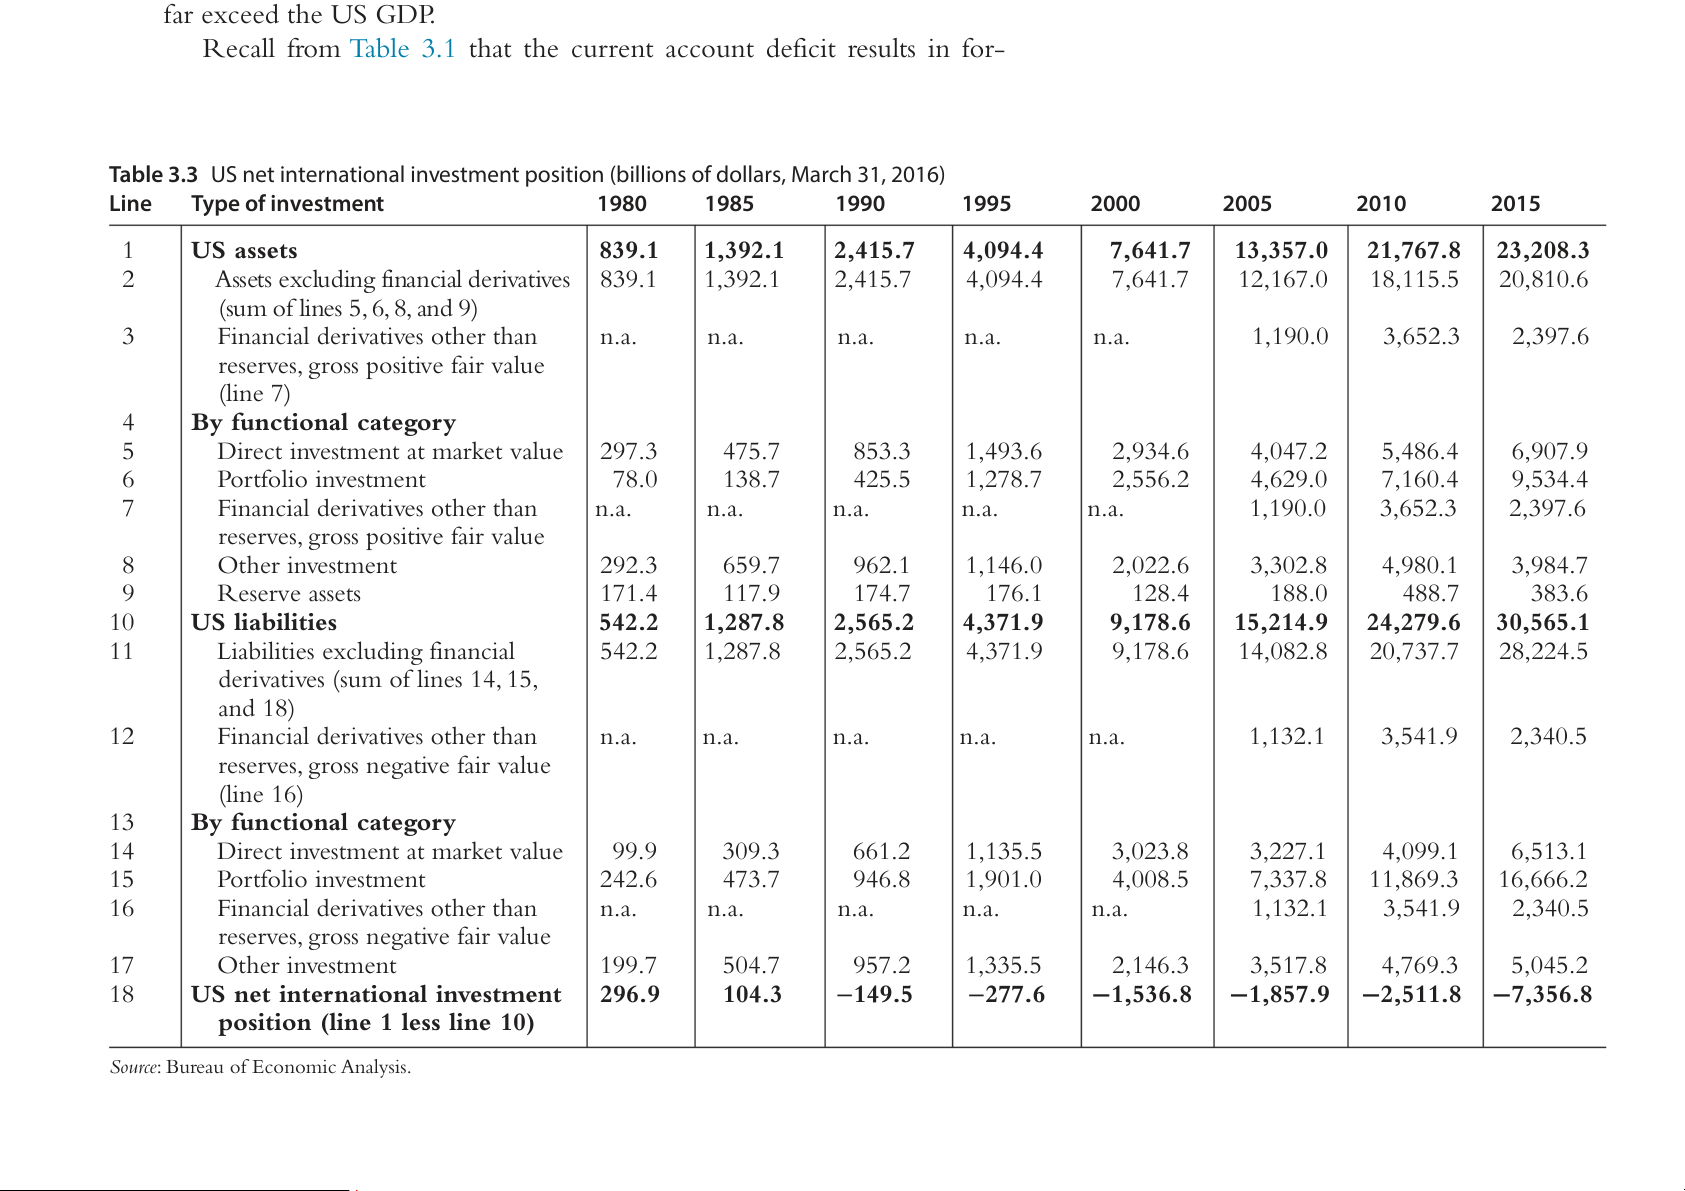
The detailed net international investment position is provided in
Table3.3. One can think of Table 3.3 as a sum of Table 3.1, reflecting the
net position of the United States vis-à-vis the rest of the world at any
given time. In contrast, Table 3.1 provides the flow of goods and service
during a particular year. Line 19 in Table 3.3 provides the cumulative
net investment position for the United States. It shows that the United
States was the largest creditor in the world in the early 1980s, but in the
mid-1980s the net position started to deteriorate, and the United States
became the biggest debtor nation in the world with a net position in the
end of 2015 of −$7,356.8 billion. Thus, foreigners have more than $7 tril-
lion in claims on US assets in excess of the US claims on foreign assets.
The detailed accounts are also of interest. There is an enormous amount
of claims on foreign assets held by US residents. Over $23 trillion worth
of claims on foreign assets are held by US residents, whereas foreigners
hold almost $31 trillion in claims. In comparison, the US GDP is esti-
mated to be around 18 trillion in 2015. So the international asset holdings far exceed the US GDP.
Recall from Table 3.1 that the current account deficit results in for-
eigners adding more claims on US assets. The US net international
investment position is a sum of all the past current account deficits and
surpluses. Thus, the current account is a useful measure because it sum-
Table 3.3 US net international investment position (billions of dollars, March 31, 2016)
marizes the trend with regard to the net debtor position of a country. For Line Type of investment 1980 1985 1990 1995 2000 2005 2010 2015
this reason, international bankers focus on the current account trend as 1 one U o S f athe sse tc
s rucial variables to consider w 839.h 1 en ev 1,aluat 392. i1ng loa 2, ns to 415. 7 foreig 4, n 094.4 7,641.7 13,357.0 21,767.8 23,208.3 2
Assets excluding financial derivatives 839.1 1,392.1 2,415.7 4,094.4 7,641.7 12,167.0 18,115.5 20,810.6 countries. (sum of lines 5, 6, 8, and 9) 3
Financial derivatives other than n.a. n.a. n.a. n.a. n.a. 1,190.0 3,652.3 2,397.6
reserves, gross positive fair value (line 7) 4 By functional category 5
Direct investment at market value 297.3 475.7 853.3 1,493.6 2,934.6 4,047.2 5,486.4 6,907.9 6 Portfolio investment 78.0 138.7 425.5 1,278.7 2,556.2 4,629.0 7,160.4 9,534.4 7
Financial derivatives other than n.a. n.a. n.a. n.a. n.a. 1,190.0 3,652.3 2,397.6
reserves, gross positive fair value 8 Other investment 292.3 659.7 962.1 1,146.0 2,022.6 3,302.8 4,980.1 3,984.7 9 Reserve assets 171.4 117.9 174.7 176.1 128.4 188.0 488.7 383.6 10 US liabilities 542.2 1,287.8 2,565.2 4,371.9 9,178.6 15,214.9 24,279.6 30,565.1 11
Liabilities excluding financial 542.2 1,287.8 2,565.2 4,371.9 9,178.6 14,082.8 20,737.7 28,224.5
derivatives (sum of lines 14, 15, and 18) 12
Financial derivatives other than n.a. n.a. n.a. n.a. n.a. 1,132.1 3,541.9 2,340.5
reserves, gross negative fair value (line 16) 13 By functional category 14
Direct investment at market value 99.9 309.3 661.2 1,135.5 3,023.8 3,227.1 4,099.1 6,513.1 15 Portfolio investment 242.6 473.7 946.8 1,901.0 4,008.5 7,337.8 11,869.3 16,666.2 16
Financial derivatives other than n.a. n.a. n.a. n.a. n.a. 1,132.1 3,541.9 2,340.5
reserves, gross negative fair value 17 Other investment 199.7 504.7 957.2 1,335.5 2,146.3 3,517.8 4,769.3 5,045.2 18
US net international investment 296.9 104.3 −149.5 −277.6 −1,536.8 −1,857.9 −2,511.8 7, − 356.8
position (line 1 less line 10)
Source: Bureau of Economic Analysis.
Tài liệu liên quan:
-

Hoạt động Tài chính của Doanh nghiệp Đa Quốc Gia (DN) - Chương 6 | Tài chính quốc tế | Trường Học Viện nông nghiệp Việt Nam
19 10 -

Hệ Thống Tiền Tệ Quốc Tế: Khái Niệm và Các Chế Độ Tỷ Giá | Tài chính quốc tế | Trường Học Viện nông nghiệp Việt Nam
24 12 -

Bài giảng Chương 1: Các Quan Hệ Cân Bằng Quốc Tế và LOP | Tài chính quốc tế | Trường Học Viện nông nghiệp Việt Nam
21 11 -
Cách Tính Lạm Phát và CPI: So Sánh Việt Nam và Mỹ | Tài chính quốc tế | Trường Học Viện nông nghiệp Việt Nam
23 12 -

Detailed Report and Analysis on Submission Trends | Tài chính quốc tế | Trường Học Viện nông nghiệp Việt Nam
23 12