Eurocurrency Markets and Libor Overview | Tài chính quốc tế | Trường Học Viện nông nghiệp Việt Nam
The foreign exchange market is a market in which monies are traded. Money serves as a means of paying for goods and services, and the foreign exchange market exists to facilitate international payments. Just as there is a need for international money payments, there also is a need for inter- national credit or deposits and loans denominated in different currencies. The international deposit and loan market is often called the Eurocurrency market, and banks that accept these deposits and make loans are often called Eurobanks. Tài liệu được sưu tầm và soạn thảo dưới dạng file PDF để gửi tới các bạn cùng tham khảo, ôn tập đầy đủ kiến thức, chuẩn bị cho các buổi học thật tốt. Mời bạn đọc đón xem!
Môn: Tài chính quốc tế (hvnn) 130 tài liệu
Trường: Học viện Nông nghiệp Việt Nam 2.4 K tài liệu
Tác giả:
Preview text:
CHAPTER 5
Eurocurrency Markets and the LIBOR Contents Reasons for Offshore Banking 106
Interest Rate Spreads and Risk 107
International Banking Facilities 109 Offshore Banking Practices 110 LIBOR 114 The BBA LIBOR 114 LIBOR Rigging 115 The ICE LIBOR 116 Summary 118 Exercises 118 Further Reading 119
The foreign exchange market is a market in which monies are traded.
Money serves as a means of paying for goods and services, and the foreign
exchange market exists to facilitate international payments. Just as there is
a need for international money payments, there also is a need for inter-
national credit or deposits and loans denominated in different currencies.
The international deposit and loan market is often called the Eurocurrency
market, and banks that accept these deposits and make loans are often called Eurobanks.
The use of the prefix Euro, as in Eurocurrency or Eurobank, is mis-
leading, since the activity described is related to offshore banking (provid-
ing foreign currency borrowing and lending services) in general and is in
no way limited to Europe. For instance, the Eurodollar market originally
referred to dollar banking outside the United States. But now a type of
Eurodollar banking also occurs in the United States. The Euroyen market
involves yen-denominated bank deposits and loans outside Japan. Similarly
there are Euroeuros (the name for euro-denominated bank deposits) and
Eurosterling (the name for the UK pound denominated bank deposits). © 201 7 Elsevier Inc.
International Money and Finance. All rights reserved. 105 106
International Money and Finance
The distinguishing feature of the Eurocurrency market is that the cur-
rency used in the banking transaction generally differs from the domestic
currency of the country in which the bank is located. However, this is
not strictly the case, as some international banking activity in domestic
currency may exist. Where such international banking occurs, it is segre-
gated from other domestic currency banking activities in regard to regula-
tions applied to such transactions. As we learn in the next section, offshore
banking activities have grown rapidly because of a lack of regulation,
which allows greater efficiency in providing banking services.
REASONS FOR OFFSHORE BANKING
The Eurodollar market began in the late 1950s. Why and how the mar-
ket originated have been subjects of debate, but there is agreement upon
certain elements. Given the reserve currency status of the dollar, it was
only reasonable that the first external money market to develop would be
for dollars. Some argue that the Communist countries were the source of
early dollar balances held in Europe, since these countries needed dollars
from time to time but did not want to hold these dollars in US banks for
fear of reprisal should hostilities flare up. Thus the dollar deposits in UK
and French banks owned by the Communists would represent the first Eurodollar deposits.
Aside from political considerations, the Eurobanks developed as a result
of profit considerations. Since costly regulations are imposed on US banks,
banks located outside the United States could offer higher interest rates on
deposits and lower interest rates on loans than their US competitors. For
instance, US banks are forced to hold a fraction of their deposits in the
form of noninterest-bearing reserves. Because Eurobanks are essentially
unregulated and hold much smaller reserves than their US counterparts,
they can offer narrower spreads on dollars. The spread is the difference
between the deposit and loan interest rate. Besides lower reserve require-
ments, Eurobanks also benefit from having no government-mandated
interest rate controls, no deposit insurance, no government-mandated
credit allocations, no restrictions on entry of new banks (thus encour-
aging greater competition and efficiency), and low taxes. This does not
mean that the countries hosting the Eurobanks do not use such regula-
tions. What we observe in these countries are two sets of banking rules:
various regulations and restrictions apply to banking in the domestic cur-
rency, whereas offshore banking activities in foreign currencies go largely unregulated.
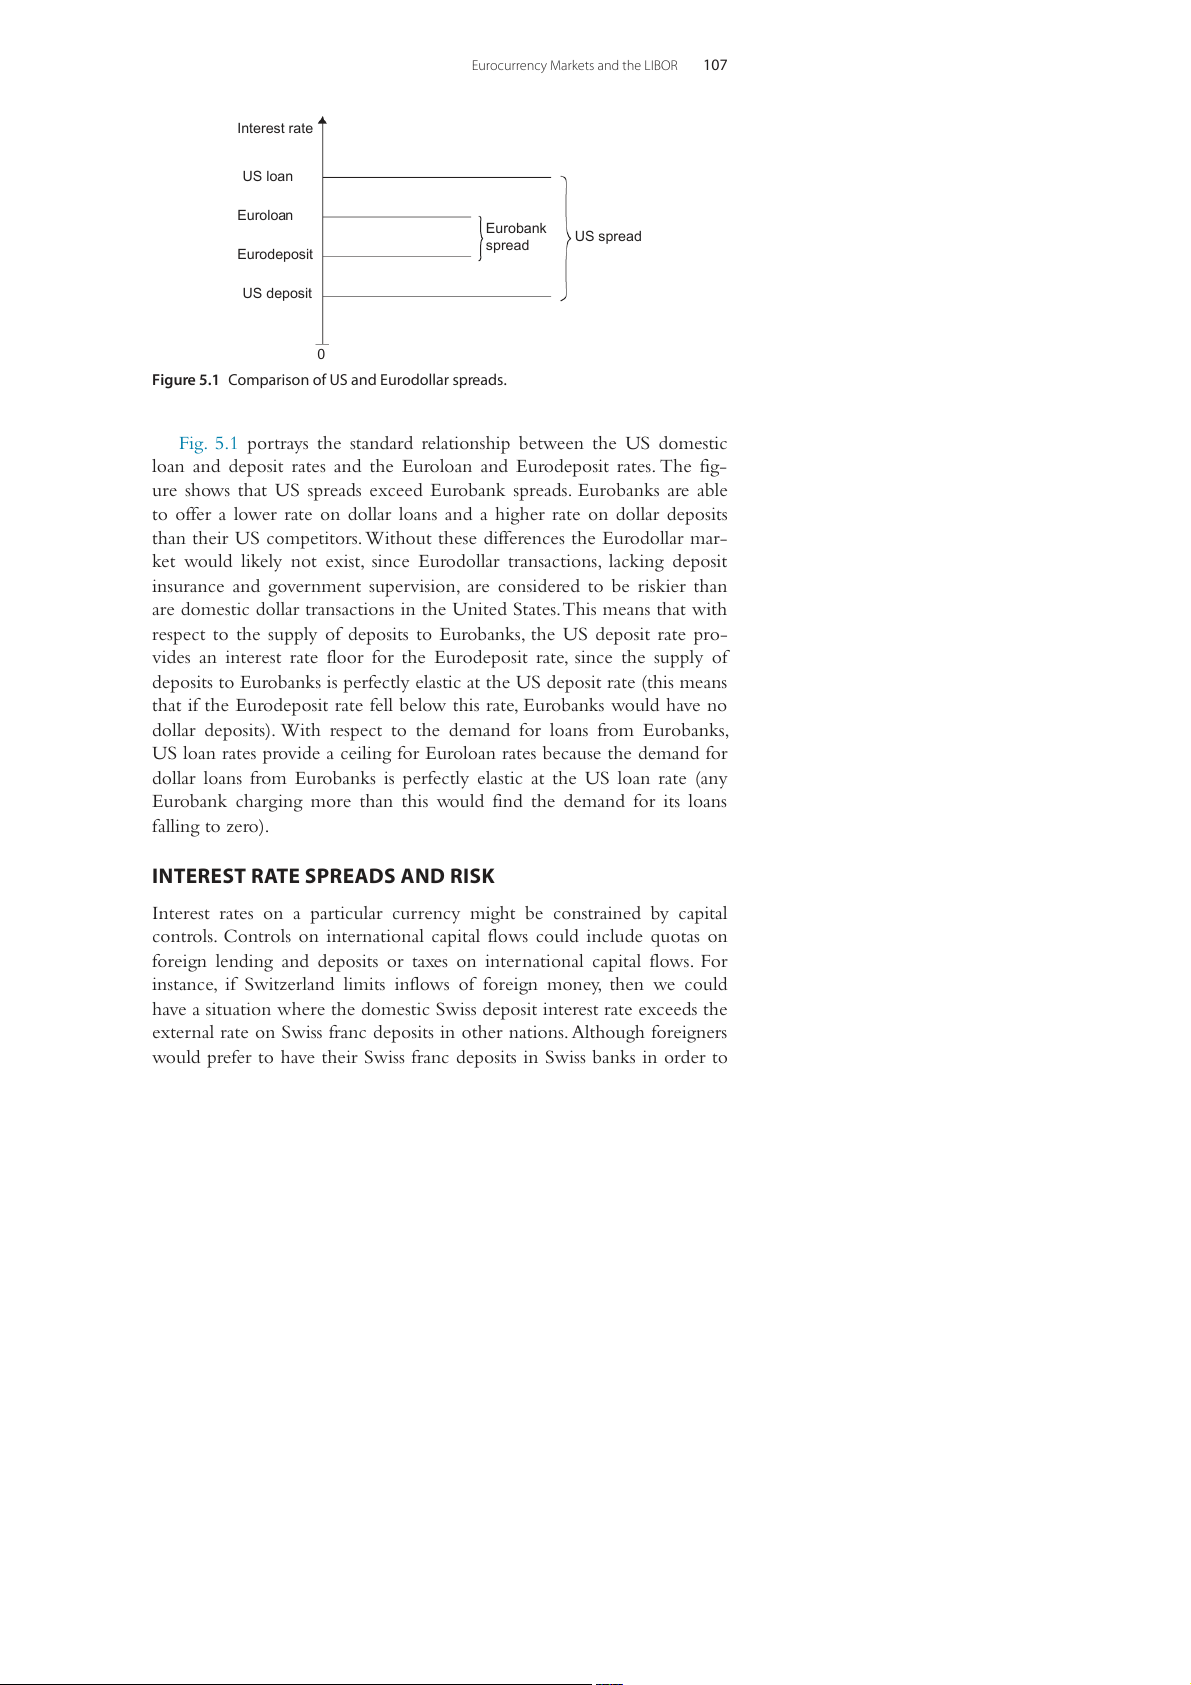
Eurocurrency Markets and the LIBOR 107 Interest rate US loan Euroloan Eurobank US spread spread Eurodeposit US deposit 0
Figure 5.1 Comparison of US and Eurodollar spreads.
Fig. 5.1 portrays the standard relationship between the US domestic
loan and deposit rates and the Euroloan and Eurodeposit rates. The fig-
ure shows that US spreads exceed Eurobank spreads. Eurobanks are able
to offer a lower rate on dollar loans and a higher rate on dollar deposits
than their US competitors. Without these differences the Eurodollar mar-
ket would likely not exist, since Eurodollar transactions, lacking deposit
insurance and government supervision, are considered to be riskier than
are domestic dollar transactions in the United States. This means that with
respect to the supply of deposits to Eurobanks, the US deposit rate pro-
vides an interest rate floor for the Eurodeposit rate, since the supply of
deposits to Eurobanks is perfectly elastic at the US deposit rate (this means
that if the Eurodeposit rate fell below this rate, Eurobanks would have no
dollar deposits). With respect to the demand for loans from Eurobanks,
US loan rates provide a ceiling for Euroloan rates because the demand for
dollar loans from Eurobanks is perfectly elastic at the US loan rate (any
Eurobank charging more than this would find the demand for its loans falling to zero).
INTEREST RATE SPREADS AND RISK
Interest rates on a particular currency might be constrained by capital
controls. Controls on international capital flows could include quotas on
foreign lending and deposits or taxes on international capital flows. For
instance, if Switzerland limits inflows of foreign money, then we could
have a situation where the domestic Swiss deposit interest rate exceeds the
external rate on Swiss franc deposits in other nations. Although foreigners
would prefer to have their Swiss franc deposits in Swiss banks in order to 108
International Money and Finance
earn the higher interest, the legal restrictions on capital flows might pro- hibit such a response.
It is also possible that a perceived threat to private property rights
could lead to seemingly perverse interest rate relations. If the United
States threatens to confiscate foreign deposits, the funds would tend to
leave the United States and shift to the external dollar market. This could
result in the Eurodollar deposit rate falling below the US deposit rate.
In general risk contributes to the domestic spread exceeding the
external spread. In domestic markets government agencies help ensure
the sound performance of domestic financial institutions, whereas the
Eurocurrency markets are largely unregulated, with no central bank ready
to come to the rescue. There is an additional risk in international transac-
tions in that investment funds are subject to control by the country of
currency denomination (when it is time for repayment) as well as the
country of the deposit bank. For instance, suppose a US firm has a US
dollar bank deposit in Hong Kong. When the firm wants to withdraw
those dollars—say, to pay a debt in Taiwan—not only is the transaction
subject to control in Hong Kong (the government may not let foreign
exchange leave the country freely), but the United States may control
outflows of dollars from the United States, so that the Hong Kong bank
may have difficulty paying back the dollars. It should be recognized that
even though domestic and external deposit and loan rates differ, primarily
because of risk, all interest rates tend to move together. When the domes-
tic dollar interest rate is rising, the external rate will also tend to rise.
The growth of the Eurodollar market is the result of the narrower
spreads offered by Eurobanks. We have seen the size of the Eurodollar
market grow as the total demand for dollar-denominated credit has
increased and as dollar banking has moved from the United States to the
external market. The shift of dollar intermediation has occurred as the
Eurodollar spread has narrowed relative to the domestic spread or as indi-
vidual responsiveness to the spread differential has changed.
Over time important external markets have developed for the other
major international currencies (euro, pound, yen, Canadian dollar, and
Swiss franc). But the value of activity in Eurodollars (which refers to off-
shore banking in US dollars) dwarfs the rest. In the end of 2015, the Bank
for International Settlements estimated the currency composition of the
Eurocurrency market to be: US dollar, 58%; euro, 26%; yen, 3%; British
pound, 6%; with other currencies taking the remainder.
Eurocurrency Markets and the LIBOR 109
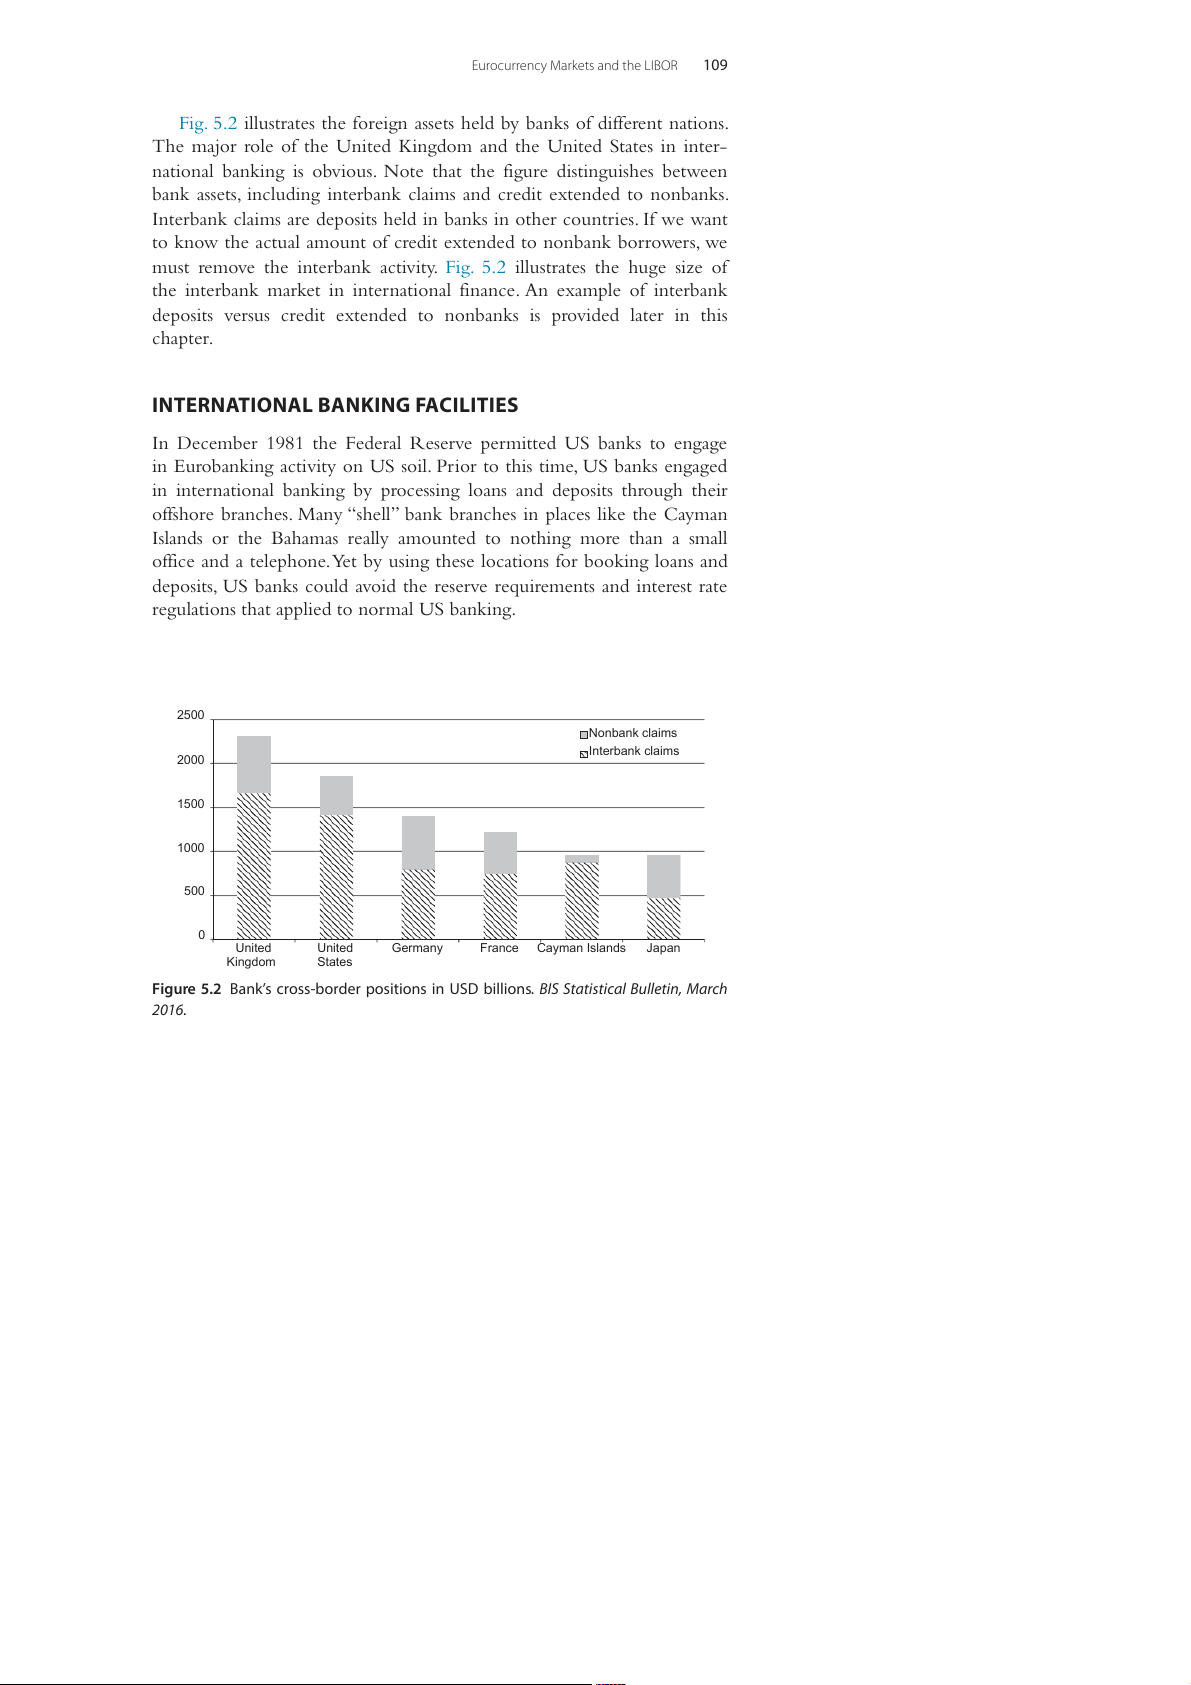
Fig. 5.2 illustrates the foreign assets held by banks of different nations.
The major role of the United Kingdom and the United States in inter-
national banking is obvious. Note that the figure distinguishes between
bank assets, including interbank claims and credit extended to nonbanks.
Interbank claims are deposits held in banks in other countries. If we want
to know the actual amount of credit extended to nonbank borrowers, we
must remove the interbank activity. Fig. 5.2 illustrates the huge size of
the interbank market in international finance. An example of interbank
deposits versus credit extended to nonbanks is provided later in this chapter.
INTERNATIONAL BANKING FACILITIES
In December 1981 the Federal Reserve permitted US banks to engage
in Eurobanking activity on US soil. Prior to this time, US banks engaged
in international banking by processing loans and deposits through their
offshore branches. Many “shell” bank branches in places like the Cayman
Islands or the Bahamas really amounted to nothing more than a small
office and a telephone. Yet by using these locations for booking loans and
deposits, US banks could avoid the reserve requirements and interest rate
regulations that applied to normal US banking. 2500 Nonbank claims Interbank claims 2000 1500 1000 500 0 United United Germany France Cayman Islands Japan Kingdom States
Figure 5.2 Bank’s cross-border positions in USD billions. BIS Statistical Bulletin, March 2016. 110
International Money and Finance
In December 1981 international banking facilities, or IBFs, were legal-
ized in the US. IBFs did not involve any new physical presence in US
bank offices. Instead they simply required a different set of books for an
existing bank office to record the deposits and loans permitted under the
IBF proposal. IBFs are allowed to receive deposits from, and make loans to,
nonresidents of the United States or other IBFs. These loans and depos-
its are kept separate from the rest of the bank’s business because IBFs are
not subject to reserve requirements, interest rate regulations, or Federal
Deposit Insurance Corporation deposit insurance premiums applicable to normal US banking.
The goal of the IBF plan is to allow banking offices in the United
States to compete with offshore banks without having to use an offshore
banking office. The location of IBFs reflects the location of banking activ-
ity in general. It is not surprising that New York State, as the financial cen-
ter of the country, has over 75% of IBF deposits. Aside from New York,
California and Illinois are the only states with a significant IBF business.
After IBFs were permitted, several states encouraged their formation by
granting low or no taxes on IBF business. The volume of IBF business that
resulted mirrored the preexisting volume of international banking activity,
with New York dominating the level of activity found in other states.
Since IBFs grew very rapidly following their creation, we may ask
where the growth came from. Rather than new business that was stimu-
lated by the existence of IBFs, it appears that much of the growth was
a result of shifting business from Caribbean shell branches to IBFs. After
the first month of IBF operation, $29.1 billion in claims on foreign resi-
dents existed. During this same period, the claims existing at Caribbean
branches of US banks fell $23.3 billion. Since this time IBF growth has
continued with growth of Eurodollar banking in general. As of June 2011
the IBFs surpassed the $700 billion mark, almost entirely as interbank claims.
OFFSHORE BANKING PRACTICES
The Eurocurrency market handles a tremendous volume of funds. Because
of the importance of interbank transactions, the gross measure overstates
the actual amount of activity regarding total intermediation of funds
between nonbank savers and nonbank borrowers, as Fig. 5.2 shows. To
measure the amount of credit actually extended through the Eurobanks,
we use the net size of the market—subtracting interbank activity from
total deposits or total loans existing. To understand the difference between
Eurocurrency Markets and the LIBOR 111
the gross and net volume of Eurodollar activity, consider the following example.
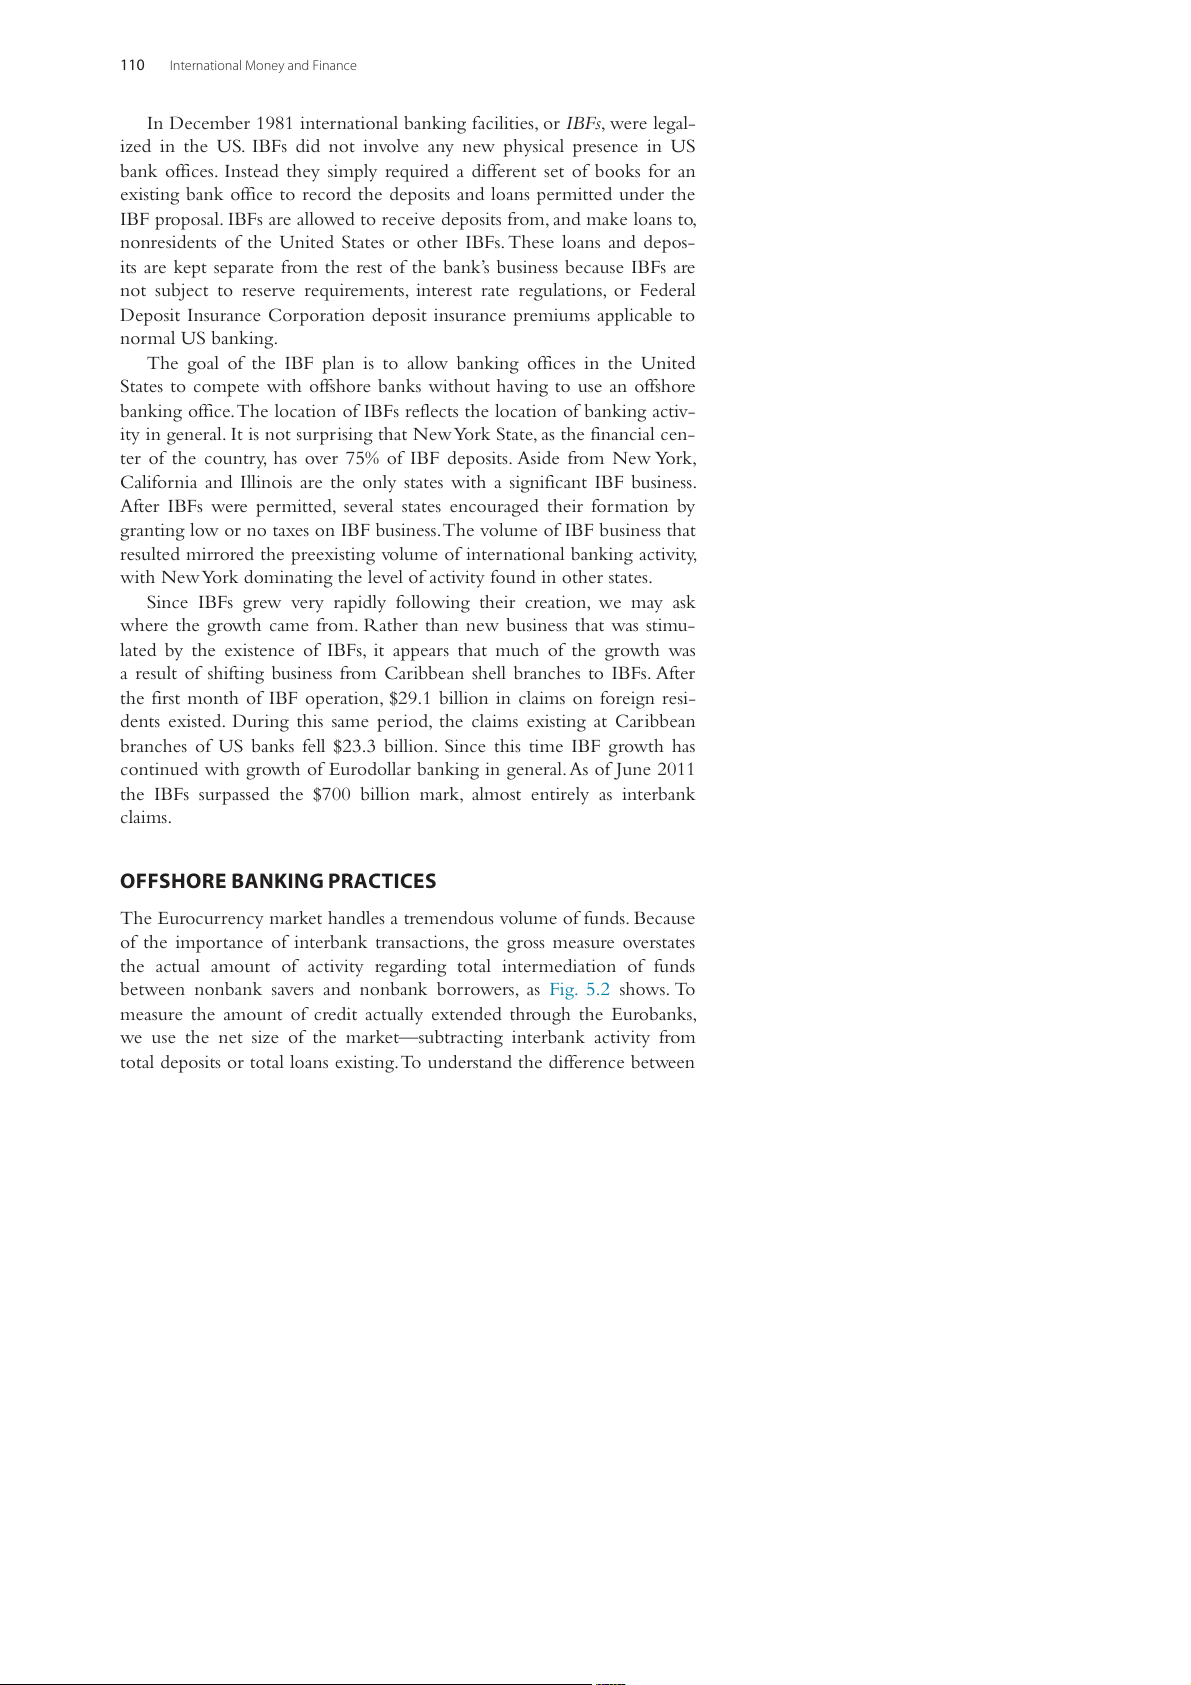
Suppose that a US firm, IBM in New York, shifts $1 million from its
US bank to a Eurobank, Eurobank A, to receive a higher return on its
deposits. Table 5.1 shows the T-accounts recording this transaction. The US
bank now has a liability (recorded on the right-hand side of its balance
sheet) of $1 million owed to Eurobank A, since the ownership of the $1
million deposit has shifted from IBM to Eurobank A. Eurobank A records
the transaction as a $1 million asset in the form of a deposit it owns in the
US bank, plus a $1 million liability from the deposit it has accepted from
IBM. Now suppose that Eurobank A does not have a borrower waiting
for $1 million (US), but another Eurobank, Eurobank B, does have a bor-
rower. Eurobank A will deposit the $1 million with Eurobank B, earning a
fraction of a percent more than it must pay IBM for the $1 million.
Table 5.2 shows that after Eurobank A deposits in Eurobank B, the US
bank now owes the US dollar deposit to Eurobank B, which is shown as Table 5.1
IBM-New York Deposits $1 Million in Eurobank A. US Bank Assets Liabilities $1 million due Eurobank A Eurobank A Assets Liabilities $1 million deposit in US Bank
$1 million Eurodollar deposit due IBM Table 5.2
Eurobank A Deposits $1 Million in Eurobank B. US Bank Assets Liabilities $1 million due Eurobank B Eurobank A Assets Liabilities
$1 million Eurodollar deposit in
$1 million Eurodollar deposit due IBM Eurobank B Eurobank B Assets Liabilities $1 million deposit in US Bank
$1 million Eurodollar deposit due Eurobank A 112
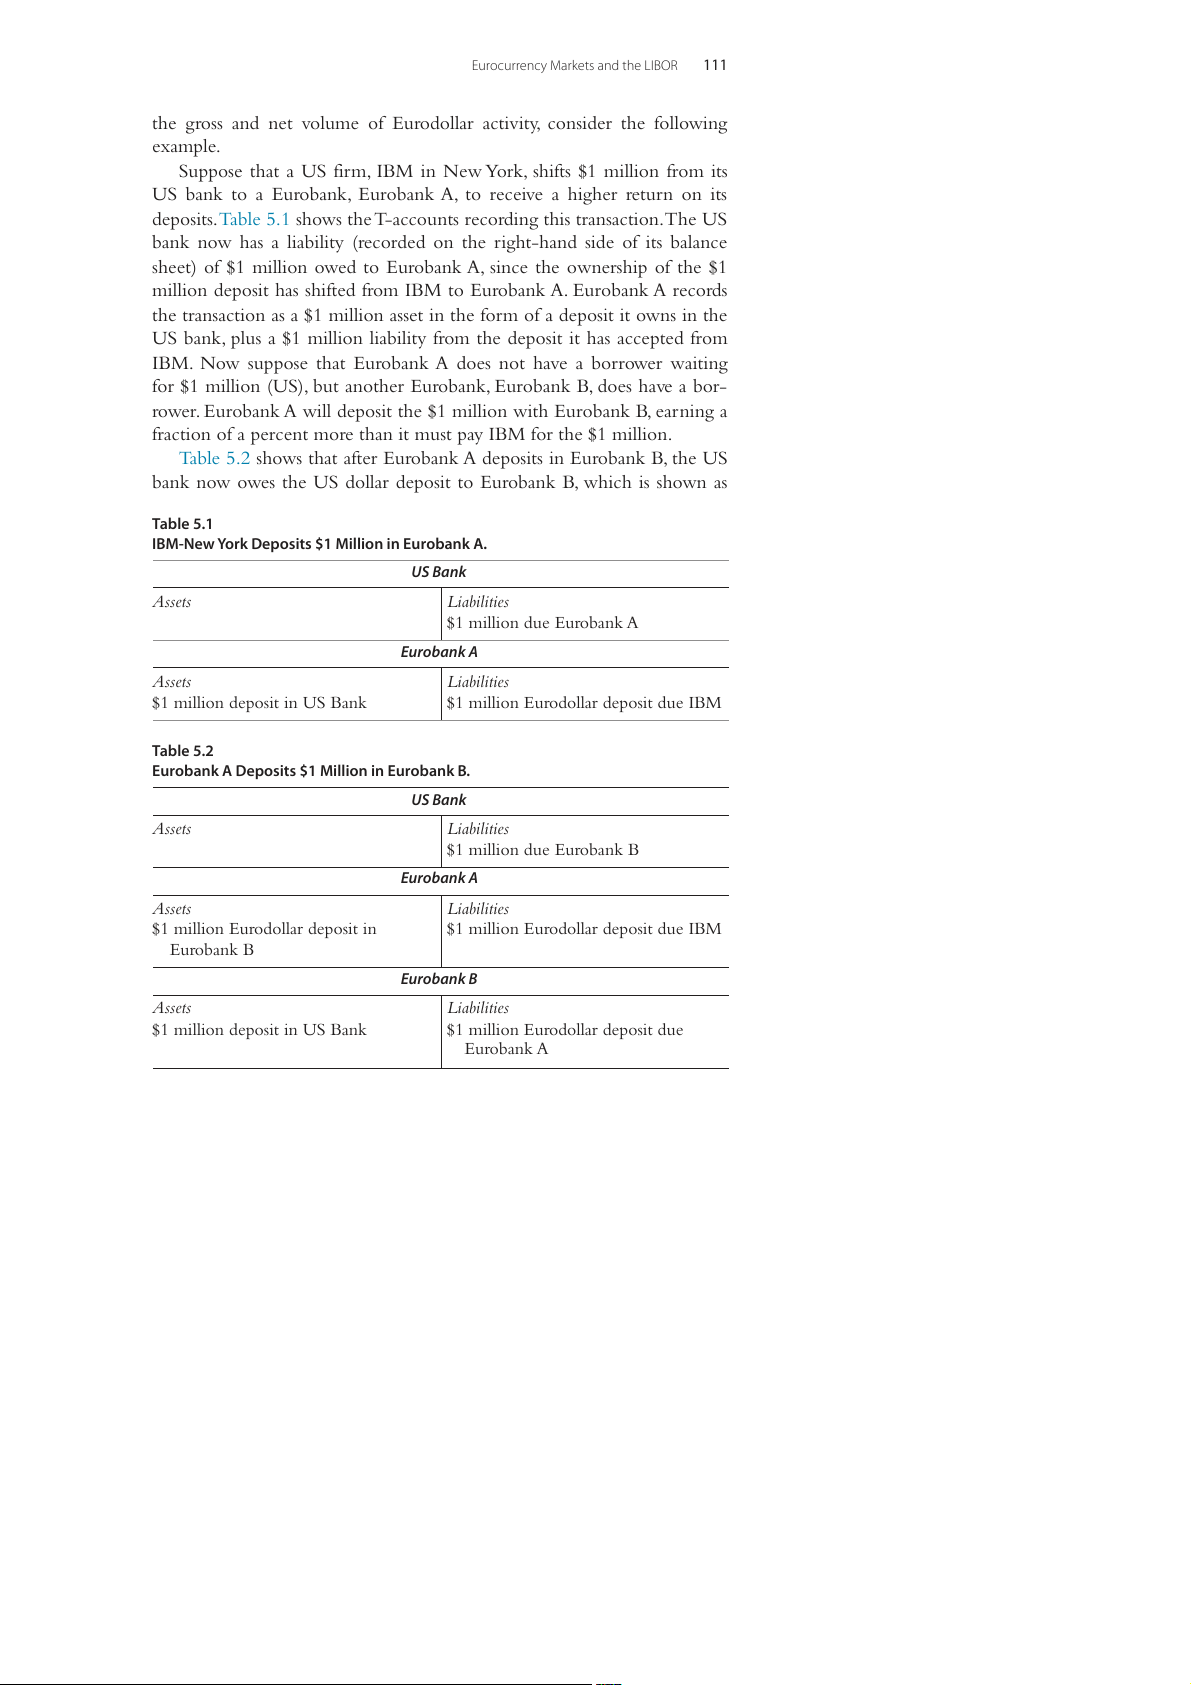
International Money and Finance Table 5.3
Eurobank B Loans $1 Million to BMW. US Bank Assets Liabilities $1 million due BMW Eurobank A Assets Liabilities
$1 million Eurodollar deposit in
$1 million Eurodollar deposit due IBM Eurobank B Eurobank B Assets Liabilities $1 million loan to BMW
$1 million Eurodollar deposit due Eurobank A BMW-Munich Assets Liabilities $1 million deposit in US Bank
$1 million loan owed to Eurobank B
an asset of Eurobank B, matched by the deposit liability of $1 million from Eurobank B to Eurobank A.
Finally in Table 5.3, Eurobank B makes a loan to BMW in Munich.
Now the US bank has transferred the ownership of its deposit liability to
BMW (Whenever dollars are actually spent following a Eurodollar trans-
action, the actual dollars must come from the United States—only the
United States creates US dollars; the Eurodollar banks simply act as inter-
mediaries.). The gross size of the market is measured as total deposits in
Eurobanks, or $2 million ($1 million in Eurobank A and $1 million in
Eurobank B). The net size of the market is found by subtracting inter-
bank deposits, and thus is a measure of the actual credit extended to non-
bank users of dollars. In the example, Eurobank A deposited $1 million in
Eurobank B. If we subtract this interbank deposit of $1 million from the
total Eurobank deposits of $2 million, we find the net size of the market to
be $1 million. This $1 million is the value of credit actually intermediated to nonbank borrowers.
Since the Eurodollar market deals with such large magnitudes, it is under-
standable that economists and politicians are concerned about the effects
the Eurodollar market can have on domestic markets. In the United States,
Eurocurrency Markets and the LIBOR 113
Eurodollar deposits are counted in the M3 definition of the money supply.
Measures of the US money supply are used by economists to evaluate the
resources available to the public for spending. Eurodollars are not spendable
money but, instead, are money substitutes like time deposits in a domestic
bank. Because Eurodollars do not serve as a means of payment, Eurobanks are
not able to create money as banks can in a domestic setting. Eurobanks are
essentially intermediaries; they accept deposits and then loan these deposits.
Even though Eurodollars do not provide a means of payment, they
still may have implications for domestic monetary practice. For countries
without efficient money markets, access to the very efficient and com-
petitive Eurodollar market may reduce the demand for domestic money,
because the domestic company need not use domestic currency for its transactions anymore.
All banks are interested in maximizing the spread between their
deposit and loan interest rates. In this regard, Eurobanks are no different
from domestic banks. All banks are also concerned with managing risk,
the risk associated with their assets and liabilities. Like all intermediar-
ies, Eurobanks tend to borrow short term and lend long term. Thus if the
deposit liabilities were reduced greatly, we would see deposit interest rates
rise very rapidly in the short run. The advantage of matching the term
structures of deposits and loans is that deposits and loans are maturing at
the same time, so that the bank is better able to respond to a change in demand for deposits or loans.
Deposits in the Eurocurrency market are for fixed terms, ranging
from days to years, although most are for less than 6 months. Certificates
of deposit are considered to be the closest domestic counterpart to a
Eurocurrency deposit. Loans in the Eurocurrency market can range up
to 10 or more years. The interest rate on a Eurocurrency loan is usually
stated as some spread over LIBOR (London Interbank Offered Rate) and
is adjusted at fixed intervals, like every 3 months. These adjustable interest
rates serve to minimize the interest rate risk to the bank.
Large loans are generally made by syndicates of Eurobanks. Syndicates
of banks are an organized group of banks. The syndicate will be headed
by a lead or managing bank; other banks wishing to participate in the
loan will join the syndicate and help fund the loan. By allowing banks to
reduce their level of participation in any loan, syndicates can participate
in more loans. Thus each individual bank reduces their risk by having a diversified loan portfolio. 114
International Money and Finance LIBOR
As of the end of 2010 the NYSE market capitalization was slightly over
$13 trillion dollars, and we hear news every day of what happened to the
stock market. The LIBOR affects financial assets worth at least 25 times
more, but rarely receives any press. LIBOR stands for London Interbank
Offered Rate and is the interest rate at which a group of large London
banks could borrow from each other each morning. Loans of $10 trillion
and Swaps worth about $350 trillion around the world are directly tied to
the LIBOR, according to the British Bankers Association. For example,
approximately half of the United States adjustable mortgages are estimated to be tied to the LIBOR. THE BBA LIBOR
In February 2014 the LIBOR changed from the BBA LIBOR to the
ICE LIBOR. To understand the reasons for this we are first going to dis-
cuss the way the LIBOR was traditionally computed and then compare
it to today’s methodology. The BBA LIBOR was collected by the British
Bankers’ Association (BBA). The LIBOR established a value each day at
11:00 a.m. London time for each major currency. LIBOR is the key rate
for fixing interest rates around the world. For instance a variable inter-
est rate loan in some currency may be priced at 2% points above LIBOR
and adjusted annually. Once a year the interest rate on the loan would be
adjusted to the currency value of LIBOR plus 2% points.
LIBOR was fixed daily for the following 10 currencies: the British
pound (GBP), Canadian dollar (CAD), Danish krone (DKK), euro (EUR),
US dollar (USD), Australian dollar (AUD), Japanese yen (JPY), New
Zealand dollar (NZD), Swedish krona (SKR), and Swiss franc (CHF).
There were 15 maturities for which LIBOR was set each day, from an
overnight rate all the way up to 12 months. Thus a total of 150 rates were set each day.
The daily value of LIBOR was drawn from a panel of contributing
banks chosen based upon their reputation, level of activity in the London
market, and perceived expertise in the currency concerned. For example,
for the US dollar 16 different respected banks submitted quotes, and the
four highest and four lowest quotes were eliminated. The borrowing costs
for the remaining eight banks were averaged into the LIBOR rate. Shortly
before 11:00 a.m. each business day, each bank reported the rate at which
Eurocurrency Markets and the LIBOR 115
it could borrow funds of a reasonable market size by accepting interbank
offers from banks other than the LIBOR panel of contributing banks.
Recently an investigation has begun into a possible collusion between
banks to set the LIBOR. It has been alleged that there have been sig-
nificant departures from the actual costs of borrowing by a number of
banks. The potential misreporting can pay off greatly for banks. According
to Snider and Youle (2010) a collusion among the banks to change
the LIBOR by 0.25% could earn a single bank as much as $3.37 billion
in a single quarter. Thus the incentive to quote incorrect rates or to collude exists. LIBOR RIGGING
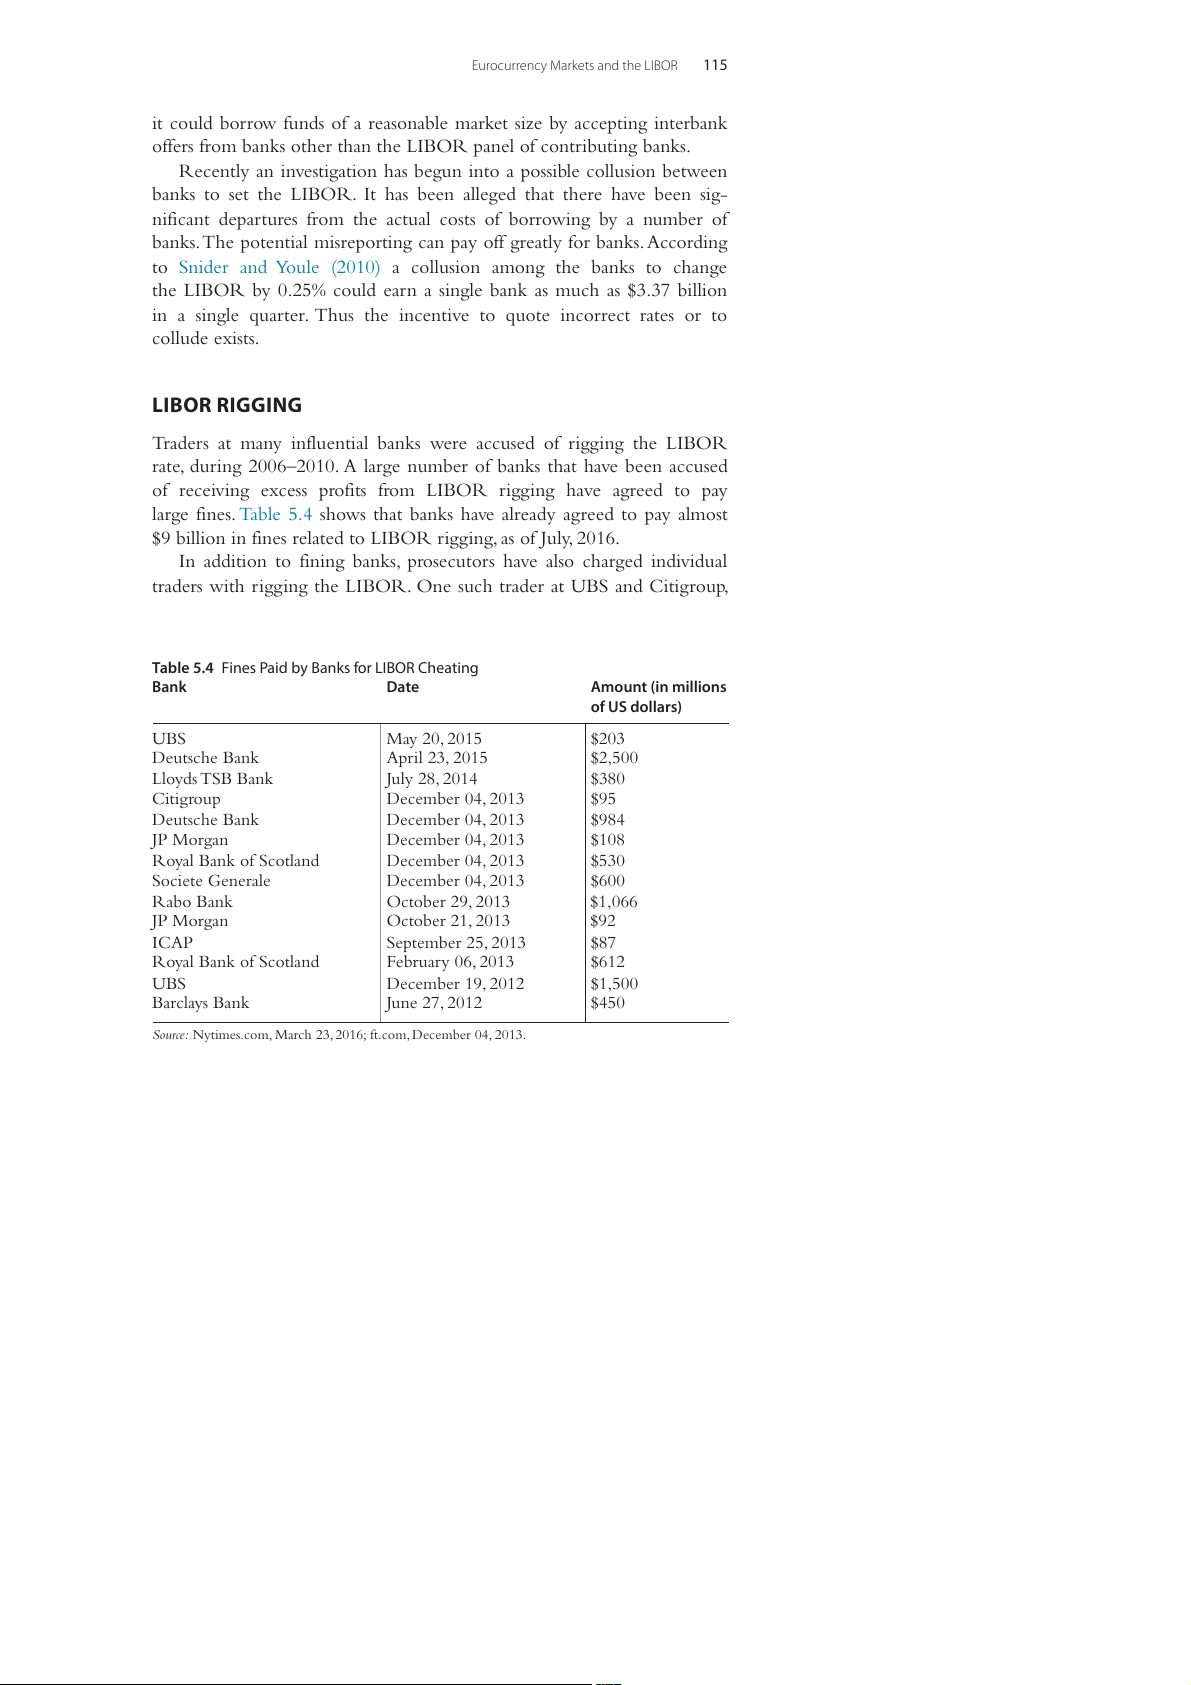
Traders at many influential banks were accused of rigging the LIBOR
rate, during 2006–2010. A large number of banks that have been accused
of receiving excess profits from LIBOR rigging have agreed to pay
large fines. Table 5.4 shows that banks have already agreed to pay almost
$9 billion in fines related to LIBOR rigging, as of July, 2016.
In addition to fining banks, prosecutors have also charged individual
traders with rigging the LIBOR. One such trader at UBS and Citigroup,
Table 5.4 Fines Paid by Banks for LIBOR Cheating Bank Date Amount (in millions of US dollars) UBS May 20, 2015 $203 Deutsche Bank April 23, 2015 $2,500 Lloyds TSB Bank July 28, 2014 $380 Citigroup December 04, 2013 $95 Deutsche Bank December 04, 2013 $984 JP Morgan December 04, 2013 $108 Royal Bank of Scotland December 04, 2013 $530 Societe Generale December 04, 2013 $600 Rabo Bank October 29, 2013 $1,066 JP Morgan October 21, 2013 $92 ICAP September 25, 2013 $87 Royal Bank of Scotland February 06, 2013 $612 UBS December 19, 2012 $1,500 Barclays Bank June 27, 2012 $450
Source: Nytimes.com, March 23, 2016; ft.com, December 04, 2013. 116
International Money and Finance
Tom Hayes, was accused of setting up a network of brokers and traders
to rig the LIBOR rate to create huge profit for the banks. On August
3, 2015 Tom Hayes was convicted of conspiring to rig the LIBOR rate,
and sentenced to 14 years in jail later reduced to 11 years and a $1.2 mil-
lion fine. In November, 2015 two Rabobank traders were convicted of
LIBOR rigging, followed by three Barclays traders that were convicted in
July, 2016.1 Many other people have been also charged and are awaiting
trials or have pleaded guilty already.
With such massive cheating the LIBOR rate needed to be overhauled.
In February 2014 the new ICE LIBOR was introduced that remedied
certain weakness of the BBA LIBOR. THE ICE LIBOR
The LIBOR was published by the British Bankers Association from
January, 1986 until January, 2014. In February, 2014 the LIBOR con-
tinued to be published by an organization called the ICE Benchmark
Administration. This organization has refined the process of submitting
quotes and reduced the number of currencies and maturities. The reduc-
tion in currencies and maturities happened, because some maturities were
thinly traded and some currencies less popular resulting in more volatility
in the LIBOR and more of a temptation to fix rates. Therefore LIBOR is
currently limited to five currencies: USD, GBP, EUR, JPY, and CHF, with
seven maturities from overnight to 12 months.
In addition to removing thin maturities, the new LIBOR has a much
stronger oversight over the rates that are submitted by banks. The struc-
ture of the ICE LIBOR has independent directors overseeing the survey
with participation from the Federal Reserve System, Swiss National Bank
and Bank of England. The new LIBOR focuses on accountability of the
banks. The senior manager from the bank that submits rate has to be able
to provide evidence to support the rate submitted, and the manager is
held personally liable. In this way a manager can be prosecuted for enter-
ing a false rate. In addition, analysts have been hired to examine statistical
evidence to detect if any discrepancy in the submissions can be found.
The ICE LIBOR is published on a daily basis, except for certain
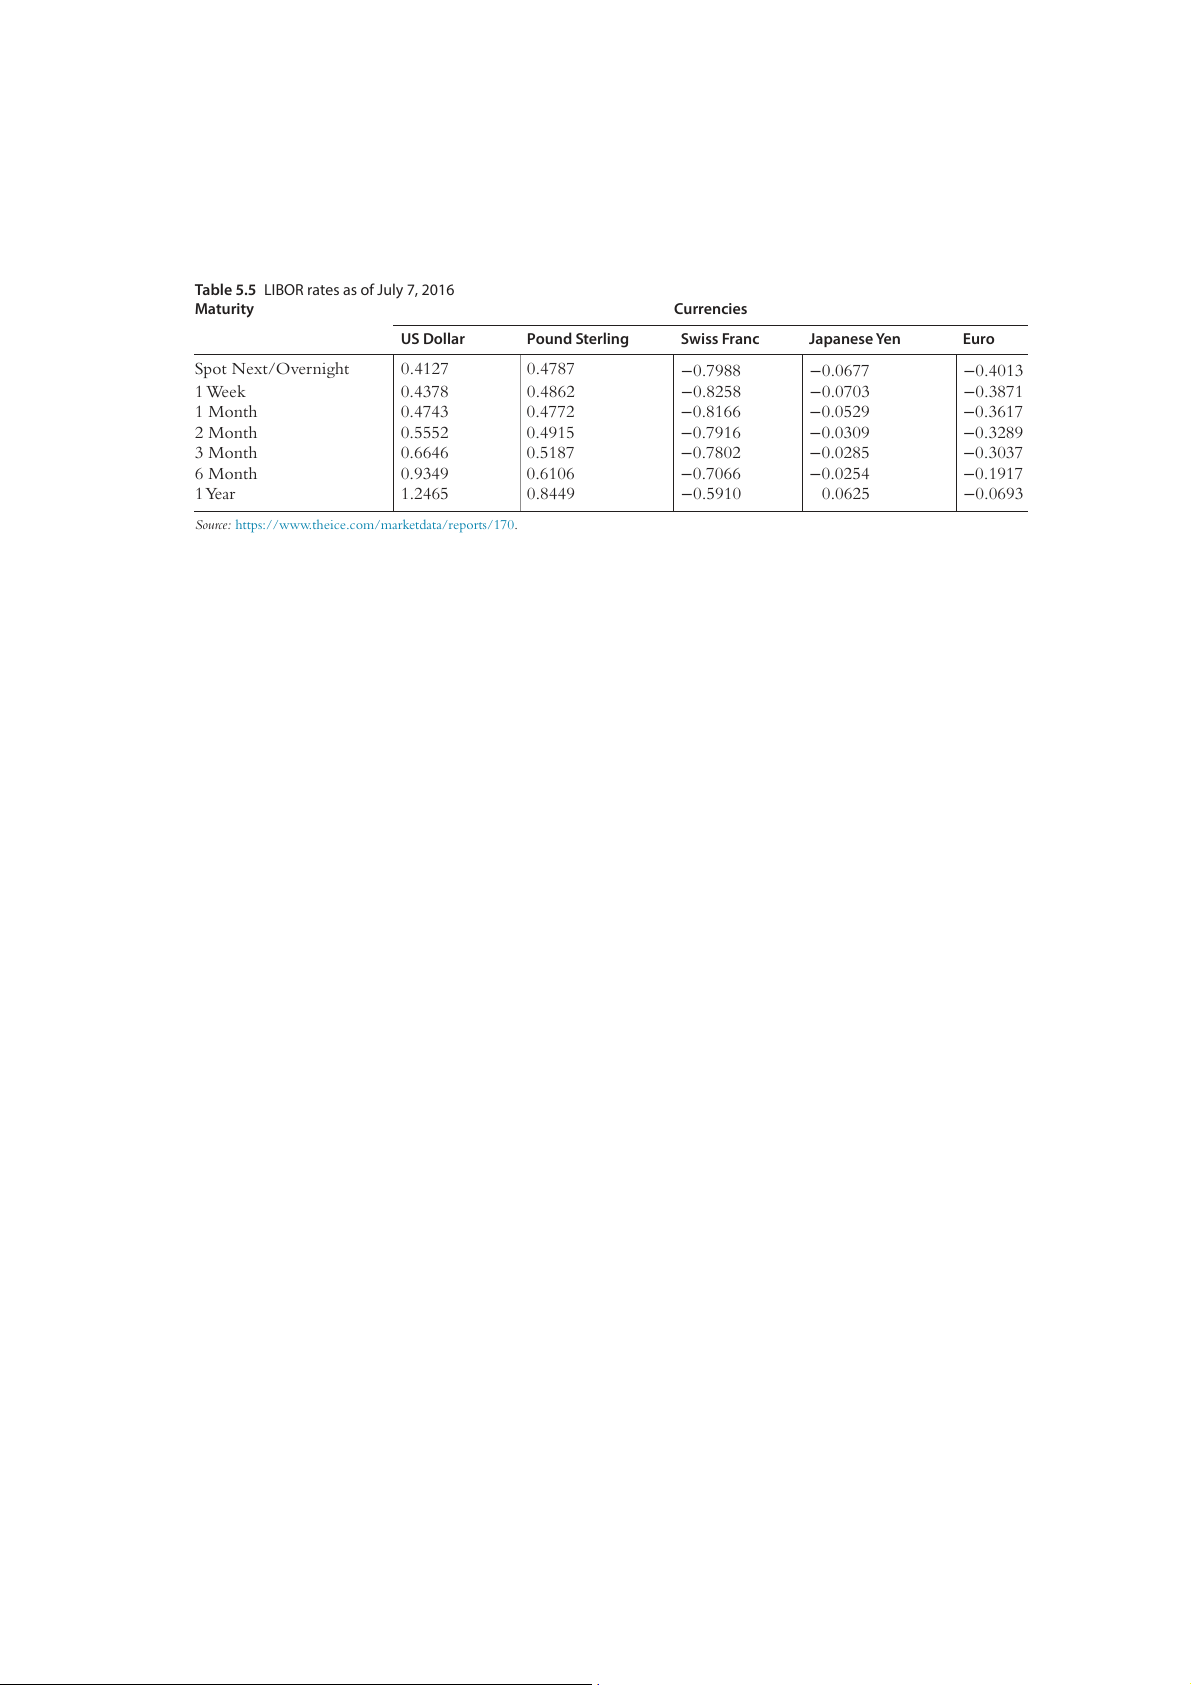
holidays. Table 5.5 shows the rates on July 7, 2016 for all currencies and
1 Source: Reuters Business News, August 3, 2015; Blomberg.com, July 4, 2016.
Table 5.5 LIBOR rates as of July 7, 2016 Maturity Currencies US Dollar Pound Sterling Swiss Franc Japanese Yen Euro Spot Next/Overnight 0.4127 0.4787 −0.7988 −0.0677 −0.4013 1 Week 0.4378 0.4862 −0.8258 −0.0703 −0.3871 1 Month 0.4743 0.4772 −0.8166 −0.0529 −0.3617 2 Month 0.5552 0.4915 −0.7916 −0.0309 −0.3289 3 Month 0.6646 0.5187 −0.7802 −0.0285 −0.3037 6 Month 0.9349 0.6106 −0.7066 −0.0254 −0.1917 1 Year 1.2465 0.8449 −0.5910 0.0625 −0.0693
Source: https://www.theice.com/marketdata/reports/170. 118
International Money and Finance
maturities. For all currencies the longer maturities have higher rates.
Across currencies rates are grouped in two groups. The dollar and pound
are very similar with positive rates. The other three currencies have nega-
tive rates, with the Swiss franc being strongly negative, the euro substan-
tially negative and the yen slightly negative. SUMMARY
1. The Eurocurrency market is the offshore banking market where
commercial banks accept deposits and extend loans in a currency
other than the domestic currency.
2. The Eurodollar, the US dollar-denominated deposits and loans out-
side the US, has the highest value of activity among other currency offshore banking.
3. Compared to domestic banks, the Eurobanks have lower operating
costs and are less regulated. Therefore they are able to offer narrower spread than domestic banks.
4. Because of fewer regulations, the Eurobanking has gained more pop-
ularity among investors and grown rapidly.
5. The Eurocurrency market improves efficiency of international
finances. Efficiency comes from access to low-cost borrowing, lack
of government regulations, and strong competition among the Eurobanks.
6. LIBOR is an important interest rate that the Eurodollar market uses
as a benchmark interest rate to set its loan rates.
7. The LIBOR is collected by the ICE Benchmark Administration since February 2014.
8. International banking facilities (IBFs) are departments of US banks
that are permitted to engage in Eurocurrency banking.
9. The net size of the Eurodollar market measures the amount of credit actually extended to nonbanks.
10. Large Eurocurrency loans are made by bank syndicates. EXERCISES
1. Why must Eurobanks operate with narrower spreads than domestic
banks? What would happen if the spreads were equal in both markets?
2. Use T-accounts to explain the difference between the gross and net size of the Eurodollar market.
Eurocurrency Markets and the LIBOR 119
3. Create an example of $10 million being deposited in the Eurodollar
market by a US manufacturing firm, Motorola. Your example should
include at least one interbank transaction before the dollars are bor-
rowed by a French public utility firm, Paris Electric. How is the gross
size of the Eurodollar market affected by your example? What about the net size?
4. Discuss how the Eurobanks can survive when they operate with such a small spread.
5. What could be the risks for depositors if they decide to use the
Eurocurrency market for their deposits?
6. What are the IBFs? Why did the Federal Reserve authorize the estab- lishment of the IBFs? Explain. FURTHER READING
Apergis, N., 1997. Domestic and eurocurrency yields: any exchange rate link? evidence from
a VAR model. J. Policy Model 19 (10), 41–49.
Bremnes, H., Gjerde, O., Saettem, F., 1997. A multivariate cointegration analysis of interest
rates in the eurocurrency market. J. Int. Money Financ. 16 (5), 767–778.
Snider, C., Youle, T., 2010. Does the LIBOR Reflect the Banks’ Borrowing Costs? Working
Paper. University of Minnesota. April.
Snider, C., Youle, T., 2014. The Fix is in, Detecting Portfolio Driven Manipulation of the
LIBOR. Dartmouth College. October.
Hsieh, N.C.T., Lin, A., Swanson, P.E., 1999. Global money market interrelationships. Int. Rev. Econ. Financ 8, 71–85.
Key, S.J., 1982. International banking facilities. Fed. Reserve Bull. 68, 565–576. October
MacKenzie, D., 2008. What’s in a number? The importance of LIBOR. Real-world Econ. Rev. 47, 237–242.
Tài liệu liên quan:
-

Hoạt động Tài chính của Doanh nghiệp Đa Quốc Gia (DN) - Chương 6 | Tài chính quốc tế | Trường Học Viện nông nghiệp Việt Nam
19 10 -

Hệ Thống Tiền Tệ Quốc Tế: Khái Niệm và Các Chế Độ Tỷ Giá | Tài chính quốc tế | Trường Học Viện nông nghiệp Việt Nam
24 12 -

Bài giảng Chương 1: Các Quan Hệ Cân Bằng Quốc Tế và LOP | Tài chính quốc tế | Trường Học Viện nông nghiệp Việt Nam
21 11 -

Cách Tính Lạm Phát và CPI: So Sánh Việt Nam và Mỹ | Tài chính quốc tế | Trường Học Viện nông nghiệp Việt Nam
23 12 -

Detailed Report and Analysis on Submission Trends | Tài chính quốc tế | Trường Học Viện nông nghiệp Việt Nam
23 12