Experimental report 2 Measurement of magnetic field Inside a solenoid with finite length môn Vật lý đại cương 2 | Học viện Công Nghệ Bưu Chính Viễn Thông
Investigate the magnetic field at a position along the axis of solenoid- Investigate the relationship between the magnetic field and the current through the solenoid. Tài liệu giúp bạn tham khảo, ôn tập và đạt kết quả cao. Mời đọc đón xem!
Môn: Vật lý đại cương 2 298 tài liệu
Trường: Học viện Công Nghệ Bưu Chính Viễn Thông 1.7 K tài liệu
Tác giả:


Preview text:
Experimental Report 2 MEASUREMENT OF MAGNETIC FIELD
INSIDE A SOLENOID WITH FINITE LENGTH
Verification of the instructors Group: 04 Name: Nguyễn Nhật Minh Student ID: 20224347
I. Experiment Motivations
- Investigate the magnetic field at a position along the axis of solenoid
- Investigate the relationship between the magnetic field and the current through the solenoid II. Experimental Result
1. Investigation of the magnetic field at the position along the axis of solenoid – B(x) I=0.4 (A) x (cm) B (mT) x (cm) B (mT) x (cm) B (mT) 0 0.68 10 1.36 20 1.36 1 1.03 11 1.36 21 1.35 2 1.18 12 1.36 22 1.34 3 1.26 13 1.36 23 1.34 4 1.30 14 1.36 24 1.33 5 1.32 15 1.36 25 1.32 6 1.33 16 1.36 26 1.30 7 1.34 17 1.36 27 1.25 8 1.35 18 1.36 28 1.19 9 1.35 19 1.36 29 1.03 30 0.68
2. Measurement of the relationship betweenthe magnetic field and the current through the solenoid – B(I) x = 15 (cm) U ( V) I (A) B (mT) 3 0.16 0.72 6 0.30 1.36 9 0.43 1.96 12 0.57 2.62
3. Comparison of experimental and theoretical magnetic field I = 0.4 (A) x (cm) B (mT) 0 0.92 15 1.81 30 0.92 III. Data Analysis
1. Relationship between the magnetic field and the position of the probe inside the solenoid
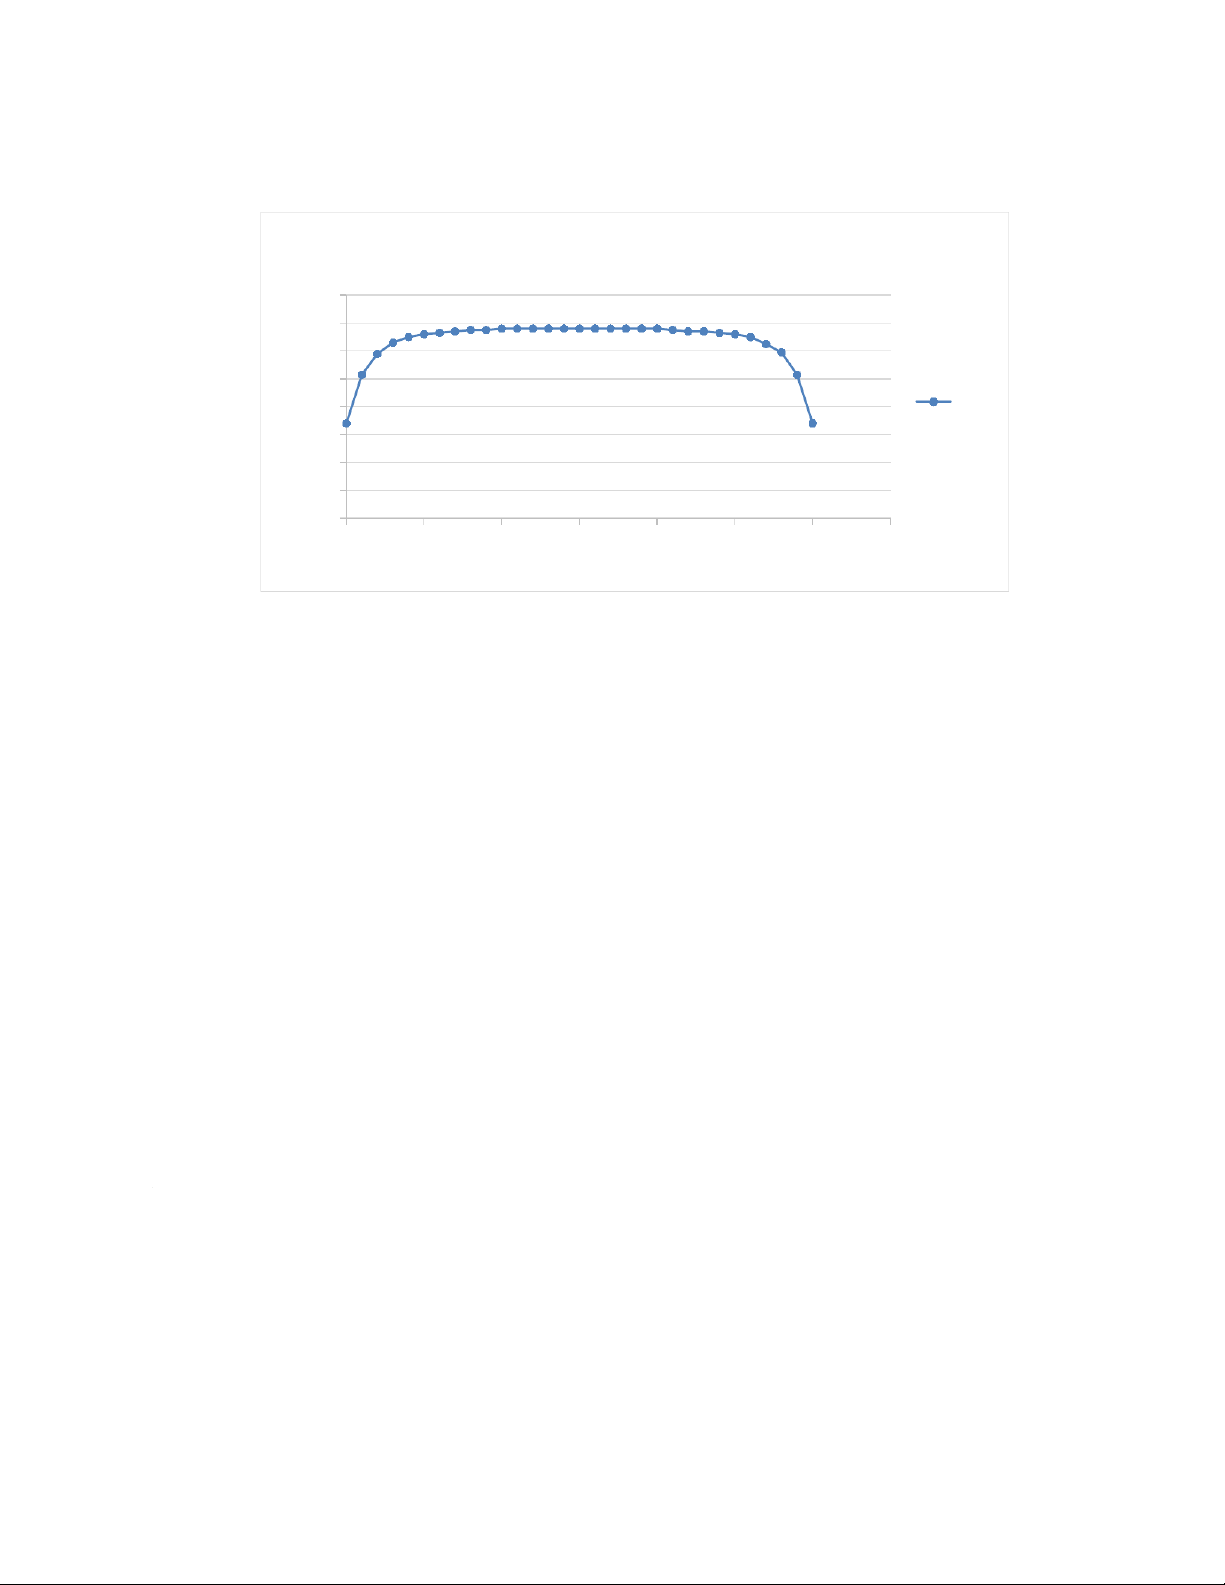
Diagram table between the magnetic field and the position of the probe inside the solenoid. 1.6 1.4 1.2 1 0.8 Series2 Y 0.6 (mT) 0.4 0.2 0 0 5 10 15 20 25 30 35 x (cm) Comment:
The graph show that the magnetic field inside a solenoid depends on the position of the probe
inside. The magnitude of the magnetic field increase from x=0 to x=10, and then stable until
x=20, then decrease with exact the same pace as it increase. The graph is symmetric around the point x=15 (cm)
2.Relationship between the magnetic field and the applied voltage
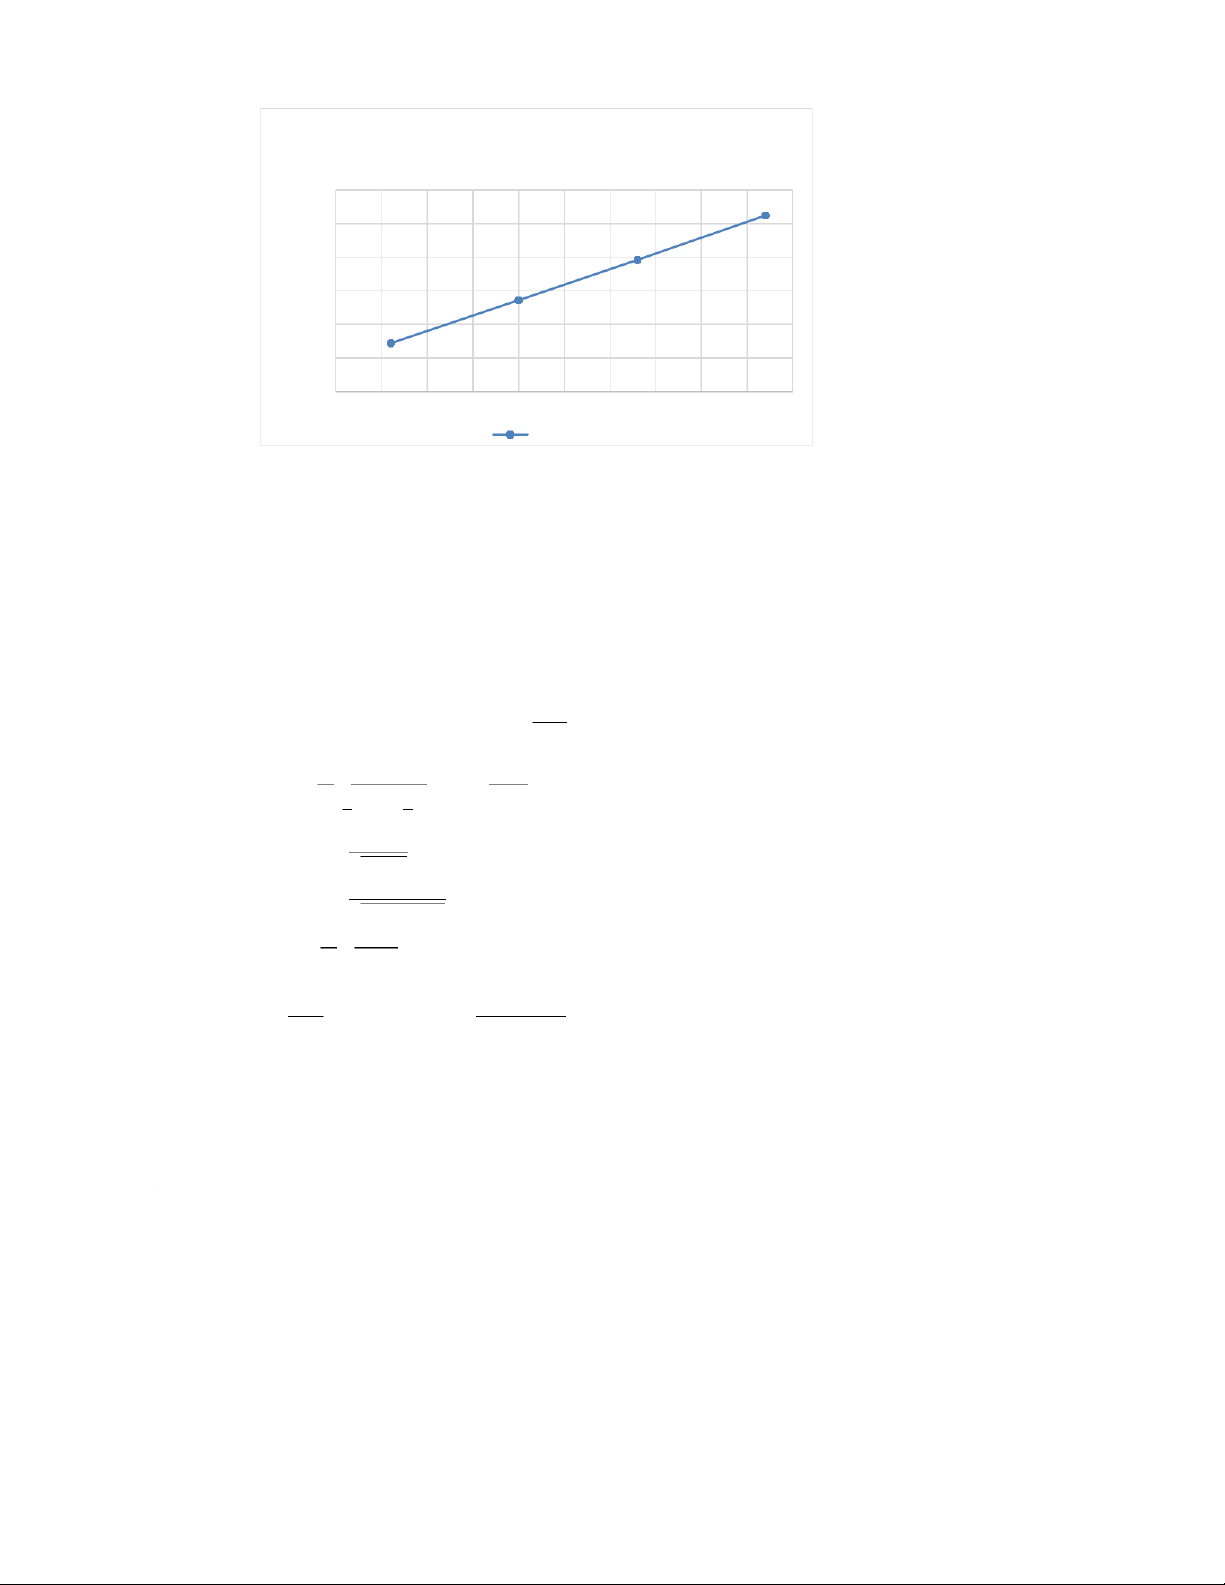
Diagram between the magnetic field and the applied voltage 3 2.62 2.5 1.96 2 1.5 1.36 I (A) 1 0.72 0.5
00.1 0.15 0.2 0.25 0.3 0.35 0.4 0.45 0.5 0.55 0.6 Y-Values Comment:
The graph shows that the magnitude of the magnetic field and the voltage has a linear
relationship. But in this case, the resistance is unchanged, so the current also has linear
relationship with the voltage. So, we can see that relationship between the magnetic field and the applied current is also linear
3. Comparison of experimental and theoretical magnetic field We have: B=μ0μr
2. I .n0(cosγ1−cosγ2) In this case, µr=1 N L=75
3 00×10−3=2500(turns n0= m)
I0=I √2=0.4 √2=0.566 (A) cosγ1=x√ R2+x2
cosγ2=−L−x √
R2+( L−x)2 R=D2=4.030 2=2.015(cm)
+) x=0 (cm): cosγ1 =0; cosγ2 =-0.998 B=μ =1.256 0μr ×10−6 2In0
(cosγ1−cosγ2 )
2×0.566×2500× (0+0.998 ) ¿0.86 (mT )
+) x=15 (cm): cosγ1 =0.991; cosγ2 =-0.991 B=μ =1.256 0μr ×10−6 2In0
(cosγ1−cosγ2 )
2×0.566×2500× (0.991 0.991 + ) ¿1.76 (mT )
+) x=30 (cm): cosγ1 =0.998; cosγ2 =0 B=μ =1.256 0μr ×10−6 2In0
(cosγ1−cosγ2 )
2×0.566×2500× (0.998 0 − )=0.88 (mT )
Comparison between theoretical values and experimental values x (cm) Btheoretical (mT) Bexperimental (mT) 0 0.92 0.89 15 1.81 1.76 30 0.92 0.88
Compare with the obtained result in the experiment:
The result from the experiment is approximately close the theoretical values. The
different due to the uncertainty of the instruments used.
Tài liệu liên quan:
-
Bài tập Vật lý nguyên tử môn Vật lý đại cương 2 | Học viện Công Nghệ Bưu Chính Viễn Thông
11 6 -
Bài tập Vật lý nguyên tử môn Vật lý đại cương 2 | Học viện Công Nghệ Bưu Chính Viễn Thông
11 6 -

Tán xạ ánh sáng và Hiệu ứng Tyndall - Lý thuyết và Ứng dụng môn Vật lý đại cương 2 | Học viện Công Nghệ Bưu Chính Viễn Thông
19 10 -

Chương 23: Quang học lượng tử môn Vật lý đại cương 2 | Học viện Công Nghệ Bưu Chính Viễn Thông
17 9 -

Chương 24: Cơ Học Lượng Tử - Tính Sóng-Hạt và Phương Trình Schrödinger môn Vật lý đại cương 2 | Học viện Công Nghệ Bưu Chính Viễn Thông
18 9