Financial Analysis - Môn Thị trường và các định chế tài chính - Đại Học Kinh Tế - Đại học Đà Nẵng
Products that replace products instead of Tiles glue: market of construction materials in Vietnam, because before this product line must be imported, has a high price, so it restricts users. There have been many foreign enterprises investing in the country to produce this kind of material, so the price is "softer", suitable for consumers' pocket. . Tài liệu giúp bạn tham khảo ôn tập và đạt kết quả cao. Mời bạn đọc đón xem!
Môn: Thị trường và các định chế tài chính 199 tài liệu
Trường: Trường Đại học Kinh tế - Đại học Đà Nẵng 1.4 K tài liệu
Tác giả:


Preview text:
lOMoAR cPSD| 50205883 0 lOMoARcPSD| 50205883 CONTENTS I.
INTRODUCE THE COMPANY ....................................................................................... 4 II.
STRATEGY ANALYSIS .................................................................................................... 5
1.1. Political and legal institutions: ...................................................................................... 5
1.2. Economic: ....................................................................................................................... 6
1.3. Socio-cultural: ................................................................................................................ 6
1.4. Technology: .................................................................................................................... 6
2.1. Rivalry Among Existing Firms: ...................................................................................... 6
2.2. Threat of New Entrants: ................................................................................................. 7
2.3. Threat of Substitute Products:........................................................................................ 7
2.4. Bargaining Power of Buyers: ......................................................................................... 7
2.5. Bargaining Power of Suppliers: ..................................................................................... 7 III.
FINANCIAL ANALYSIS ................................................................................................. 8 1 lOMoARcPSD| 50205883 2.1.
Financial Autonomy ................................................................................................ 10 2.2.
Fund Stability .......................................................................................................... 12 2.3.
Financial Balance .................................................................................................... 13
2.3.1 Long-term Financial Balance ................................................................................. 13 3.1.
Cash management. .................................................................................................. 15 3.2.
Inventory management: .......................................................................................... 16 3.3.
Account receivable management: ........................................................................... 16 4.1.
Overall financial performance analysis .................................................................. 19 4.2.
Asset use efficience analysis ................................................................................... 20
4.2.2 Fixed assets use efficiency (Fixed assets turnover) ................................................ 21
4.2.3 Assets use efficiency (Current assets turnover) ...................................................... 22
4.3. Operating profitability analysis............................................................................... 25 2 lOMoARcPSD| 50205883 5.1.
Short-term Liquidity Risk .................................................................................... 28 5.1.1.
Current Liabilities Coverage Ratio ..................................................................... 28 5.1.2.
Current Assets Turnover ...................................................................................... 30 5.2.
Long-term Solvency Risk ..................................................................................... 31
5.2.1 Debt Ratio ............................................................................................................... 31
5.2.2 Interest Coverage Ratio .......................................................................................... 32 5.3.
Altman Z-Score ..................................................................................................... 33 7.1.
BUSINESS RISK ANALYSIS ............................................................................. 35
7.1.1 Economic risks ........................................................................................................ 35 7.1.2. Legal
risks............................................................................................................ 35 7.1.3.
Specific risks ........................................................................................................ 36 7.1.4.
Other risks ........................................................................................................... 36 7.2.
BUSINESS VALUATION .................................................................................... 37
CONCLUSION .......................................................................................................................... 38 LIST OF TABLES
Table 1. Assets structure analysis .............................................................................................. 8
Table 2. Financial Autonomy ................................................................................................... 10
Table 3 Fund Stability ............................................................................................................... 12
Table 4. Long-term Fincial Balance ........................................................................................ 13 3 lOMoARcPSD| 50205883
Table 5. Short-term Finacial Balance ...................................................................................... 14
Table 6. Cash Management ...................................................................................................... 15
Table 7. Inventory management: ............................................................................................. 16
Table 8. Account receivable management .............................................................................. 17
Table 9. ROS - Financial Performance Analysis .................................................................... 19
Table 10. COGS/Revenues ....................................................................................................... 20
Table 11. Assets turnover ......................................................................................................... 20
Table 12. Fixed assets use efficiency ........................................................................................ 21
Table 13. Current assets turnover ........................................................................................... 22
Table 14. Inventories turnover ................................................................................................. 23
Table 15. Account receivable turnover ................................................................................... 24
Table 16. Return on assets ........................................................................................................ 25
Table 17. Dupont ....................................................................................................................... 25
Table 18. Return on owner's equity ......................................................................................... 27
Table 19. Current Ratio ............................................................................................................ 28
Table 20. Quick Ratio ............................................................................................................... 29
Table 21. Cash Ratio ................................................................................................................. 29
Table 22. Cash Flow Ratio ........................................................................................................ 30
Table 23. Inventory Turnover .................................................................................................. 30
Table 24. Accounts Receivable Turnover ............................................................................... 31
Table 25. Debt Ratio .................................................................................................................. 31
Table 26. Interest Coverage Ratio ........................................................................................... 32
Table 27. Altman Z-Score ......................................................................................................... 33 I. INTRODUCE THE COMPANY Short name: Bim Son Cement Company
International transaction name: BIMSON JOINT STOCK COMPANY. Abbreviated name: BCC. Address:
Ba Dinh Ward, Bim Son Town, Thanh Hoa Province. 4 lOMoARcPSD| 50205883 HISTORY:
Bim Son Cement Factory was established on March 4, 1980. August 12, 1993, the
Ministry of Construction decided to establish Bim Son Cement Company.
By 2006, the company was officially equalized and changed its name to Bim Son Cement
Joint Stock Company. Also, in this year, the company was licensed to list and trade on Hanoi
Stock Exchange (HNX) with BCC code. BUSINESS TYPES:
Producing, trading, importing and exporting cement and clinker Producing
and trading in other construction materials.
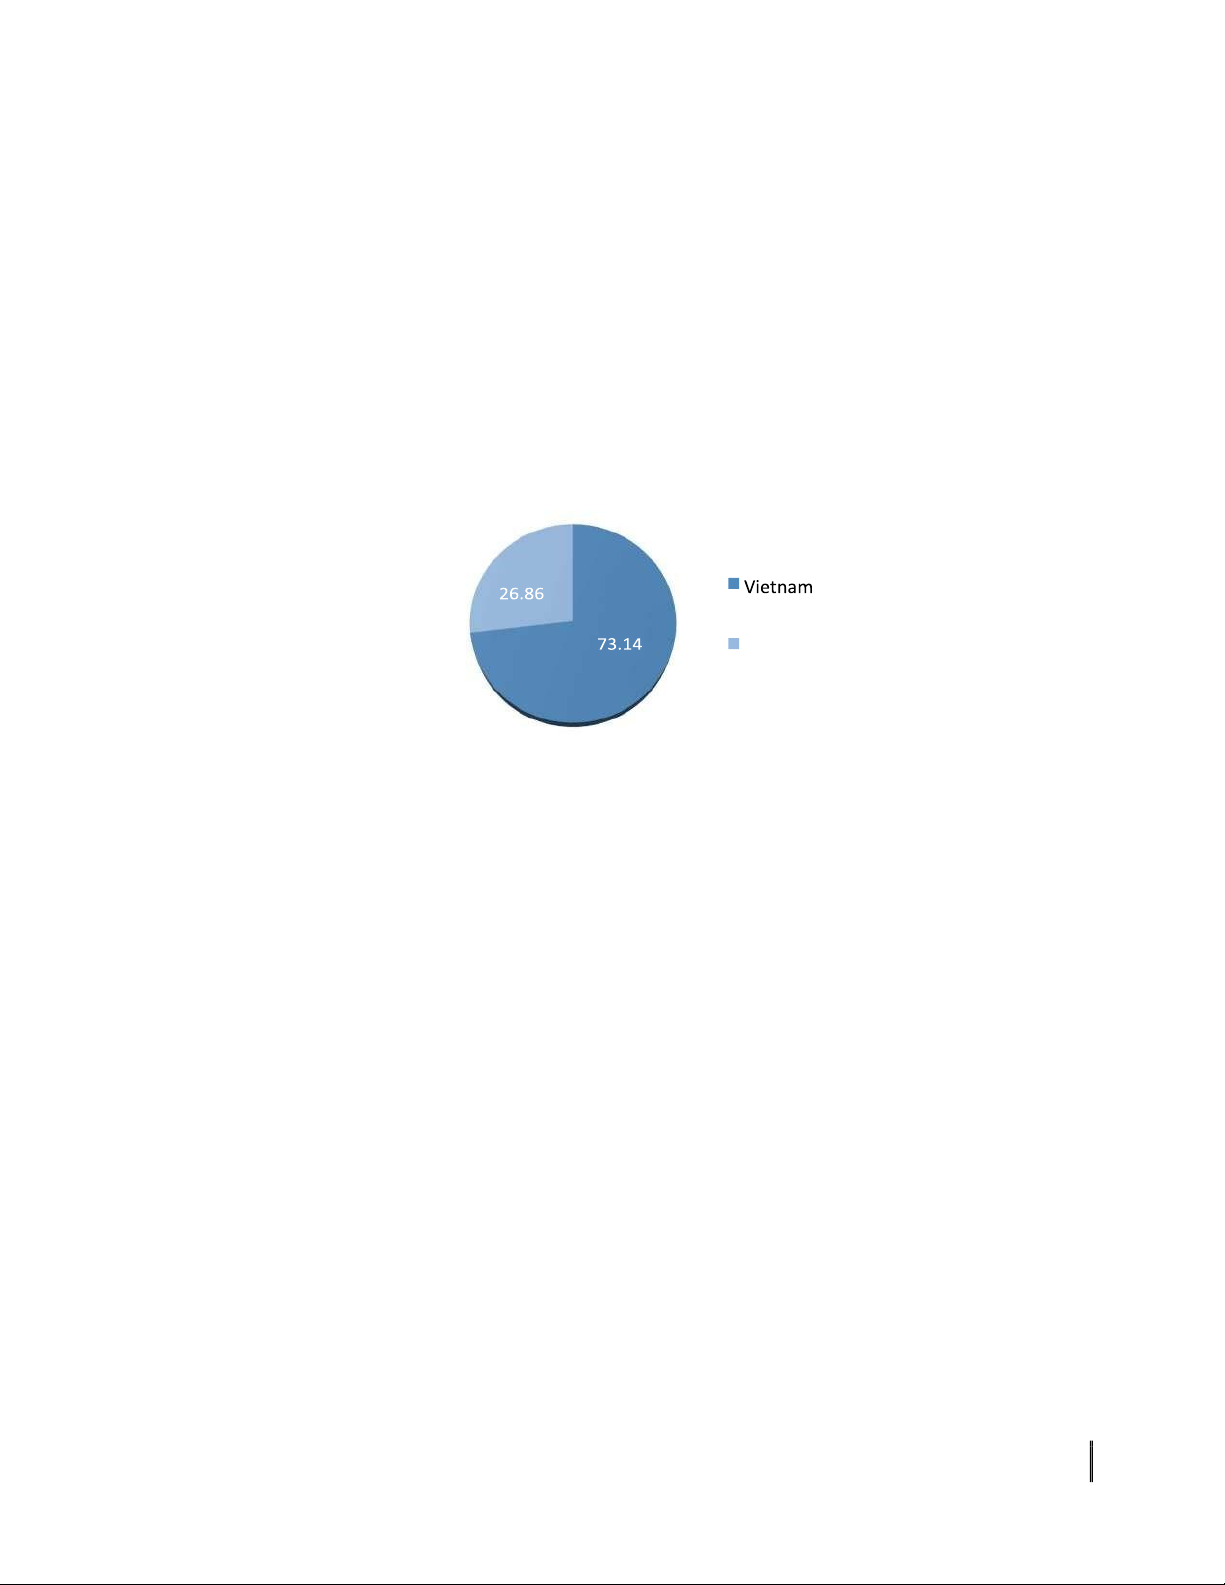
CHARTERED CAPITAL: 956,613,970,000 VND. SHAREHOLDER STRUCTURE: 5 lOMoARcPSD| 50205883
The contributed capital with 73.14%, Vietnam Cement Corporation is the largest shareholder of BCC Company.
The Central Cement Joint Stock Company (CRC)is the subsidiary company's BCC. As at
31/12/2017, the company holds 76.8% of this one's equity.
The major shareholder is Vicem, so that the shareholders inside only hold 0.05% of
shares. Therefore, remaining 26.95% due to others investors. Cement CORP Other investors II. STRATEGY ANALYSIS
1. PESTLE ANALYSIS – MACRO ENVIRONMENT
1.1. Political and legal institutions:
Vietnam is ranked as a high level of political stability, it’s an important advantage to
Vietnam attracts investment capital, in which the cement industry is one of the industries special attention.
The government has been actively opening up markets and exchanging working with
countries and joining international economic organizations. 1.2. Economic:
The state of the economy: In recent years, the economy of our country has developed
strongly. According to statistics: GDP growth in 2015: 6,68%, in 2016: 6,21%, 2017: 6,81%. In
2015-2016, the cement market in the Central region and the North continued to grow increase
supply. Factors affecting business activities of BCC beside the economic growth also includes: 6 lOMoARcPSD| 50205883
Exchange Rate: The value of VND has weakened, causing the Company to pay more in the
import of raw materials, input fuel and affect the company's revenue.
Interest Rate: relatively high mobilizing interest rates have affected investment demand,
capital costs, making it difficult for expanded investment activities, loan repayment costs to
invest in high-rise lines to reduce profits. 1.3. Socio-cultural:
Vietnam is in the process of urbanization leading to an explosion in housing and workshop
construction, causing demand. Cement demand in construction increased. That is a good
chance for company. However, noise and dust pollution in cement factories is still a
longstanding problem to environment. The government gives policies and measures to resolve that. 1.4. Technology:
Technology is an important factor in the production. However, the main production lines
especially in the companies established in the early days have become obsolete and damaged
parts, so the investment costs for technology are quite large.
The process of reinvesting production technology will be difficult and this factor will create
two sides of the company when considering competition in the same industry.
2. FIVE FORCES - INDUSTRIAL ANALYSIS
2.1. Rivalry Among Existing Firms:
Since our country opened, the economy has prospered, the cement industry has many
innovations, more and more developed, many new cement plants with advanced technology
were born. Bim Son Cement Joint Stock Company has been facing fierce competition not only
for domestic competitors but also with regional countries. 2.2. Threat of New Entrants: 7 lOMoARcPSD| 50205883
The cement industry is a sector that will thrive in a developing country like Vietnam, the
rapid urbanization rate, the implementation of national key projects and projects will also
facilitate the development. Besides, Vietnam's cement price is lower than the general level of
the region. Therefore, the cement industry is attractive to many businesses. Currently due to
legal barriers, the entry into the industry is relatively difficult and the cement projects need a
large investment, making it difficult to join the industry.
2.3. Threat of Substitute Products:
Products that replace products instead of Tiles glue: market of construction materials in
Vietnam, because before this product line must be imported, has a high price, so it restricts
users. There have been many foreign enterprises investing in the country to produce this kind
of material, so the price is "softer", suitable for consumers' pocket.
2.4. Bargaining Power of Buyers:
For Bim Son Cement Joint Stock Company, customers are: individuals, households,
agencies, businesses, corporations, corporations. For small customers often do not cause much
pressure on enterprises. However, for large enterprises in construction industry, cement
consumption is huge, key projects and projects of the country all consume very large cement
and will apply great force for BCC.
2.5. Bargaining Power of Suppliers:
For the cement industry, the competitiveness of enterprises in the industry are low and
the dominant role is concentrated mainly in Vietnam Cement Corporation. The policy of cement
prices is subject to the general administration of the government.
Ability to replace products of suppliers: For cement, the cost of raw materials accounts
for 35-45% of the cost of clinker production, so the cost of raw materials will greatly affect the
Cement enterprises often produce in areas with limestone mountains, cement additives can be
purchased in other areas. Usually the supplier selection is relatively stable. Many cement
factories also have the right to exploit additive materials. 8 lOMoARcPSD| 50205883 9 lOMoAR cPSD| 50205883 Financial Analysis 42K18.2CLC III. FINANCIAL ANALYSIS
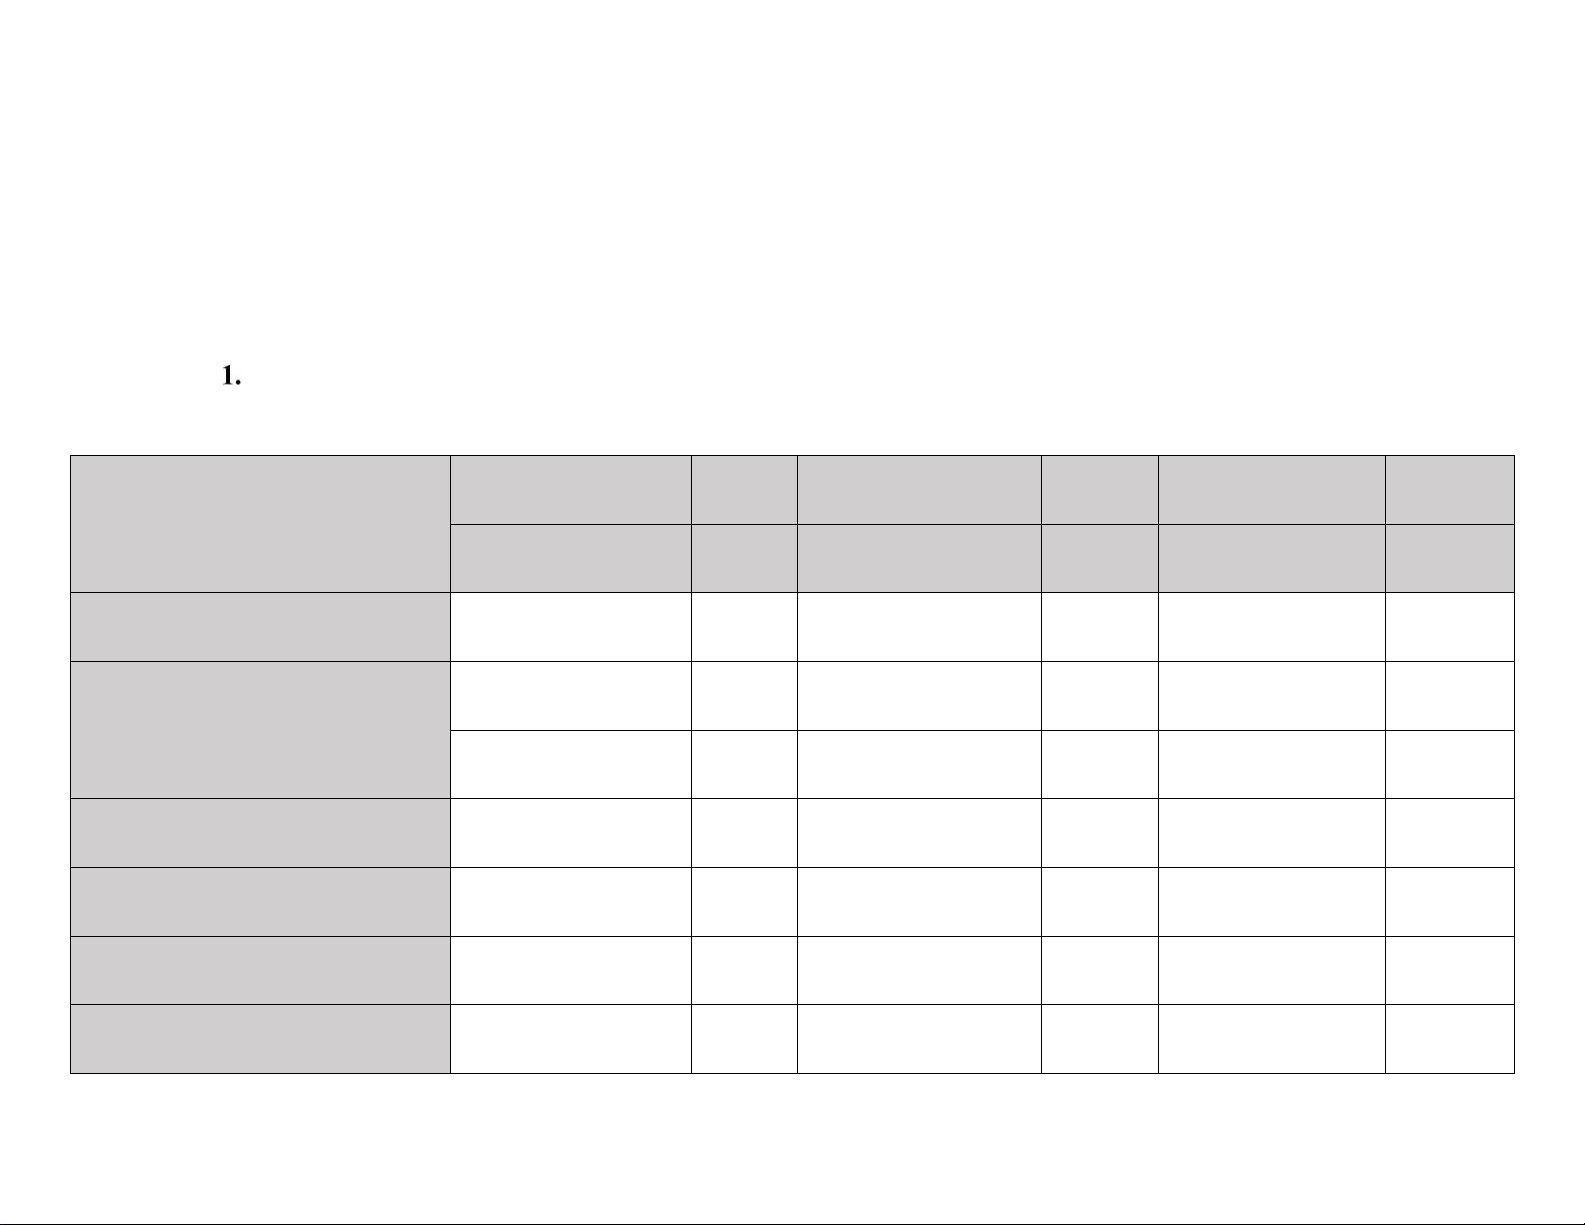
ANALYZE ASSET STRUCTURE OVER THE YEARS
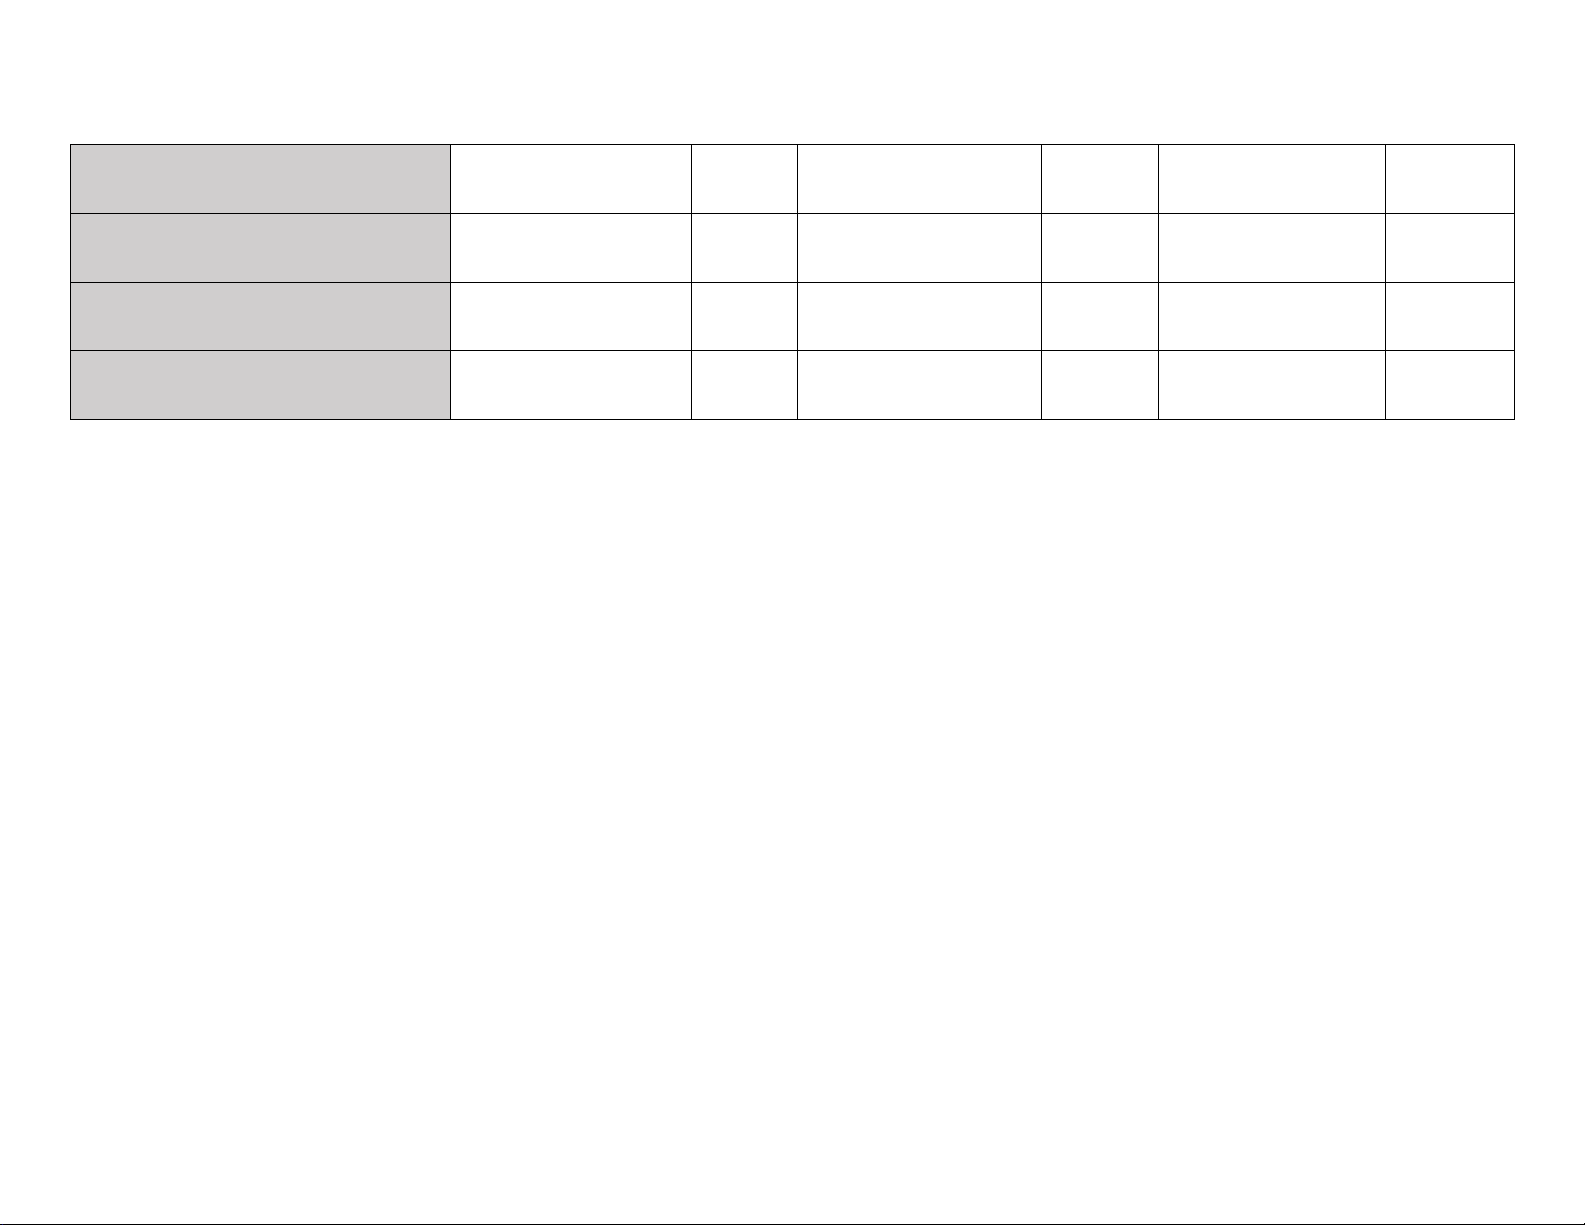
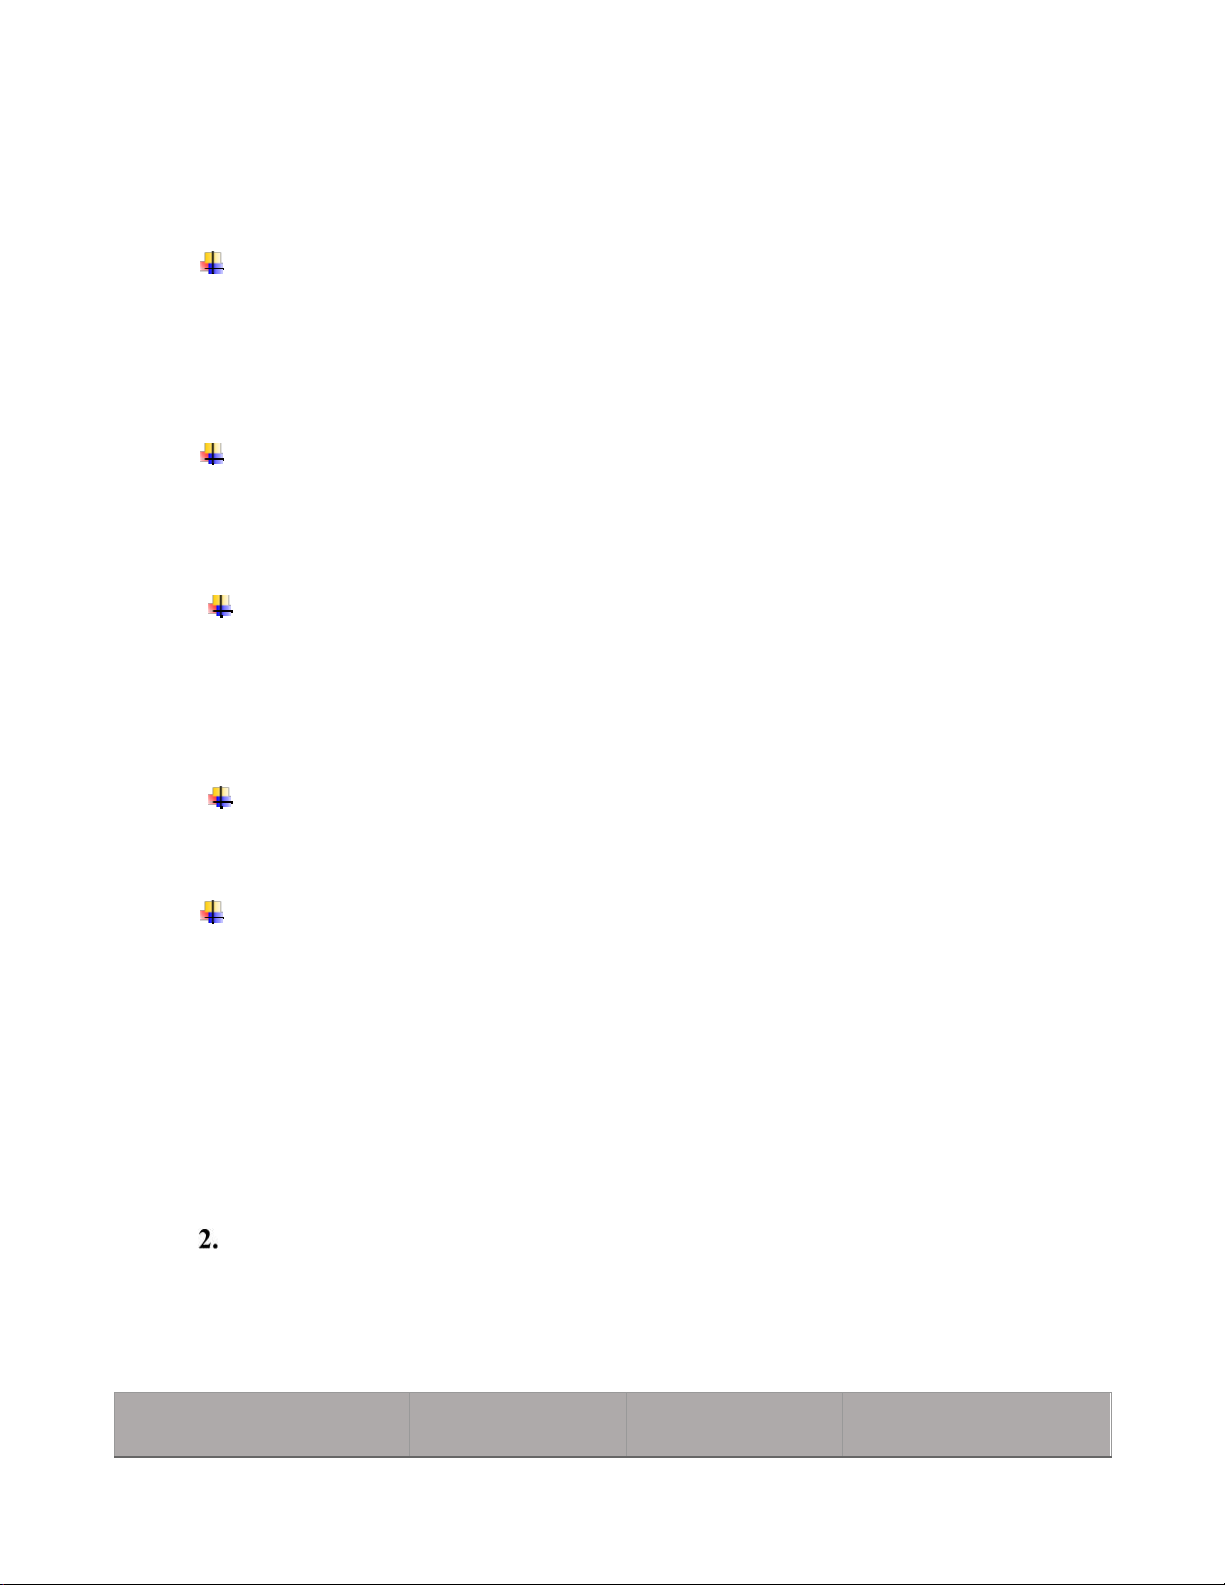
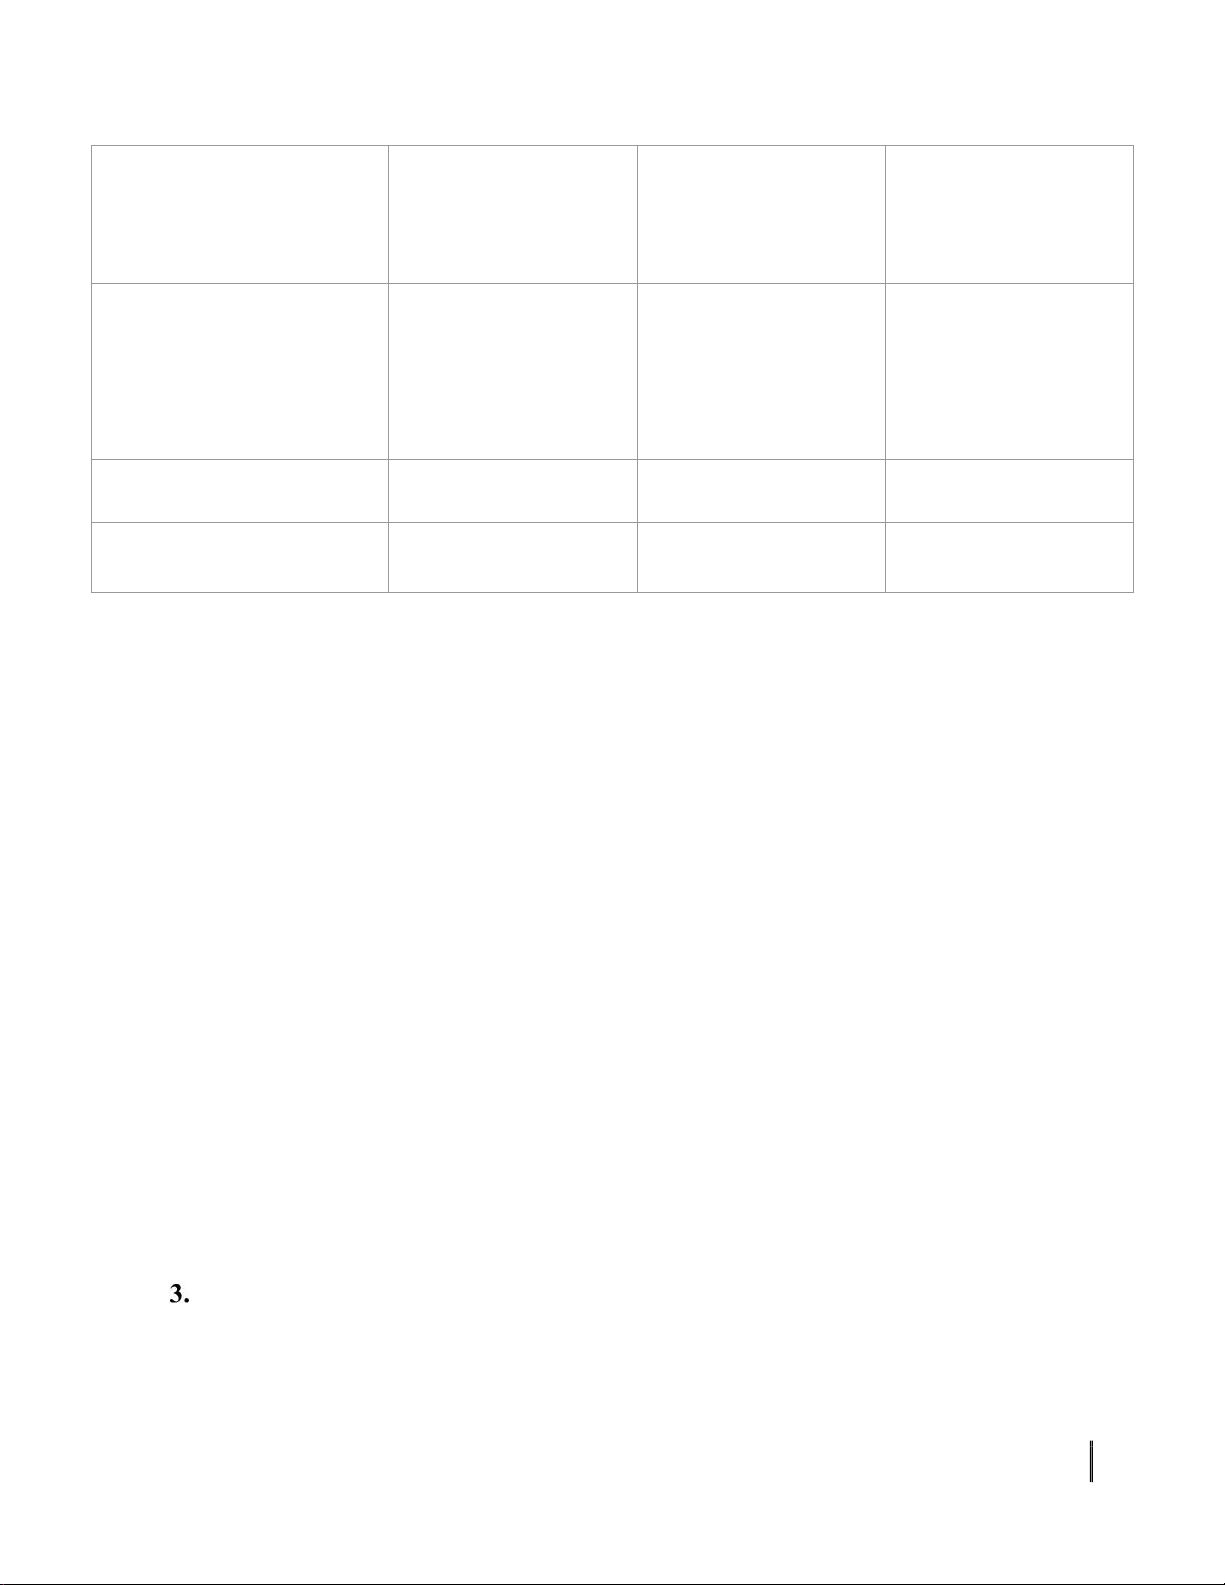
Table 1. Assets structure analysis (VNĐ) 2015 2016 2017 Targets Value % Value % Value % Cash and cash equivalent 158,033,536,811 3.08 162,262,526,033 3.42 112,445,561,513 2.32
Account receivable short - term 345,237,808,750 6.73 191,255,859,699 4.03 148,610,360,409 3.07 Inventories 584,127,530,033 11.39 605,911,632,594 12.78 887,772,653,895 18.34 Other current asset 20,448,157,537 0.40 16,986,765,547 0.36 26,561,492,457 0.55 Total current asset 1,107,847,033,131 21.60 976,416,783,873 20.59 1,175,390,068,274 24.28
Account receivable long - term 0 0.00 1,656,954,700 0.03 1,885,408,000 0.04 Fixed asset 3,908,873,293,284 76.20 3,666,295,448,650 77.33 3,390,097,896,602 70.04 Long - term unloaded assets 43,469,109,222 0.85 37,894,479,737 0.80 218,865,737,707 4.52 Other long - term asset 69,470,827,996 1.35 59,064,185,359 1.25 53,989,450,750 1.12 Total long - term asset 4,021,813,230,502 78.40 3,764,911,068,446 79.41 3,664,838,493,059 75.72 Total Asset 5,129,660,263,633 100.00 4,741,327,852,319 100.00 4,840,228,561,333 100.00
From Table 1, we have total assets that fluctuate over the years without a direction, in
which total current asset tend to increase in the structure of total assets, but total long-term
assets tend to decrease, detail:
Cash and cash equivalents: slightly increased from 2015-2016, but by 2017 it was
significantly reduced. This suggests that this item may increase (or decrease) not due to
stagnation (or lack of money) but may be because the business is planning to concentrate
money to prepare for procurement of supplies and assets, ... or because businesses have just
invested in a number of other business areas.
For account receivable short - term: decreasing gradually over the years, showing
that enterprises have capacity in debt management in the period of applying shortterm sales
credit policies. Similarly, account receivable long-term for only a small proportion of the total
assets and also increase only slightly.
Inventories accounted for the largest proportion of total current assets. It
increased slightly in the first two years but increased sharply over the third year. This may be
due to a decrease in the company's consumption or the company's products and goods are in
the growth phase, so inventory reserves are often high to meet the demand for market dominance.
Fixed assets accounted for the highest proportion in all 3 years, tended to
decrease, indicating that the company is gradually stabilizing production, limiting buying and
investing in new machinery and equipment.
Long-term unloaded assets from 2016 to 2017 increased strongly, indicating that the
company is still slowing in the process of finalizing finished products to stabilize business operations. lOMoAR cPSD| 50205883 Financial Analysis 42K18.2CLC
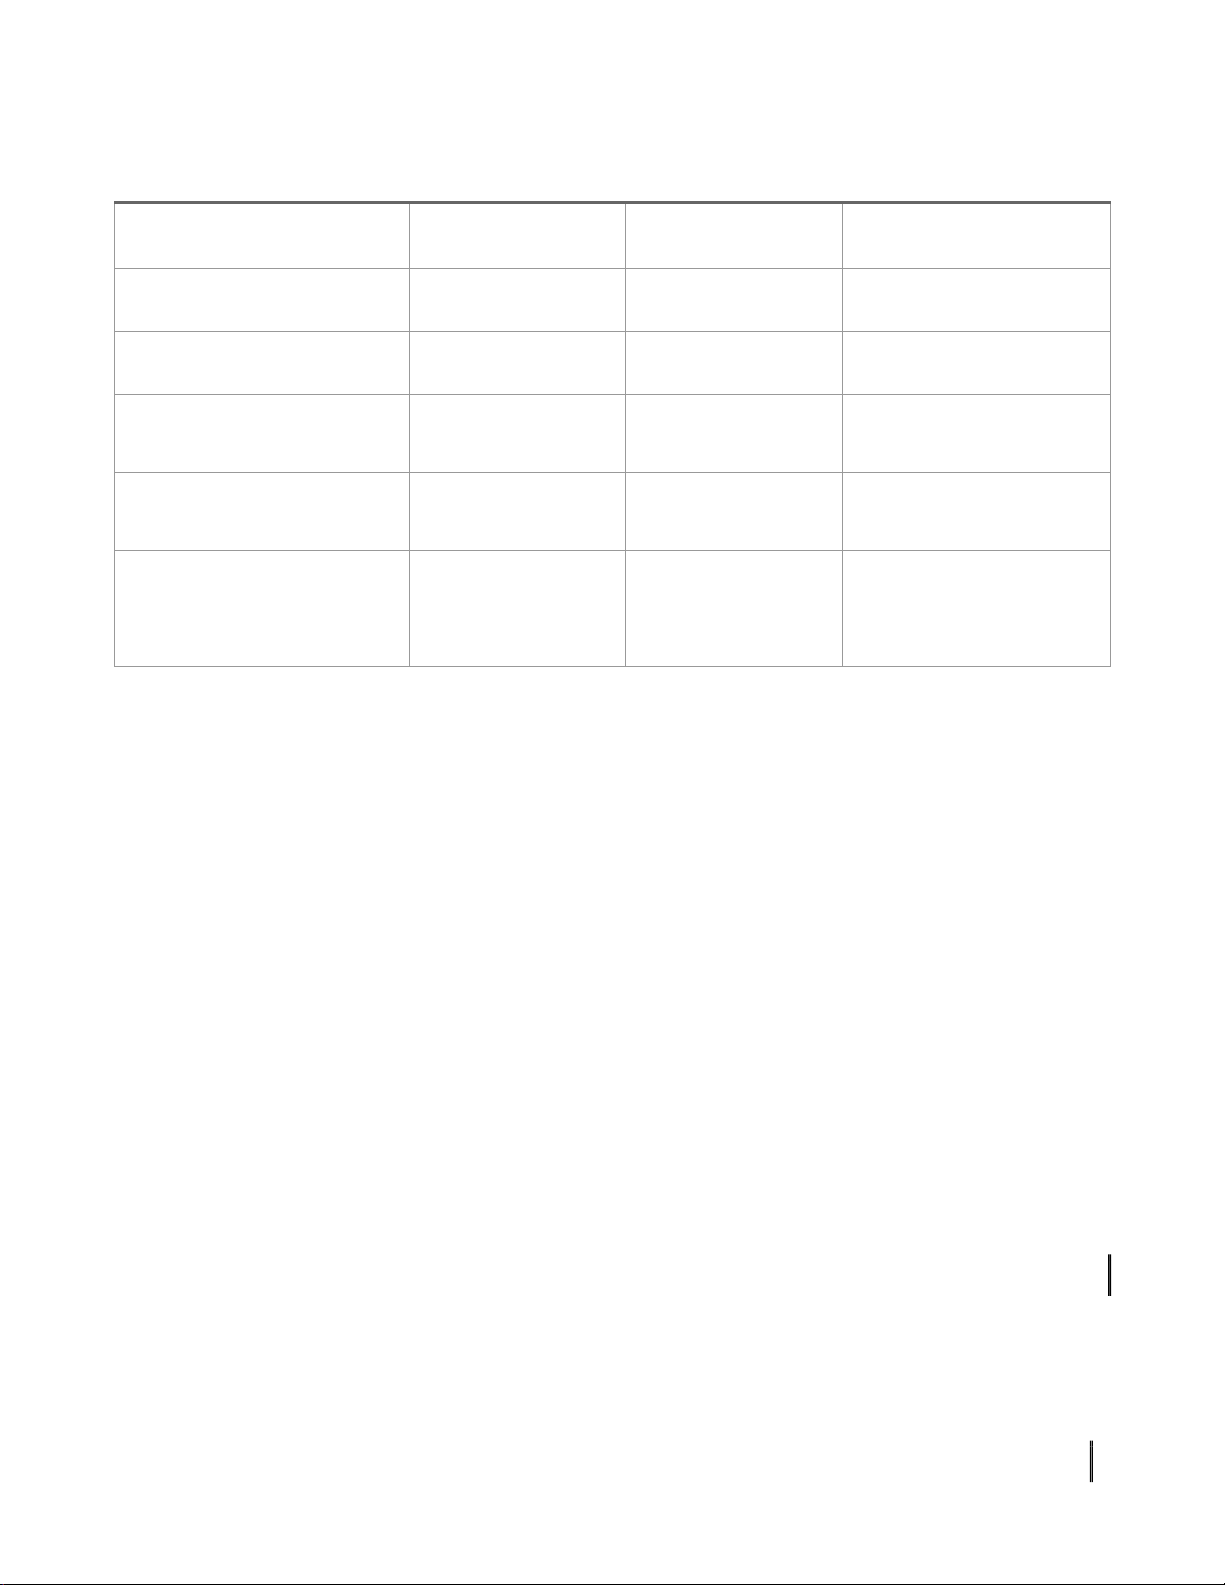
ANALYZE FINANCIAL AUTONOMY, FUND STABILITY AND FINANCIAL BALANCE OVER 3 YEARS 2.1. Financial Autonomy Table 2. Financial Autonomy TARGET 2015 2016 2017 lOMoARcPSD| 50205883 Total Liabilities
3,427,487,210,403 2,801,703,304,666 3,038,648,198,393 Total Owner’s Equity
1,702,173,053,230 1,939,624,547,653 1,801,580,362,940 Total Assets
5,129,660,263,633 4,741,327,852,319 4,840,228,561,333 Debt Ratio (𝟏) 66.82% 59.09% 62.78% 𝟏 Self-fund Ratio (𝟏) 33.18% 40,91% 37.22% 𝟏 Debt/Owner’s Equity Ratio (𝟏) 2.01 1.44 1.69 𝟏
Debt Ratio in 2016 decreased 7.73% compared to 2015 and decreased by 0.884 times.
The main reason was that the total liabilities decreased by VND 625,783,905,737. But 2017 debt
ratio increased 3.69% compared to 2016 and increased by 1.07 times due to total liabilities and
total assets increased. In 2016, the enterprise with the lowest debt ratio (59.09%) shows the
lower dependence of enterprises on creditors and higher autonomy. In 2015, the highest
increase in debt ratio means that enterprises depend on creditors so they had low autonomy.
The Self-fund Ratio in 2016 rose by 7.73% and increased by 1.23 times compared to 2015.
The main reason was that equity increased while total assets decreased by VND
388,332,411,314. But by 2017, the self-financing rate fell 3.69% and decreased by 0.91 times
due to lower equity and higher total assets. Thereby, in 2016, the self-fund rate increased the
highest in 3 years, proving that enterprises had a highly financial autonomy and less pressured by creditors.
Debt/Owner’s Equity Ratio in 2016 was lower than 0.57 and 0.71 times lower. The main
reason is due to the reduction of liabilities of VND 625,783,905,737 and equity increased 10
by VND 237,451,494,423. But by 2017, this rate increased due to the raise of liabilities while equity decreases. 13
- 2015: 1 dong of equity, guaranteeing for 2.01 dong of debt
- 2016: 1 dong of equity, guaranteeing for 1.44 dong of debt
- 2017: 1 dong of equity, guaranteeing for 1.69 dong of debt
We see the Debt/Owner’s Equity ratio over 3 years is greater than 1, meaning that the
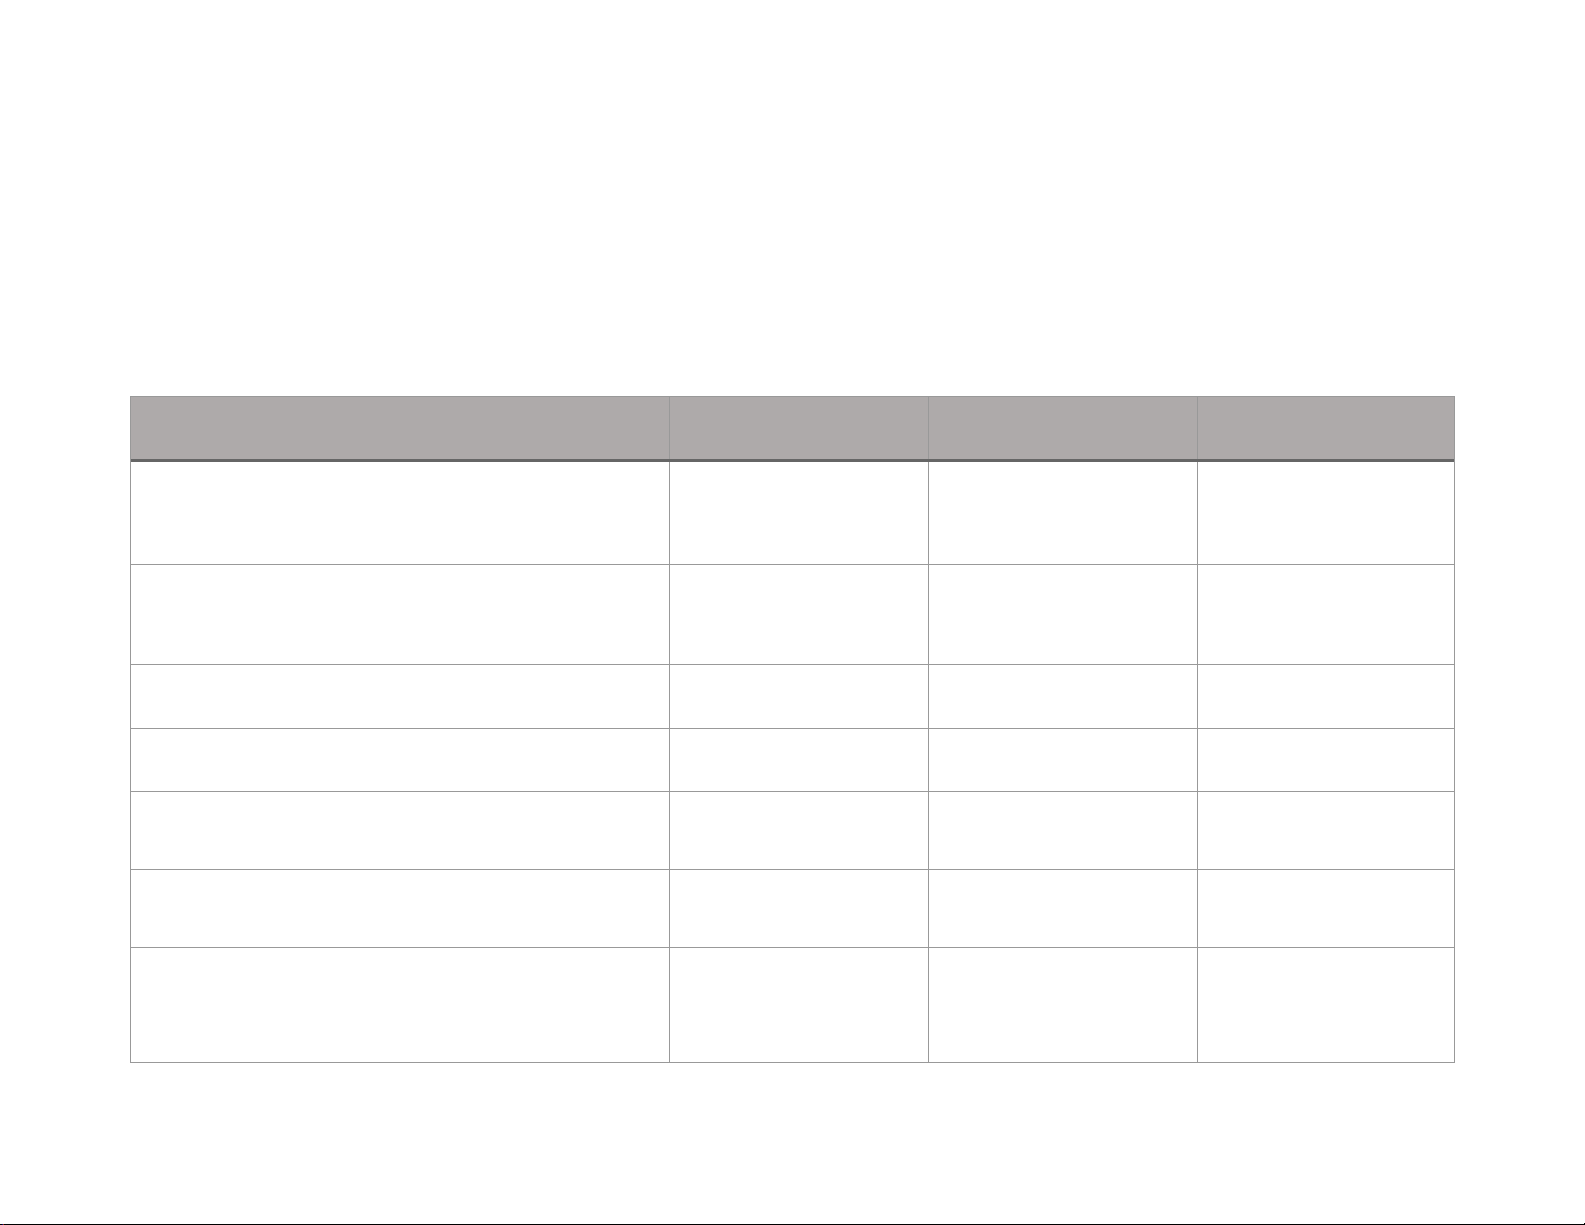
assets of the business were mainly financed by debts. lOMoAR cPSD| 50205883 Financial Analysis 42K18.2CLC 2.2. Fund Stability Table 3. Fund Stability TARGET 2015 2016 2017
Short-term Resources (Short-term 2,689,123,750,992 2,726,020,231,773 2,652,900,148,404 Liabilities)
Long-term Resources (=Long-term 2,440,536,512,641 2,015,307,620,546 2,187,328,412,929
Liabilities + Owner’s Equity) Owner’s Equity 1,702,173,053,230 1,939,624,547,653 1,801,580,362,940 Total Resources 5,129,660,263,633 4,741,327,852,319 4,840,228,561,333
Short-term Resources Ratio (𝟏) 52.42% 57.49% 54.81% 𝟏
Long-term Resources Ratio (𝟏) 47.58% 42.51% 45.19% 𝟏
Owner’s Equity/Long-term Resources Ratio (𝟏) 69.75% 96.24% 82.36% 𝟏
Short-term Resources Ratio and Owner’s Equity/Long-term Resources Ratio were highest growth in 2016, indicating
that the enterprise have the highest funding stability this year, ensure that short-term funds can be used to finance the
company's daily activities and use long-term resources for long-term investment and development. lOMoARcPSD| 50205883 2.3. Financial Balance
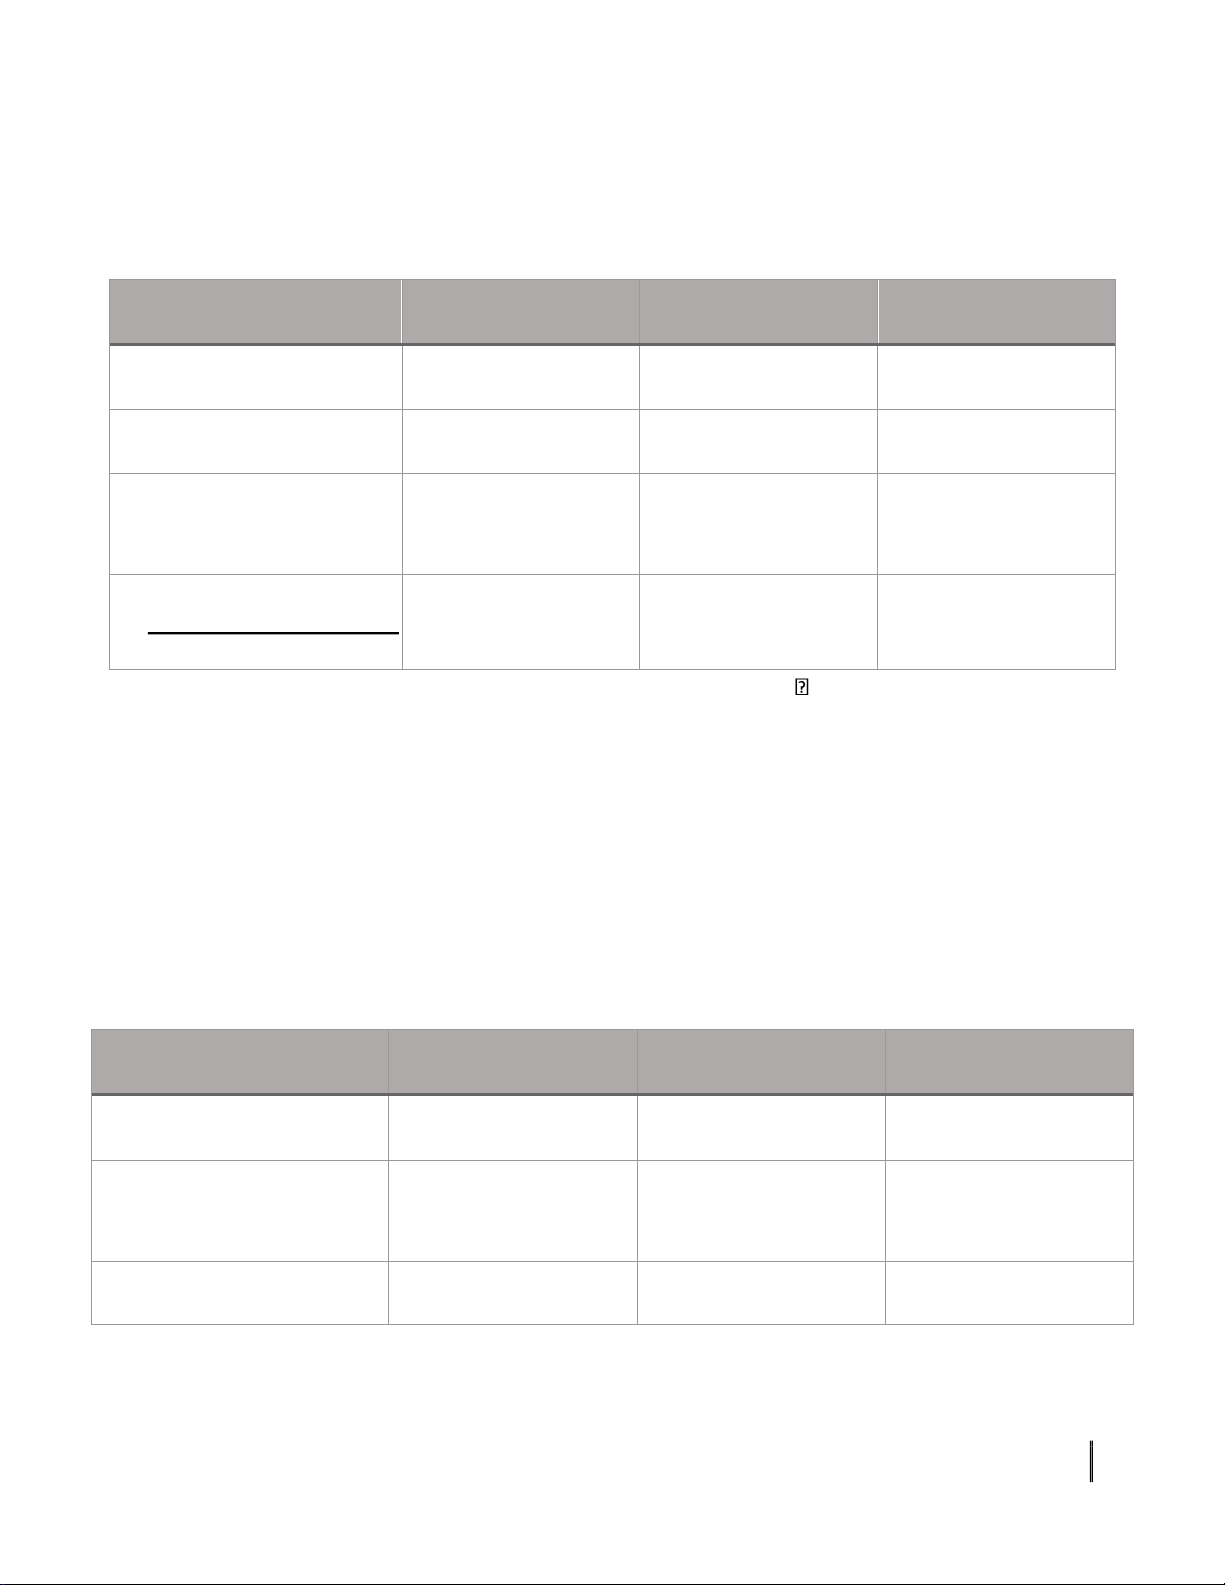
2.3.1 Long-term Financial Balance
Table 4. Long-term Financial Balance TARGET 2015 2016 2017 Long-term Resources 2,440,536,512,641 2,015,307,620,546 2,187,328,412,929 Long-term Assets 4,021,813,230,50 3,764,911,068,446 3,664,838,493,059
Net Working Capital = (1,581,276,717,861) (1,749,603,447,900) (1,477,510,080,130) (1) - (2) 𝟏𝟏𝟏𝟏
𝟏𝟏𝟏𝟏 𝟏𝟏𝟏𝟏𝟏𝟏𝟏𝟏𝟏 0.61 0.54 0.60
𝟏𝟏𝟏𝟏 𝟏𝟏𝟏𝟏 𝟏𝟏𝟏𝟏𝟏𝟏
Long-term Resources/Long-term Assets < 1 over 3 years Net Working Capital < 0. At
that time, long-term resources were not enough to finance for long-term assets, so the business
must use short-term capital to finance for the shortage by borrowing or appropriating capital
from outside. Therefore, the enterprise was financial imbalanced, had heavy pressure on short-
term debt payments. The smaller the working capital is, the more difficult it is for businesses to
pay short-term debts and risk bankruptcy.
2.3.2 Short-term Financial Balance
Table 5. Short-term Financial Balance TARGET 2015 2016 2017 Inventories 584,127,530,033 605,911,632,594 887,772,653,895 Accounts Receivable- 345,237,808,750 191,255,859,699 148,610,360,409 Short-Term Other Current Assets 20,448,157,537 16,986,765,547 26,561,492,457 17 lOMoARcPSD| 50205883 Current Liabilities (Excluding Interest 1,110,500,017,234 1,224,714,977,382 1,184,256,343,904 Bearing Liabilities) Net Working Capital Requirement (160,686,520,914) (410,560,719,542) (121,311,837,143) (NWCR) = (1) + (2) + (3) – (4) Net Working Capital
(1,581,276,717,861) (1,749,603,447,900) (1,477,510,080,130) Net Fund = (6) – (5)
(1,420,590,196,947) (1,339,042,728,358) (1,356,198,242,987)
Inventory of the enterprise increased steadily over 3 years from 584 billion to 887 billion,
this leads to two different ways of thinking. Firstly, the enterprise was hoarding inventories to
serve the production process and sales, avoiding the shortage of materials to disrupt the
production process or the shortage of goods to provide for customers. On the contrary, the
enterprise was in a state of non-optical business, inventory was stagnant due to poor trading
activities, high carrying cost.
Short-term Account Receivables had a sharp decline over the 3 years from 345 billion to
148 billion, indicating that businesses were not appropriated by customers, created an
improvement of cash flow in enterprises.
Other Current Assets slightly reduced but from 2016 to 2017, it had a strong increase
showed that the company is trying to promote investment in assets and improve business
efficiency. Current Liabilities (excluding interest bearing liabilities) fluctuates slightly over years.
Net Working Capital Requirement (NWCR) of the company is negative and unstable, showing
that financial distress and may be a sign of impending insolvency in short-term. Net Fund < 0:
Net Working Capital was not able to finance for the Net Working Capital Requirement in short-
term. The company had to borrow money in the short-term to meet the needs of funding. In a
word, the financial imbalance in the short-term.
ANALYZE THE FACTORS AFFECTING THE EFFICIENCY OF USING CURRENT ASSETS OVER 3 YEARS 18 lOMoARcPSD| 50205883
Business activities of enterprises are influenced by many different factors so to make a
financial decision, the financial managers of enterprises must identify them and consider the
factors affecting the problem. problem to solve. 3.1. Cash management.
Cash is understood as the cash balance, money on the payment account of the business
in the bank. Ensure daily transactions, compensate the bank for the bank providing services for
businesses to meet the reserve needs in case of unforeseen fluctuations of in and out flows,
enjoy advantages in negotiate purchase.
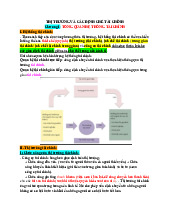
Following this table, cash ratio of the BBC company in 3 years 2015, 2016 & 2017 had even very low. Table 6. Cash Management 2015 2016 2017 Cash & Cash Equivalents 158,033,536,811 162,262,526,033 112,445,561,513
This situation helps reduce a cost of cash storage - the opportunity cost; is the interest
rate that the business is lost. If the higher the interest rate, the less cash the business will hold
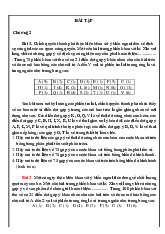
and vice versa, the higher the cost of selling securities, the more cash it will hold. 3.2. Inventory management: Table 7. Inventory management 2015 2016 2017 Cost of goods sold 3.377.946.800.581 3.417.723.237.173 3.062.683.250.276 Inventories in the beginning 445.263.104.977 585.658.770.946 605.911.632.594 Inventories in the ending 585.658.770.946 605.911.632.594 887.772.653.895 19
Tài liệu liên quan:
-
Tóm tắt lý thuyết - Môn Thị trường và các định chế tài chính - Đại Học Kinh Tế - Đại học Đà Nẵng
0.9 K 467 -
Bài tập - Môn Thị trường và các định chế tài chính - Đại Học Kinh Tế - Đại học Đà Nẵng
380 190 -
Top 95 câu trắc nghiệm - Môn Thị trường và các định chế tài chính - Đại Học Kinh Tế - Đại học Đà Nẵng
463 232 -
Top 110 câu trắc nghiệm - Môn Thị trường và các định chế tài chính - Đại Học Kinh Tế - Đại học Đà Nẵng
447 224 -
Đề số 8 - Môn Thị trường và các định chế tài chính - Đại Học Kinh Tế - Đại học Đà Nẵng
327 164