International Investment: Portfolio Diversification & FDI Insights | Tài chính quốc tế | Trường Học Viện nông nghiệp Việt Nam
In the early 1960s, international investment was viewed as being moti- vated by interest differentials among countries. If the interest rate in one country exceeded that of another, then financial capital was expected to flow between the countries until the rates were equal. Modern capital market theory provided a new basis for analysis.There were obvious prob- lems with the old theory, since interest differentials can explain one-way flows of capital, from the low- to the high-interest-rate country; yet,realistically, capital flows both ways between most pairs of countries. Tài liệu được sưu tầm và soạn thảo dưới dạng file PDF để gửi tới các bạn cùng tham khảo, ôn tập đầy đủ kiến thức, chuẩn bị cho các buổi học thật tốt. Mời bạn đọc đón xem!
Môn: Tài chính quốc tế (hvnn) 130 tài liệu
Trường: Học viện Nông nghiệp Việt Nam 2.4 K tài liệu
Tác giả:
Preview text:
CHAPTER 10
International Investment Contents Portfolio Diversification 191
Reasons for Incomplete Portfolio Diversification 195
International Investment Opportunities 197
The Globalization of Equity Markets 197 Foreign Direct Investment 201 Capital Flight 204 Capital Inflow Issues 205 Summary 206 Exercises 207 Further Reading 207
Appendix A American Depositary Receipts 208
In the early 1960s, international investment was viewed as being moti-
vated by interest differentials among countries. If the interest rate in one
country exceeded that of another, then financial capital was expected to
flow between the countries until the rates were equal. Modern capital
market theory provided a new basis for analysis. There were obvious prob-
lems with the old theory, since interest differentials can explain one-way
flows of capital, from the low- to the high-interest-rate country; yet, realis-
tically, capital flows both ways between most pairs of countries.
In this chapter, we apply some basic ideas of modern finance to under-
stand and analyze the incentives for international portfolio investment,
foreign direct investment, and capital flight.
PORTFOLIO DIVERSIFICATION
No doubt the differences in the returns on various countries’ assets pro-
vide an incentive for capital flows. However, we would not expect interest
rates to be equalized throughout the world, since risk differs from one asset
to another. Furthermore, we would anticipate a certain random compo-
nent in international capital flows, because money flows to new investment © 201 7 Elsevier Inc.
International Money and Finance. All rights reserved. 191 192
International Money and Finance
opportunities as they open up in various countries. Given the short time
needed to shift funds around the world, the expected profit (adjusted for
risk differences) from investing in different assets should be equal. If this
were not the case, then money would flow internationally until it was true.
Yet even with constant interest rates internationally, there would still
be an incentive for international capital flows. This additional incentive is
provided by the desire to hold diversified portfolios. It is this diversifica-
tion motive that leads to the two-way flows of capital between countries.
Besides the return on an investment, investors are concerned with the risk
attached to the investment. It is very unlikely that an individual who has
$100,000 to invest will invest the entire amount in one asset. By choosing
several investment alternatives and holding a diversified portfolio, the investor
can reduce the risk associated with his or her investments. Modern finan-
cial literature has emphasized the concept of variability of return as a mea-
sure of risk. This is reasonable in that investors are interested in the future
value of their portfolios, and the more variable the value of the portfolios,
the less certain they can be of the future value.
By diversifying and selecting different assets (including assets of differ-
ent countries) for a portfolio, we can reduce the variability of the port-
folio returns. To see the effects of diversification, let us consider a simple
example of an investor facing a world with two investment opportunities:
asset A and asset B. The investor will hold a portfolio of A and B, with the
share of the portfolio devoted to A denoted by a and the share devoted to
B denoted by b. The shares, a and b, are fractions of the portfolio between
0 and 1, where a + b = 1. Thus, if the investor holds only A, then a = 1
and b = 0. If only B is held, then a = 0 and b = 1. Most likely the investor
will choose some amount of diversification by holding both A and B.
The return on the portfolio (R ) can be written as a weighted average p
of the returns on the individual assets (R and ): A RB R = aR + bR p A B (10.1)
The expected future return on the portfolio will then be determined
by the expected future return in the individual assets: * * * R = aR + bR p A B (10.2)
where R * ,R * , and R * p A
B are the expected values of the portfolio and indi-
vidual asset returns, respectively. We said earlier that the idea of portfo-
lio risk was associated with the variability of the return on the portfolio. International Investment 193
The measure of the degree to which a variable deviates from its mean or
average value is known as the variance. The variance of the portfolio will
depend on the share of the portfolio held by each asset and the variance
of the individual assets, as well as their covariance. Specifically, 2 2
var(R ) = a var(R ) + b v ar(R ) + a
2 b cov(R ,R ) (10.3) p A B A B
where var stands for variance and cov stands for covariance. The covariance is
a measure of the degree to which the two assets move together. If, when
one return is higher than average, the return on the other asset is lower
than average, the covariance is negative. Looking at Eq. (10.3), we see that
a negative covariance could contribute greatly to reducing the overall
portfolio variance and, therefore, risk.
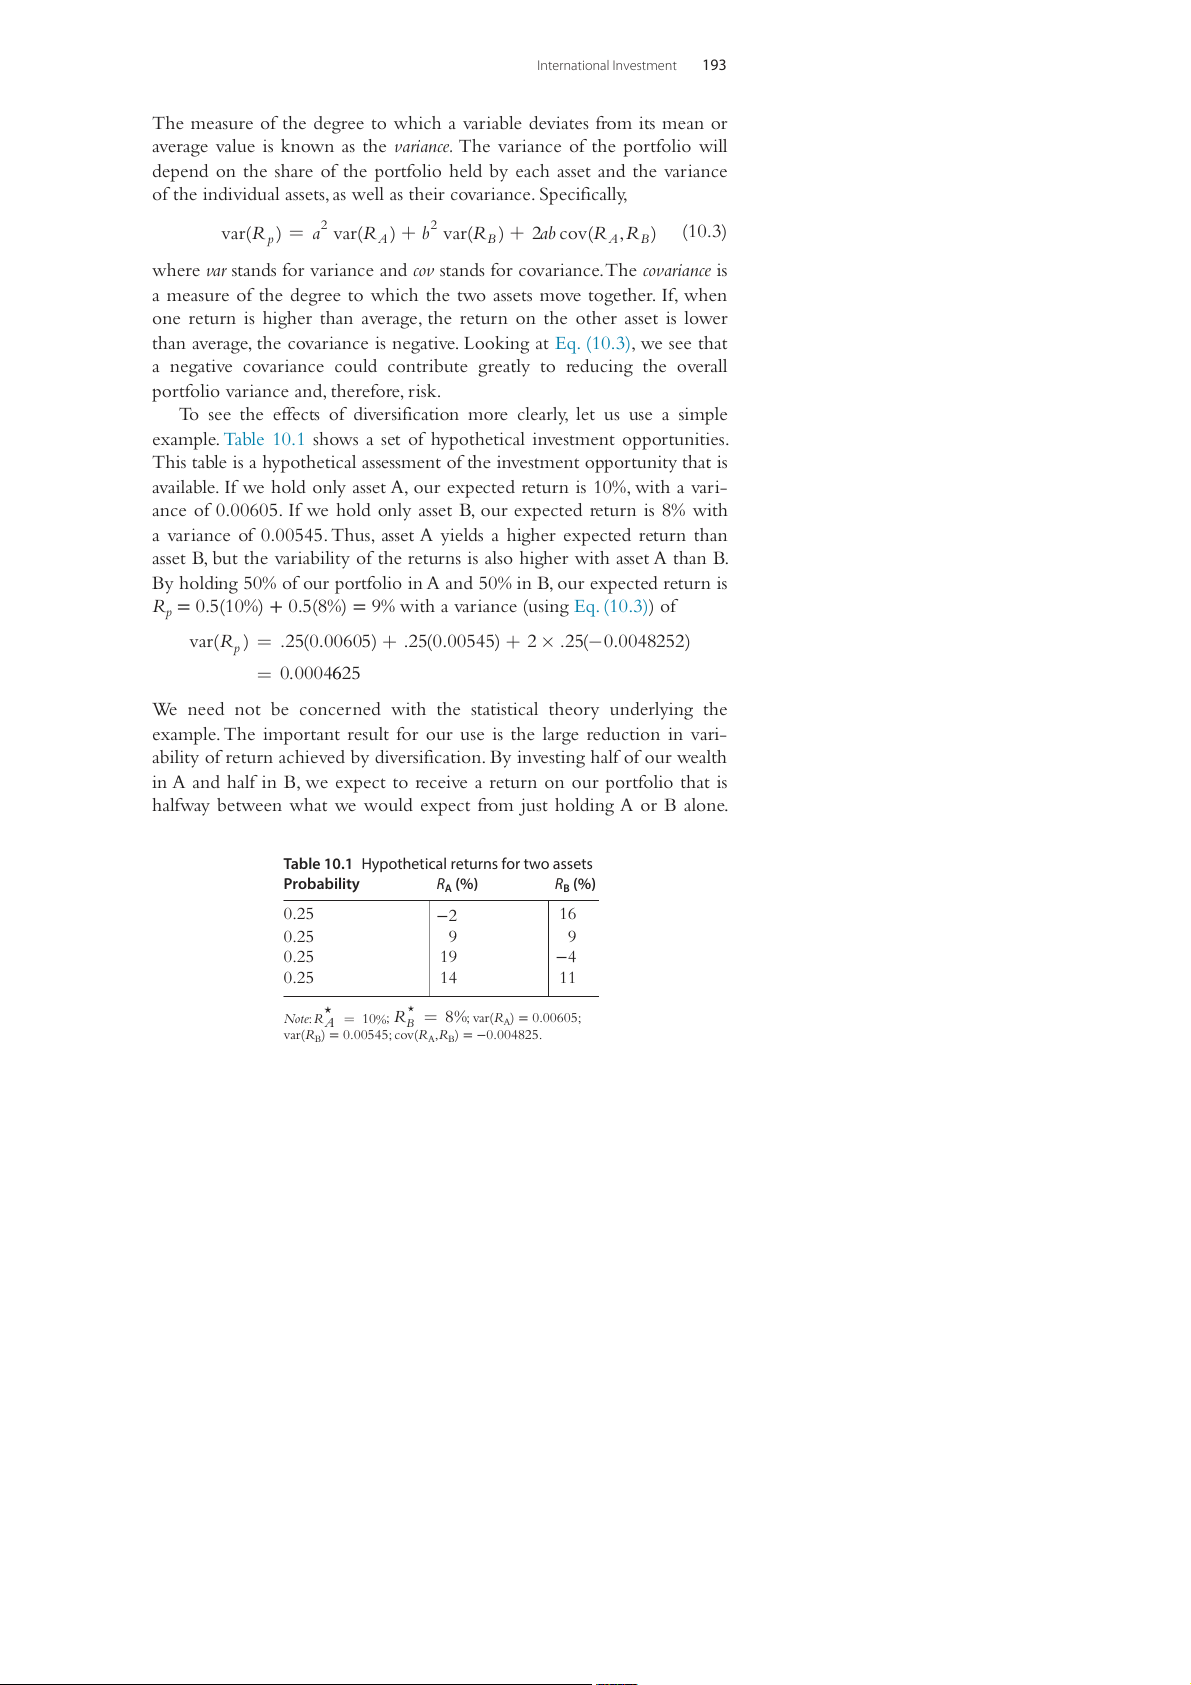
To see the effects of diversification more clearly, let us use a simple
example. Table 10.1 shows a set of hypothetical investment opportunities.
This table is a hypothetical assessment of the investment opportunity that is
available. If we hold only asset A, our expected return is 10%, with a vari-
ance of 0.00605. If we hold only asset B, our expected return is 8% with
a variance of 0.00545. Thus, asset A yields a higher expected return than
asset B, but the variability of the returns is also higher with asset A than B.
By holding 50% of our portfolio in A and 50% in B, our expected return is
Rp = 0.5(10%) + 0.5(8%) = 9% with a variance (using Eq. (10.3)) of var(R ) = .2 ( 5 . 0 00605) + .2 ( 5 0.0054 ) 5 + 2 × .2 ( 5 − . 0 0048252) p = . 0 0004625
We need not be concerned with the statistical theory underlying the
example. The important result for our use is the large reduction in vari-
ability of return achieved by diversification. By investing half of our wealth
in A and half in B, we expect to receive a return on our portfolio that is
halfway between what we would expect from just holding A or B alone.
Table 10.1 Hypothetical returns for two assets Probability RA (%) RB (%) 0.25 −2 16 0.25 9 9 0.25 19 −4 0.25 14 11 * * Note: RA = 1 % 0 ; R = B 8%; var(R ) 0.00605; A =
var(RB) = 0.00545; cov(R ) 0.004825. A,RB = − 194
International Money and Finance
However, the variance of our return is much less than half the variance of
either RA or R . The substantially lower risk achieved by diversification B
will lead investors to hold many different assets, including assets from dif- ferent countries.
As the size of the investor’s portfolio grows, the investor will want
to buy more assets in the proportions that are already held in order to
maintain the desired degree of diversification. This means that as wealth
increases, we could anticipate international capital flows between coun-
tries, as investors maintain these optimal portfolios. Thus, even with con-
stant international interest rates, we should expect to observe two-way
flows of capital as international wealth increases.
We should recognize that diversification will not eliminate all risk to
the investor, since there will still exist systematic risk—the risk present in
all investment opportunities. For instance, in the domestic context, we
know that different industries have different time patterns of performance.
While one industry is enjoying increasing sales and profits, another indus-
try might be languishing in the doldrums. Then, at some later period, the
reverse might be true, and the once-thriving industry is now the stagnant
one. This is similar to the example of opportunities A and B previously
presented. The negative covariance between them indicates that when one
is enjoying better-than-average times, the other is suffering, and vice versa.
Yet there is still a positive portfolio variance, even when we diversify and
hold both assets. The variance that can be eliminated through diversifica-
tion is called nonsystematic risk; this is the risk that is unique to a particular
firm or industry. Systematic risk is common to all firms and remains even
in diversified portfolios. Systematic risk results from events that are experi-
enced jointly by all firms, like the overall business cycle of recurrent peri-
ods of prosperity and recession that occur at the national level.
By extending our investment alternatives internationally, we can gain
by international diversification. There appears to be nonsystematic risk at
the national level that can be reduced with international portfolio diversi-
fication. Moreover, business cycles do not happen uniformly across coun-
tries, so when one country is experiencing rapid growth, another may
be in a recession. By investing across countries, we eliminate part of the
cyclical fluctuation in our portfolio that would arise from the domestic
business cycle. Therefore, some of what would be considered systematic
risk, in terms of strictly domestic investment opportunities, becomes non-
systematic risk when we broaden our opportunities to include foreign as
well as domestic investment. Thus, we can say that not only will investors International Investment 195
tend to diversify their portfolio holdings across industries, but they can
also realize additional gains by diversifying across countries.
One might wonder whether the gains from international diversification
could be realized by investing in domestic multinational firms. If we con-
sider a multinational firm—a firm doing business in many countries—to
be affected significantly by foreign factors, then we may view multinational
stock as similar to an international portfolio. Since multinational firms have
operations in many countries, we may hypothesize that multinational stock
prices behave more like an internationally diversified portfolio than like
just another domestic stock. The evidence indicates that domestic multina-
tional firms are poor substitutes for international diversification. While the
variability of returns from a portfolio of US multinational stock tends to
be somewhat lower than the variability of a portfolio of purely domestic-
oriented stocks, a portfolio invested across different national stock markets
can reduce portfolio return variance by substantially more.
REASONS FOR INCOMPLETE PORTFOLIO DIVERSIFICATION
Many studies have demonstrated the gain from international diversifica-
tion. However, recent research has indicated that investors seem to greatly
favor domestic assets and invest much less in foreign assets than one would
expect given the expected gains from diversification. Tesar and Werner
(1995) examined the foreign investment positions of major industrial coun-
tries for the 1970–90 period and found that international investment as a
fraction of the total domestic market for stocks and bonds equaled about
3% for the United States, 4% for Canada, 10% for Germany, 11% for Japan,
and 32% for the United Kingdom. Calculations of an “optimal” investment
portfolio would have much higher fractions devoted to international assets.
Recent studies have shown an increase in the international investment
positions, but nowhere near the levels of an “optimal” investment portfo-
lio. For example, Ferreira and Miguel (2011) show that the foreign bond
position for the 1997–2009 period was slightly above 4% for the United
States, 5% for Canada, 25% for Germany, 21% for Japan, and 47% for the
United Kingdom. In general, EMU countries had a high international
investment position, with Ireland leading the sample of countries with a
91% international investment. However, the international investment for
the European Monetary Union (EMU) countries was only 12%, implying
that many of the “foreign” purchases of EMU countries were with other EMU countries. 196
International Money and Finance
Why do investors seem to have this bias in favor of domestic secu-
rities? There are several possible reasons: taxes, transaction costs, or
something else that is missing from the standard model of international
investment. Let us consider the alternatives in turn:
1. Taxes. If home bias is due to taxes, then the tax on foreign securities
would have to be high enough to offset the higher return (or lower
risk) expected from these securities. However, taxes paid to foreign
governments can usually be credited against domestic taxes. Even if
there is some net increase in the tax paid on foreign investment, it is
unlikely that this increase could be high enough to discourage foreign
investment to the extent observed.
2. Transaction costs. The cost associated with buying and selling foreign
securities includes explicit monetary costs, like fees, commissions, and
bid-ask spreads, and implicit costs such as differences in regulations pro-
tecting investors, language differences, and costs of obtaining informa-
tion about foreign investment opportunities. Familiarity with domestic
assets and lower explicit costs of trading at home may lead to home bias.
3. What else? One possibility is that the gains from international diver-
sification have been overstated. If countries tend to specialize in the
production of certain goods and services and trade with the rest of
the world for other goods and services, it is possible to imagine a sit-
uation where incomes fluctuate less than one might think based on
fluctuations in domestic production. As output fluctuates for certain
industries, relative prices change and this relative price change helps
to smooth out income fluctuations. For instance, if the Philippines
specializes in pineapple production and bad weather reduces the har-
vest, pineapple prices rise due to the reduction in supply. This price
increase helps to cushion the fall in income related to the poor har-
vest. In this manner, relative price changes may serve as a natural hedge
against output fluctuations, so that there is less income variability to be
reduced through diversification.
The puzzle of home bias has not been answered adequately. It may be
that there is no answer that can be related easily to financial models of
investment. The surprisingly low level of international securities in invest-
ment portfolios may reflect investors’ decisions to hold undiversified
portfolios, both internationally as well as domestically. Further research is
needed to understand these issues better.
Although the investor risk considered so far has focused on the vari-
ability of portfolio return, it should be realized that in international International Investment 197
investment there is always the potential for political risk, which may
involve the confiscation of foreigners’ assets. The next chapter will con-
sider the analysis of such risk and includes a recent ranking of countries in
terms of the perceived political risk attached to investments made in that country.
INTERNATIONAL INVESTMENT OPPORTUNITIES
As with domestic markets, there are international investment opportu-
nities in stocks, bonds, and mutual funds. The United States is the larg-
est market. Ferreira and Miguel (2011) show that the United States has
a share of 41.3% of the world’s bond market, with Japan a distant second
with 14.2%, followed by Germany with 6.7%. The differences in size of
the various national markets can (and does at times) prove problematic for
investors seeking to trade quickly in the smaller markets.
A good example of the problems that can arise in turbulent times is
provided by the stock market collapse of October 1987. In mid-Octo-
ber, prices collapsed dramatically in all stock markets around the world.
The price fall brought huge orders to sell stocks as investors liquidated
their positions and mutual funds raised cash to pay off customers’ redemp-
tion requests. Stock exchanges in the United States are relatively deep—
meaning that there are enough potential buyers and sellers and a large
number of securities traded so that the market permits trading at all times.
Other markets are relatively thin—with a much smaller number of poten-
tial buyers and sellers and a smaller volume of securities traded.
During the stock market collapse in 1987, the New York Stock
Exchange was able to trade 600 million shares, while markets in Hong
Kong, Singapore, Italy, Spain, France, and Germany were not as liquid. In
fact, at the peak of the trading frenzy, the Hong Kong market closed for a
week. Can you imagine the frustration of a US portfolio manager wanting
to sell shares in Hong Kong while trading has stopped?
THE GLOBALIZATION OF EQUITY MARKETS
If we go back to just a couple of decades ago, many countries had equity
(stock) markets that were segmented. A segmented market is one in which
foreign investors are not allowed to buy domestic stocks and domes-
tic investors are not allowed to buy foreign stocks. Part of the process of
the globalization of world economies is the liberalization of stock market 198
International Money and Finance
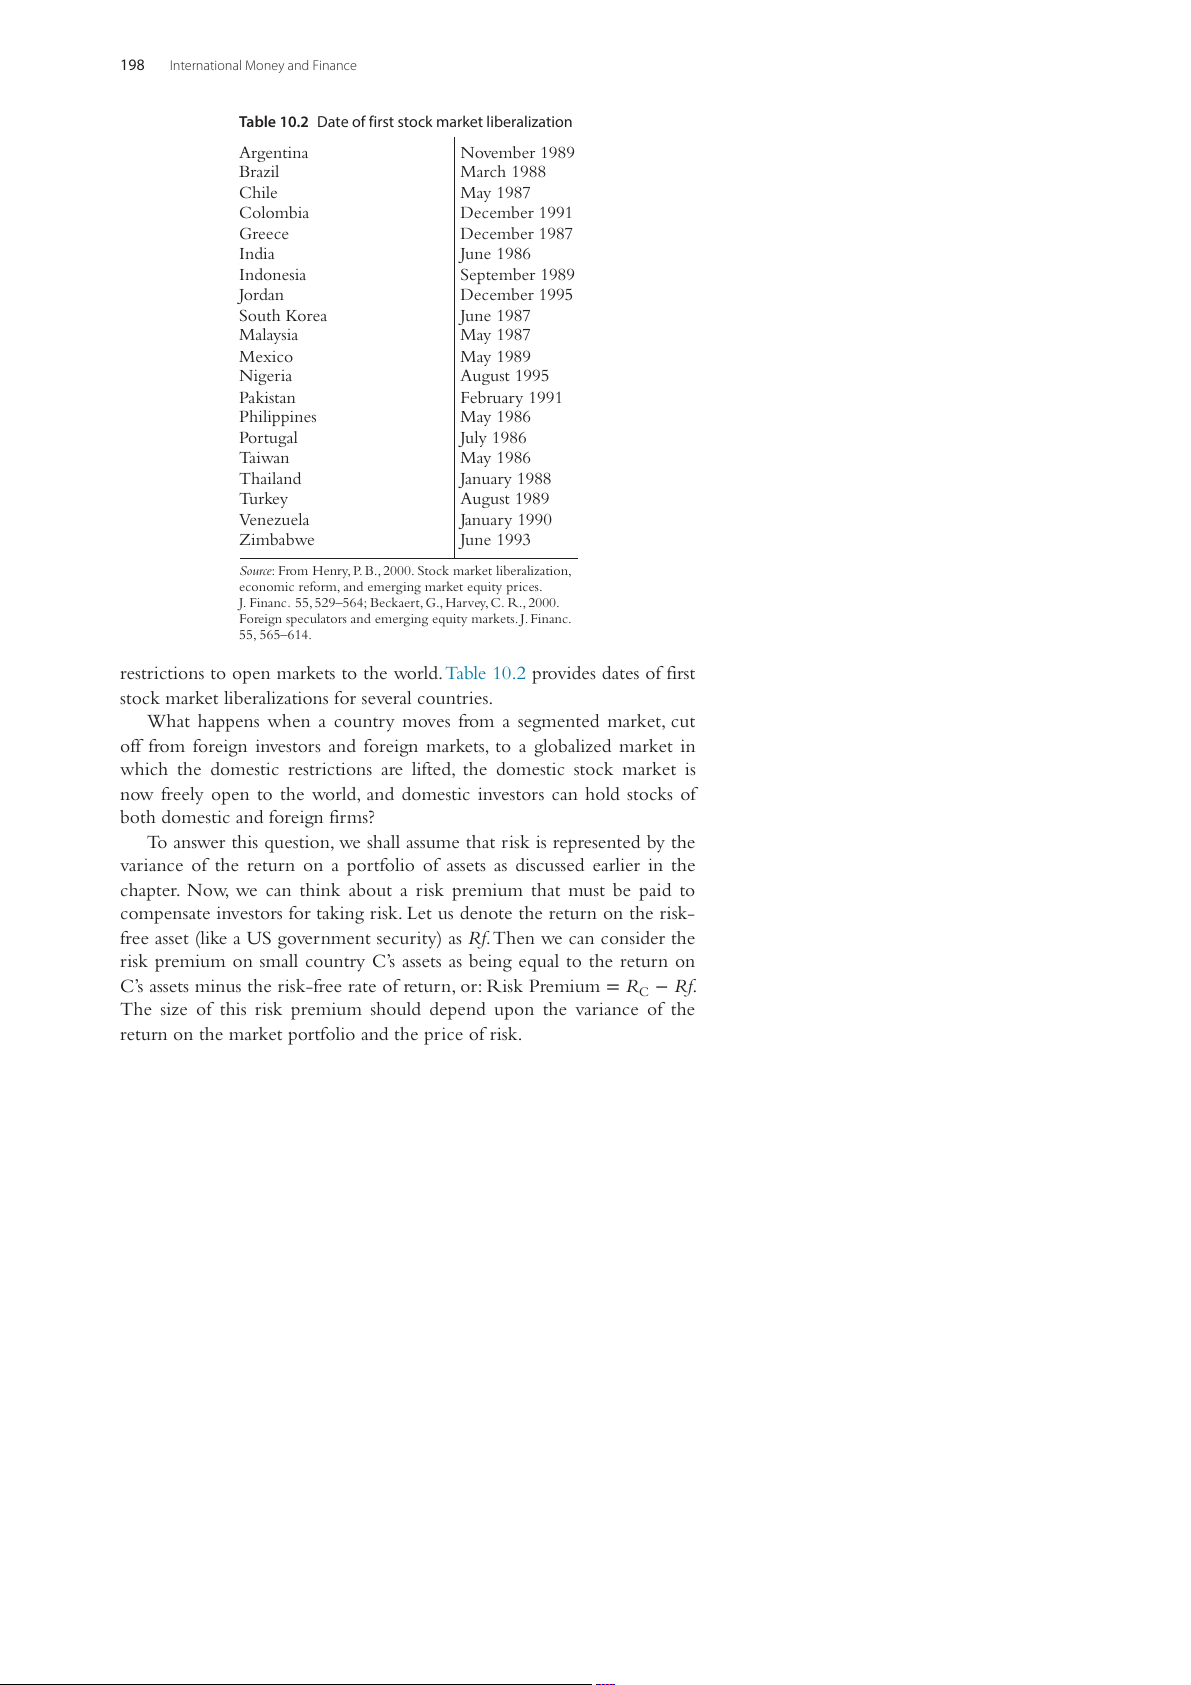
Table 10.2 Date of first stock market liberalization Argentina November 1989 Brazil March 1988 Chile May 1987 Colombia December 1991 Greece December 1987 India June 1986 Indonesia September 1989 Jordan December 1995 South Korea June 1987 Malaysia May 1987 Mexico May 1989 Nigeria August 1995 Pakistan February 1991 Philippines May 1986 Portugal July 1986 Taiwan May 1986 Thailand January 1988 Turkey August 1989 Venezuela January 1990 Zimbabwe June 1993
Source: From Henry, P. B., 2000. Stock market liberalization,
economic reform, and emerging market equity prices.
J. Financ. 55, 529–564; Beckaert, G., Harvey, C. R., 2000.
Foreign speculators and emerging equity markets. J. Financ. 55, 565–614.
restrictions to open markets to the world. Table 10.2 provides dates of first
stock market liberalizations for several countries.
What happens when a country moves from a segmented market, cut
off from foreign investors and foreign markets, to a globalized market in
which the domestic restrictions are lifted, the domestic stock market is
now freely open to the world, and domestic investors can hold stocks of
both domestic and foreign firms?
To answer this question, we shall assume that risk is represented by the
variance of the return on a portfolio of assets as discussed earlier in the
chapter. Now, we can think about a risk premium that must be paid to
compensate investors for taking risk. Let us denote the return on the risk-
free asset (like a US government security) as Rf. Then we can consider the
risk premium on small country C’s assets as being equal to the return on
C’s assets minus the risk-free rate of return, or: Risk Premium = RC − Rf.
The size of this risk premium should depend upon the variance of the
return on the market portfolio and the price of risk. International Investment 199
In a segmented market, the variance of returns is just the variance of
the domestic market return, so the risk premium before globalization is:
Risk Premium in segment ed market = P var[RC ] (10.4)
where P is the price of risk. So, the risk premium required on domestic
stocks in segmented financial market C will just depend upon the vari-
ance of stock prices in country C multiplied by the price of risk P. P is
determined by the degree of risk aversion of investors. If all investors are
the same everywhere, then P is a constant across countries. In a world of
segmented markets, a country with a variance of returns twice as high as
another country would have twice the risk premium on its stocks. This
risk premium is what investors require in order to willingly hold shares of the stocks.
In the globalized equity market we can think of the portfolio return
volatility for the residents of small country C as the variance of a portfo-
lio comprised of the stocks of country C and the stocks of the rest of the
world. Using the formula for portfolio variance introduced earlier in the chapter, this would be: 2 2
Var[R ] = w var[R ] + c v
ar[R ] + 2wc cov[R , R ] (10.5) p w C w C
where w and c are the fraction of the portfolio devoted to stocks from the
rest of the world and the small country, respectively; RW and RC are the
returns on the stocks of the rest of the world and small country C, respec-
tively. Eq. (10.5) shows that the variance of the portfolio is determined by
the amount invested in each area, the variance of returns on the stocks of the
two areas, and the covariance between the returns on the two kinds of stocks.
If country C is a segmented market, then the portfolio return variance
would just be equal to the variance of the return on country C stocks as
in Eq. (10.4), as w would equal zero and c would equal one. Now, think
what would happen if the government of country C would liberalize its
financial markets to become more globalized. The risk premium on C’s
stock should depend upon the contribution of C’s stock to the variance
of the world portfolio, which is given by the covariance of the return on
stock in country C with the returns in the rest of the world, or
Risk Premium in globalized m arket = P cov[R ,R W C ] (10.6)
Should we expect the risk premium on country C stock to rise or fall with
globalization? To answer that question, compare Eqs. (10.4) and (10.6). For 200
International Money and Finance
globalization to reduce the risk premium on country C, we need var(RC) >
cov(RW, RC). Note that the square root of the variance is known as the
standard deviation (SD). So SD(RC) is equal to the sqrt(var(RC)). The SD is
just another measure of how a variable deviates from its mean or average
value. What is useful for our purposes is that the covariance is equal to the
correlation coefficient between two variables multiplied by the product of
their SDs, or cov(RW, RC) = ρSD(RW)SD(RC) where ρ is the correlation
coefficient. The correlation coefficient is a number between 1 and −1 that
indicates how these two variables change together. If ρ = 1, then the two
variables are perfectly correlated and move together about their respective means. If ρ = −
1, then the two variables are perfectly negatively correlated
and move exactly opposite to each other, so that when one is above its
mean value, the other is below its mean value. If ρ = 0, then the two vari-
ables are independent and have no relationship.
Now we can find the conditions under which globalizing a financial mar-
ket will reduce the risk premium on a country’s stock. Comparing Eqs. (10.4)
and (10.6) again, we need var(RC) > cov(RW, RC), which may be written as:
var(R ) > ρSD (R )SD(R C W C) (10.7)
If we divide both sides of this inequality by SD(R 1 W)SD(RC), we have:
SD(R )/SD( R ) > C W ρ (10.8)
So the risk premium on country C stock will fall with globalization,
if the ratio of the SD of the stock returns in C to the stock returns in the
rest of the world is greater than the correlation coefficient between the
two. Since SDs are always positive, if the correlation coefficient is negative,
then this must always be true. In this case, country C stock prices would
tend to rise when the rest-of-the-world stock prices tend to fall, and the
risk premium on C’s stock will always fall with globalization. In general,
we need a relatively small ρ and a large SD(R ) relative to SD( C RW). This is,
in fact, what one usually observes in the world. Small countries with seg-
mented stock markets typically have relatively small correlations of their
stock prices with the rest of the world. In addition, the volatility of their
stock prices tends to be high relative to rest-of-the-world volatility. So, in
general, we expect that when a government liberalizes its financial markets
to become globalized, or integrated with the rest of the world, the risk premium on its stock falls.
1 Note that var(R ) (SD( so that var( R )) SD( C = RC))2 RC)/(SD( )SD( W RC = RC)/SD(R ). W International Investment 201
This, then, points out a major benefit of globalized financial markets:
A lower risk premium on domestic financial assets allows domestic firms
to lower their cost of capital. The cost of capital is what firms have to pay
investors to raise new funds. If a domestic firm sells new shares of stock,
then the lower the risk premium, the smaller dividends or cash flows the
firm must pay stockholders. This allows firms to raise money more cheaply
and will allow greater investment spending and expansion than otherwise.
FOREIGN DIRECT INVESTMENT
The previous sections have dealt with international portfolio investment. A
particular type of portfolio investment is labeled Foreign Direct Investment
(FDI). FDI is the spending by a domestic firm to establish foreign operat-
ing units. In the US balance of payments, direct investment is distinguished
from portfolio investment solely on the basis of percentage of ownership.
Capital flows are designated as FDI when a foreign entity owns 10% or
more of a firm, regardless of whether the capital flows are used to purchase
a new plant and equipment or to buy an ownership position in an existing
firm. The growth of FDI spending corresponds to the growth of the mul-
tinational firm. Although FDI is properly emphasized in international trade
discussions of the international movement of factors of production, students
should be able to distinguish portfolio investment from direct investment.
The motives for portfolio investment are easily seen in terms of the
risk and return concepts already examined. In a general sense, the con-
cern with a firm’s return, subject to risk considerations, may be thought
of as motivating all firm decisions, including those of direct investment.
However, a literature has developed to offer more specific motives for
desiring domestic ownership of foreign production facilities. Theories of
FDI typically explain the incentive for such investment in terms of some
imperfection in free-market conditions. If markets were perfectly compet-
itive, the domestic firm could just as well buy foreign securities to trans-
fer capital abroad rather than actually establishing a foreign operating unit.
One line of theorizing on foreign investment is that individual firms may
not attempt to maximize profits, which would be in the interest of the
firm’s stockholders; instead, they would attempt to maximize growth in
terms of firm size. This is a concept that relies on an oligopolistic form of
industry that would allow a firm to survive without maximizing profits. In
this case, FDI is preferred since domestic firms cannot depend on foreign-
managed firms to operate in the domestic firm’s best interests. 202
International Money and Finance
Other theories of FDI are based on the domestic firm possessing supe-
rior skills, knowledge, or information as compared to foreign firms. Such
advantages would allow the foreign subsidiary of the domestic firm to
earn a higher return than is possible by a foreign-managed firm.
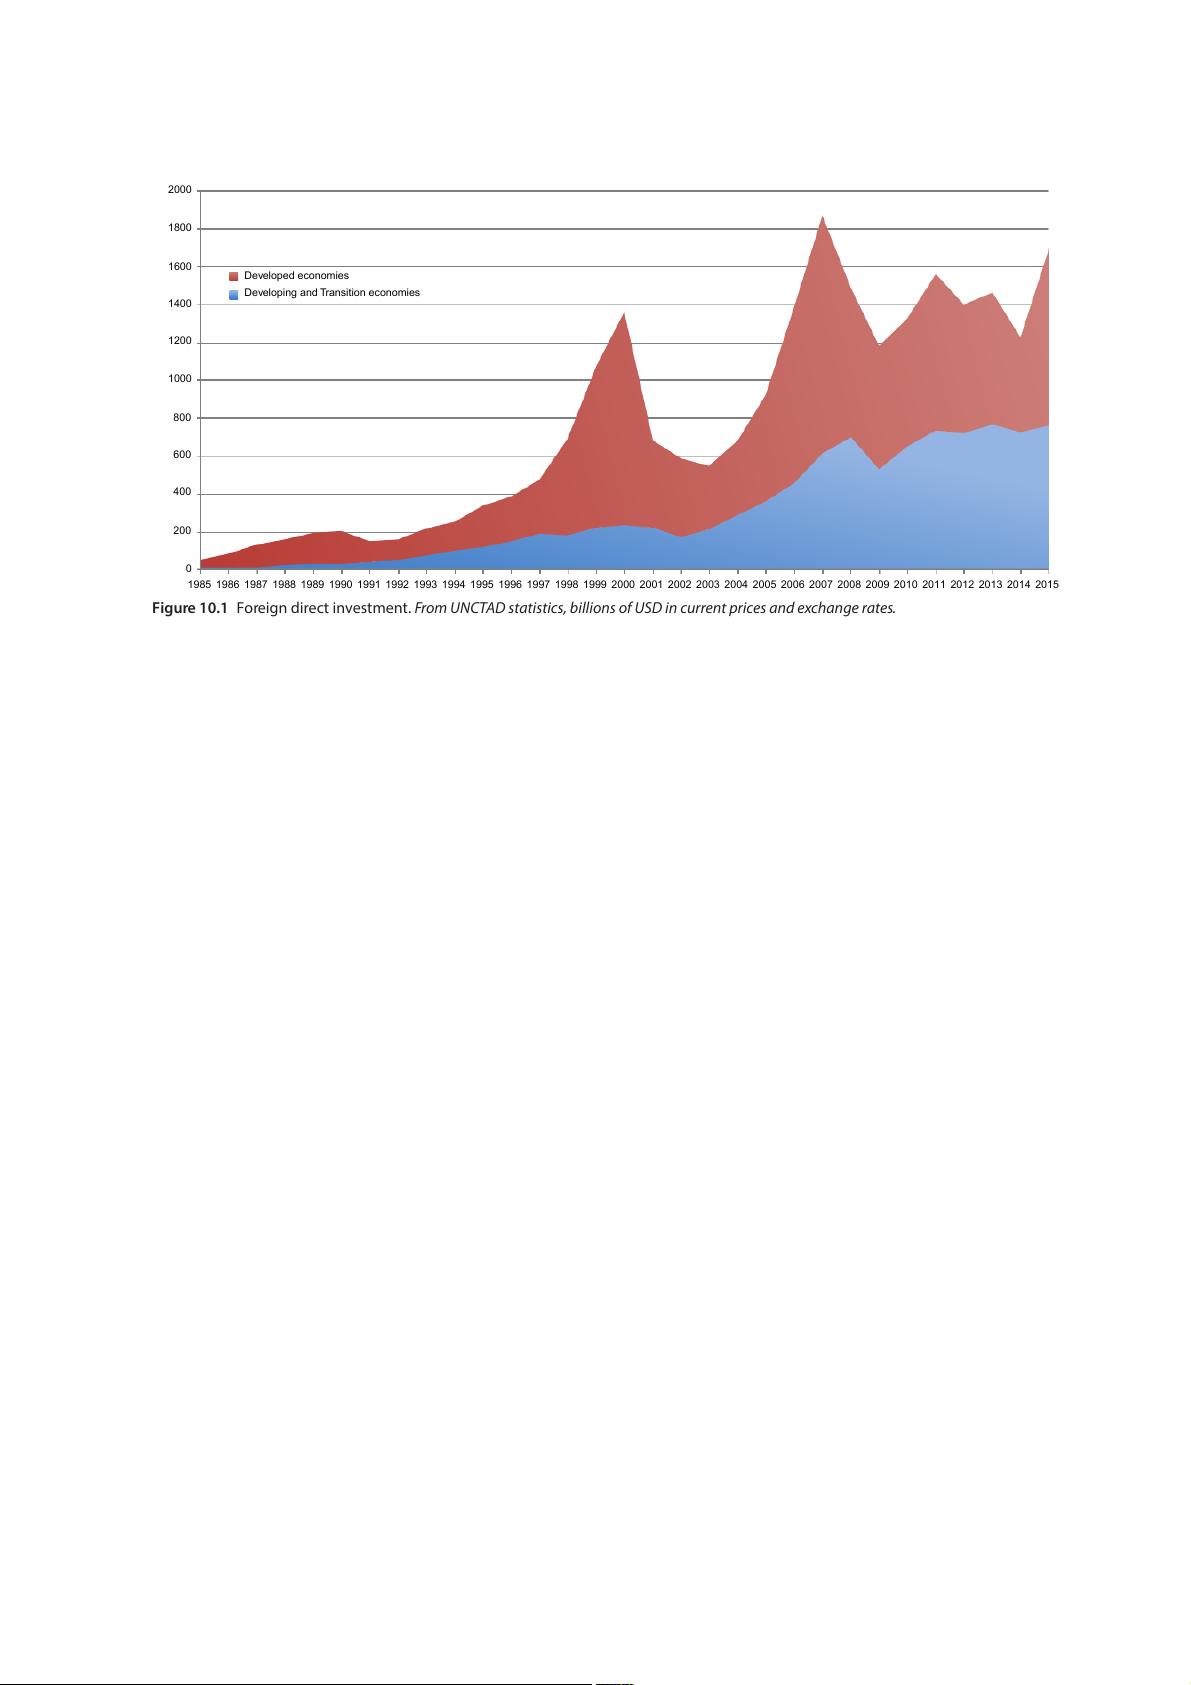
FDI has become an increasingly important source of finance for both
developing and developed countries. Fig. 10.1 illustrates how inflows of
FDI to developed and developing countries have changed in recent times.
Developing and transition economies have seen a fairly steady upward
trend on FDI inflows during the 1990–2015 period, except following the
US recessions of 2000 and 2008. Fig. 10.1 also shows an upward trend
in FDI in the developed countries. In addition to the trend, there are
two periods of higher than usual investment. From the mid-1990s to the
end of the 1990s, Europe and the United States saw a sharp increase in
the investment flow. This has been called the “the great IT investment
boom.” A similar boom occurred about 2003–07 and was associated
with increased housing speculative activity. Also here Europe and the
United States were the favorite targets for the investment flows. By 2009
the investment boom had disappeared and FDI appears to be back at its
normal trend. Recently FDI has increased, especially in 2015. However,
this increase is not due to an increase in new FDI (greenfield investment
projects). Instead it is mainly due to mergers and acquisitions and restruc- turing of companies.
FDI occurs in both developing and developed countries. Fig. 10.1
shows that in most years the FDI is slightly larger in the developing and
transition countries as opposed to developed economies. However, in
2015 developing economies experienced a substantially higher FDI at
$936 billion compared to $764 billion for the developing and transition
nations. The dominance of FDI in developed countries is mainly due to
mergers and acquisitions, and due to a slowdown in investment in the
BRIC countries (Brazil, Russia, India, and China).
FDI is often politically unpopular in developing countries, and increas-
ingly so also in developed countries, because it is associated with an ele-
ment of foreign control over domestic resources. Nationalist sentiment,
combined with a fear of exploitation, has often resulted in laws restricting
direct investment. Although FDI is feared, it may be very beneficial for
countries. FDI may contribute more to economic development than do
bank loans, since more of the funds go to actual investment in productive
resources. In contrast, bank loans to sovereign governments were (and are)
often used for consumption spending rather than investment. If foreign 2000 1800 1600 Developed economies
Developing and Transition economies 1400 1200 1000 800 600 400 200 0
1985 1986 1987 1988 1989 1990 1991 1992 1993 1994 1995 1996 1997 1998 1999 2000 2001 2002 2003 2004 2005 2006 2007 2008 2009 2010 2011 2012 2013 2014 2015
Figure 10.1 Foreign direct investment. From UNCTAD statistics, billions of USD in current prices and exchange rates. 204
International Money and Finance
firms make a bad decision regarding an FDI, the loss is sustained by the
foreign firm, and no repayment would be necessary. In contrast, if the
domestic government uses bank loans inefficiently, the country still faces
a repayment obligation to the foreign banks. In addition, FDI may involve
an adoption of new technologies and productive expertise not available
in the domestic economy. Empirical work has shown benefits of FDI for
developing nations, but some argue that the primary benefit may be the
greatest contribution of FDI. For example, Wang and Wang (2015) found
that Chinese companies benefitted more from the access to global finan-
cial markets rather than the adoption of new technologies. CAPITAL FLIGHT
In the discussion of portfolio investment, we emphasized expected risk
and return as determinants of foreign investment. When the risk of doing
business in a country rises sharply or the expected return falls, we some-
times observe large outflows of investment funds so that the country
experiences massive capital account deficits. Such net outflows of funds
are often descriptively referred to as capital flight. The change in the risk–
return relationship that gives rise to capital flight may be the result of
political or financial crisis, tightening capital controls, tax increases, or fear
of a domestic currency devaluation.
One of the issues arising from the developing-country debt crisis of
the 1980s was an assertion by bankers that some of the borrowed money
was not put to use in the debtor nations but, instead, was misappropriated
by individuals and deposited back in the developed countries. In addition
to allegedly misappropriated funds, wealthy individuals and business firms
often shipped capital out of the debtor nations at the same time that these
nations were pleading for additional funds from developed-country banks.
It is estimated that over the period from 1977 to 1987, $20 billion
of flight capital left Argentina. This $20 billion is almost half of the debt,
totaling $46 billion, that was incurred through 1984. The data suggest a
crude interpretation that for every $1 borrowed by Argentina, about 50
cents came out of the country as flight capital. Similar statements might
be made for other countries. An important aspect of the capital outflows
is that fewer resources are available at home to service the debt, and more
borrowing is required. In addition, capital flight may be associated with a
loss of international reserves and greater pressure for devaluation of the domestic currency. International Investment 205
The discussion of capital flight highlights the importance of economic
and political stability for encouraging domestic investment. Business
firms and individuals respond to lower risk and higher return. The sta-
ble and growing developing country faces little, if any, capital flight and
attracts foreign capital to aid in expanding the productive capacity of the economy. CAPITAL INFLOW ISSUES
The early 1990s were characterized by a surge of capital inflows to devel-
oping countries. Interest in countries with emerging financial markets
stimulated both direct and portfolio investment in these countries. The
inflows were welcome in that they helped poor countries finance domes-
tic infrastructure to aid in development, and they provided additional
opportunities for international diversification for investors. However, some
countries that experienced particularly large capital inflows exhibited
problems that could reduce the positive effects of the capital flows.
A large capital inflow in a short period of time can lead to an apprecia-
tion of the recipient country’s currency. This appreciation may reduce the
competitiveness of the nation’s export industries and cause a fall in output
and rise in unemployment in these industries. We learned in Chapter 3,
The Balance of Payments that a large rise in the capital account surplus
will be accompanied by a large rise in the current account deficit. The
capital inflow may also be associated with a rapid increase in the coun-
try’s money supply, which would create inflationary conditions. As a result
of potential problems associated with capital inflows, some countries have
imposed policies aimed at limiting the effects of these inflows.
Fiscal restraint is a policy of cutting government expenditures, or rais-
ing taxes, so that the expansionary effect of the capital flows is partially
offset by the contractionary fiscal policy. Chile, Malaysia, and Thailand
followed such policies. Many countries have used some sort of exchange
rate policy measures. Generally, these involved an appreciation of the cur-
rency in countries where the exchange rate has maintained little flexibil-
ity. Allowing the currency to appreciate may hurt export industries, but
it allows the money supply to be insulated from the capital flow so that
inflationary monetary policy does not occur. Some countries also per-
mitted greater exchange rate flexibility as a way to insulate the domes-
tic money supply from the capital flows. Some countries imposed capital
controls to limit the inflow of capital. Such measures include taxes and 206
International Money and Finance
quantity quotas on capital flows, increased reserve requirements on bank
borrowing in foreign currency, or limits on foreign exchange transactions.
Overall, the experience of the 1990s has created an awareness that cap-
ital inflows can be both a blessing and a curse. The attempts to manage the
risks associated with such inflows have met with varied degrees of success,
and further studies of the experiences of countries that followed different
policies will yield suggestions for appropriate government policy measures. SUMMARY
1. Portfolio diversification explains the two-way flow of capital between
countries, even when interest rates are equalized among countries.
2. The variability of returns on a portfolio is measured by variance,
which is the degree of deviations from the average value. The smaller
the variance, the more certain the returns on the portfolio.
3. By including various assets in the portfolio, investors can reduce the
variability of the portfolio’s returns.
4. Portfolio diversification eliminates the nonsystematic risk that is
unique to an individual asset. The systematic risk, which is commonly
shared by all assets, still remains.
5. The home-bias puzzle of portfolio diversification indicates that inves-
tors prefer to hold a large proportion of domestic assets in their port-
folios, even though by holding some international assets they could
reduce the variability of the portfolio’s returns.
6. Some possible explanations for the home-bias portfolio puzzle are:
(1) different taxes between home and foreign assets, (2) higher trans-
actions (information) costs of foreign assets, and (3) overestimated
benefits of international diversification.
7. Before financial liberalization in the 1980s, stock markets in many
countries were segmented markets, which did not allow foreign
investors to buy/sell domestic stocks and domestic investors to buy/ sell foreign stocks.
8. After liberalization, many financial markets become globalized. The
globalized financial market will reduce the risk premium of a home
country’s assets, if the ratio of SDs of the asset returns in the home
country to the rest-of-the-world asset returns is greater than the cor-
relation coefficient between home and international assets.
9. FDI is the capital flow of investment to acquire 10% or more of vot- ing stocks of a firm abroad. International Investment 207
10. The motives for ownership of foreign operations can be explained
by imperfect competitive market conditions and superior expertise of the domestic firm.
11. There have been two episodes of sharp increases in FDI in Europe
and the United States during the late 1990s and 2003–07. The first
investment surge was the “Great IT Investment Boom” and the sec-
ond one was due to the housing market boom.
12. Capital flight is the sudden outflow of funds. It is usually an outcome
of political instability, financial crisis, or a fear of currency devaluation.
13. A rapid increase in capital inflow could harm an economy. It could
cause an appreciation of the recipient country’s currency and reduce
competitiveness of exporting industries. EXERCISES
1. Explain how investment flows can be motivated by interest rate differ-
entials and still allow two-way capital flows between countries.
2. What is the difference between systematic and nonsystematic risk? Give examples of both risks.
3. Explain how portfolio diversification can reduce risk.
4. Explain why US portfolios do not have a large enough international diversification.
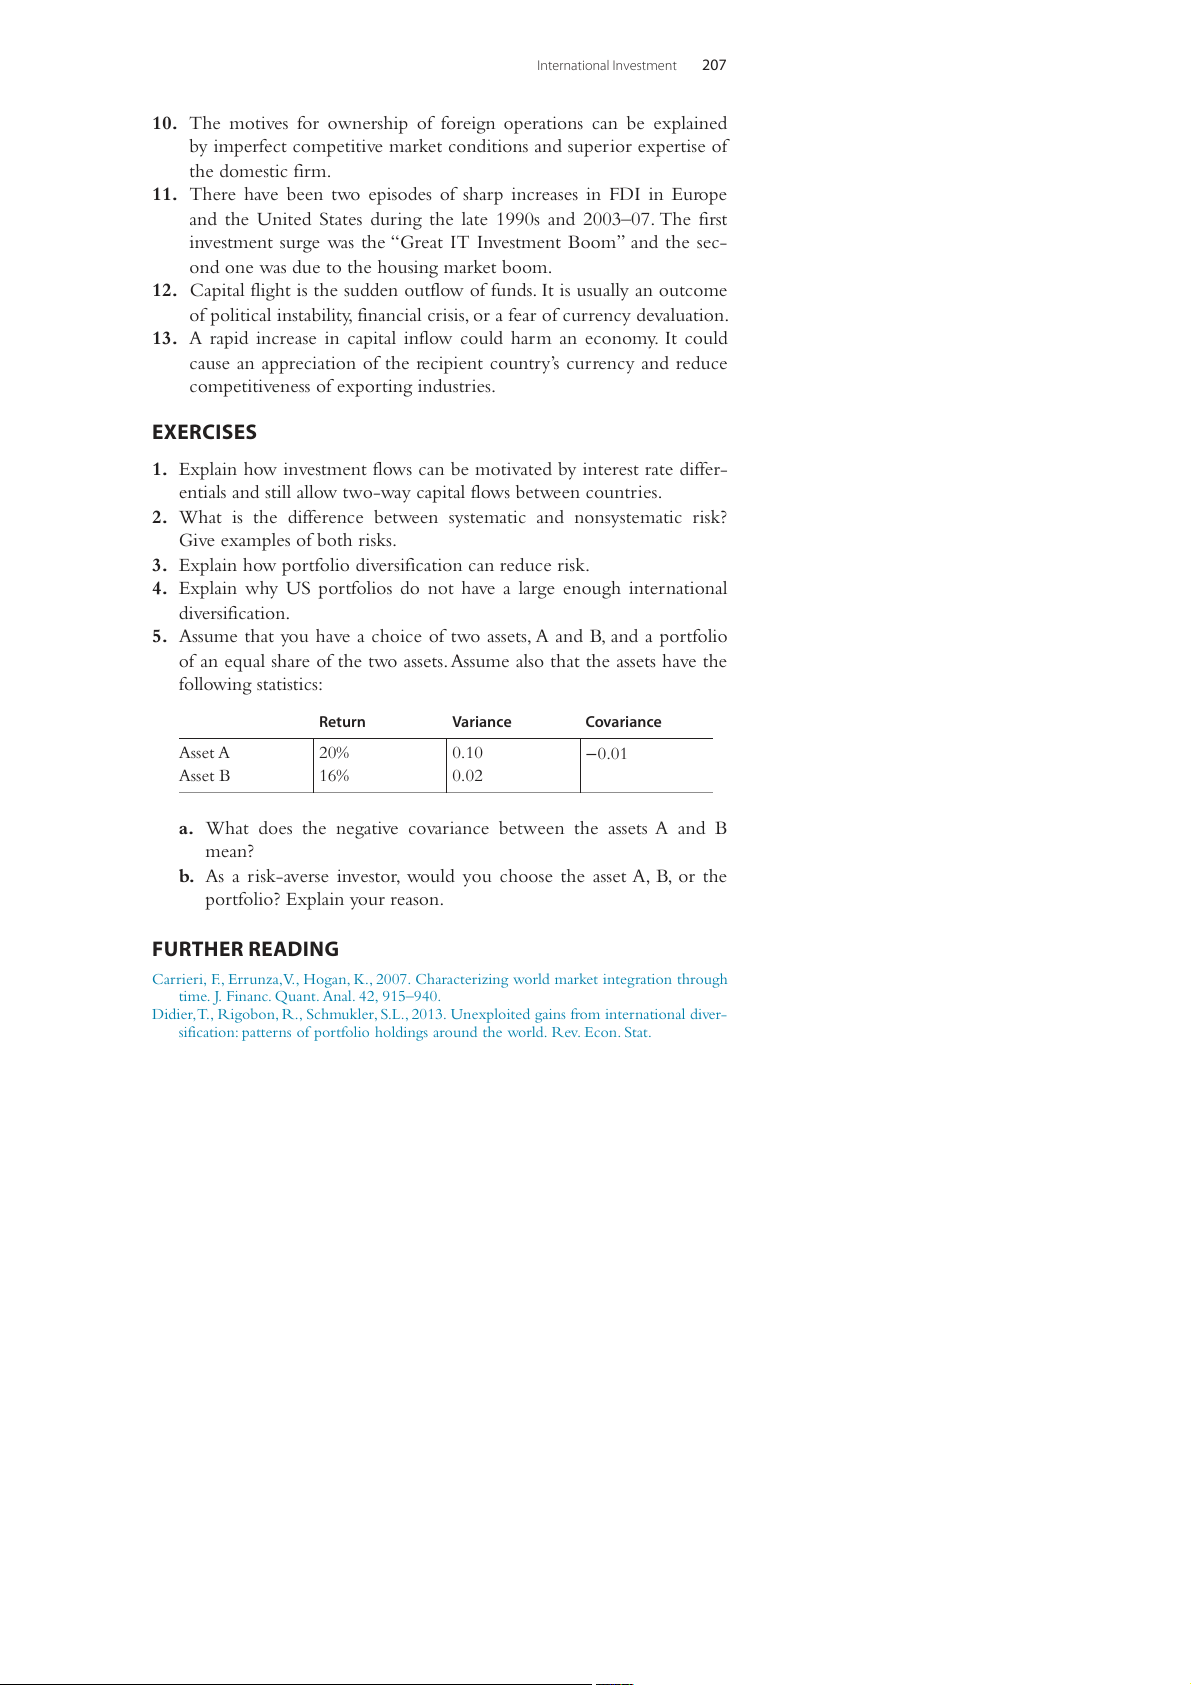
5. Assume that you have a choice of two assets, A and B, and a portfolio
of an equal share of the two assets. Assume also that the assets have the following statistics: Return Variance Covariance Asset A 20% 0.10 −0.01 Asset B 16% 0.02
a. What does the negative covariance between the assets A and B mean?
b. As a risk-averse investor, would you choose the asset A, B, or the
portfolio? Explain your reason. FURTHER READING
Carrieri, F., Errunza, V., Hogan, K., 2007. Characterizing world market integration through
time. J. Financ. Quant. Anal. 42, 915–940.
Didier, T., Rigobon, R., Schmukler, S.L., 2013. Unexploited gains from international diver-
sification: patterns of portfolio holdings around the world. Rev. Econ. Stat. 208
International Money and Finance
Ferreira, M.A., Miguel, A.F., 2011. The determinants of domestic and foreign bond bias.
J. of Multinational Financ. Management. 21 (5).
Foerster, S.R., Karolyi, G.A., 1999. The effects of market segmentation and investor recogni-
tion on asset prices: evidence from foreign stocks listing in the United States. J. Financ. June.
Hasan, I., Simaan, Y., 2000. A rational explanation for home country bias. J. Int. Money Financ. June.
International Monetary Fund, 1997. Developing countries get more private investment, less aid. Financ. Dev.
Kasa, K., 1994. Measuring the gains from international portfolio diversification. FRBSF Wkly. Lett.
Kho, B., Stulz, R.M., Warnock, F., 2009. Financial globalization, governance, and the evolu-
tion of the home bias. J. Account. Res. 47 (2), 597–635.
Kim, Y., 2000. Causes of capital flows in developing countries. J. Int. Money Financ. April
Stulz, R.M., 1999. Globalization, corporate finance, and the cost of capital. J. Appl. Corp. Financ. 12 (3), 8–25.
Tesar, L.L., Werner, I.M., 1995. Home bias and high turnover. J. Int. Money Financ.
Wang, J., Wang, X., 2015. Benefits of foreign ownership: evidence from foreign direct invest-
ment in China. J. Int. Econ. 97 (2).
APPENDIX A AMERICAN DEPOSITARY RECEIPTS
It is not always necessary to transfer funds abroad to buy foreign securi-
ties. Many foreign stocks are traded in the United States in the form of
American depositary receipts (ADRs). ADRs are negotiable instruments cer-
tifying that shares of a foreign stock are being held by a foreign custo-
dian. ADRs are popular because they offer an easy way for US investors to
diversify internationally and allow non-US firms access to raising money
in the United States. Even though these stocks are bought and sold on
the US market, they are still subject to foreign exchange risk because the
dollar price of the ADR shares reflects the dollar value of the foreign cur-
rency price of the stock in the foreign country of origin. Furthermore,
foreign government policy will have an impact on the value of ADRs. For
instance, in April 1987, the British government imposed a 5% tax on con-
version of British stocks into ADRs. Trading in these ADRs dropped dra-
matically until the British government reduced the tax.
Firms that list their stocks as ADRs have some choice as to what type of
listing they desire. The available types of ADR programs include the following: ● Level I ADR ●
No requirement to file financial statements that conform to US accounting standards. ●
Traded in the so-called over-the-counter (OTC) market and are
not traded on an exchange like NASDAQ or the New York Stock Exchange. International Investment 209 ●
Created from existing shares in foreign market; no new capital can be raised. ● Level II ADR ●
Must file financial statements conforming to US accounting standards. ●
Traded on organized exchanges like NASDAQ or the New York Stock Exchange. ●
Created from existing shares in foreign market; no new capital can be raised. ● Level III ADR ●
Must file financial statements conforming to US accounting standards. ●
Trade on organized exchanges like NASDAQ or the New York Stock Exchange. ●
New issues of stock in order to raise new capital for firm. ● Rule 144A ADR ●
No requirement to file financial statements conforming to US accounting standards. ●
Not traded on OTC or exchanges; strictly for private trades among
qualified institutional buyers. ●
New issues of stock in order to raise new capital for firm.
In addition to ADRs, there are also global depositary receipts (GDRs),
which are traded in more than one market location. For instance, a firm
may have a GDR that is traded in the United States, London, and Tokyo.
Why do non-US firms list their shares in the United States? The US
listing provides the following benefits: an enlarged investor base, the ability
to raise new capital in the world’s largest financial market, and lower trans-
action costs than in the home market. In addition, a firm generally finds
that the price of its home market shares rises with a US listing. This is
likely due to the greater liquidity of trade in the firm’s stock, meaning that
there are more counterparties with which to trade and the ease of buying
or selling at a good price is enhanced. In addition, a firm that is located
in a country with weak accounting standards sends a signal to investors of
its quality when it lists in the United States and files financial statements
conforming to US accounting standards. In addition, non-US firms may
list on a US exchange to use the ADR as a means to take over a US firm.
For instance, when Daimler Benz bought Chrysler Corporation, Daimler
exchanged ADRs for shares of Chrysler stock.
Tài liệu liên quan:
-

Hoạt động Tài chính của Doanh nghiệp Đa Quốc Gia (DN) - Chương 6 | Tài chính quốc tế | Trường Học Viện nông nghiệp Việt Nam
19 10 -

Hệ Thống Tiền Tệ Quốc Tế: Khái Niệm và Các Chế Độ Tỷ Giá | Tài chính quốc tế | Trường Học Viện nông nghiệp Việt Nam
24 12 -

Bài giảng Chương 1: Các Quan Hệ Cân Bằng Quốc Tế và LOP | Tài chính quốc tế | Trường Học Viện nông nghiệp Việt Nam
21 11 -

Cách Tính Lạm Phát và CPI: So Sánh Việt Nam và Mỹ | Tài chính quốc tế | Trường Học Viện nông nghiệp Việt Nam
23 12 -

Detailed Report and Analysis on Submission Trends | Tài chính quốc tế | Trường Học Viện nông nghiệp Việt Nam
23 12