

Preview text:
Lab 01 - Software Security Resources ▪ Buffer overflow explained ▪ Shellcode explained Overview
A buffer overflow occurs when data written to a buffer overruns its boundary and
overwrites adjacent memory locations, due to insufficient bounds checking. GDB tutorial Loading a program
In order to start debugging using GDB, you need to specify the program to be inspected.
There are two options for doing this: ▪ When launching GDB: ▪ After launching GDB:
Once the debugging symbols from the executable were loaded, you can start executing your program using the command.
You do not need the specify the full command, GDB can fill in the rest of a word in a command for you, if there is only one possibility. E.g.: , and are equivalent; , , are equivalent.
In order to specify arguments for the debugged program, you can either: ▪
Specify them prior to starting the program: ▪
Specify them when starting the program:
You do not need to specify the arguments each time: with no arguments uses the
same arguments used by the previous , or those set by the command. Breakpoints
Breakpoints represent places in your program where the execution should be stopped.
They are added using the break command and its variants. Here are the most common usages: ▪
- Set a breakpoint at entry to function function. When using source
languages that permit overloading of symbols, such as C++, function may refer to
more than one possible place to break. See section Breakpoint menus, for a discussion of that situation. ▪
- Set a breakpoint at line linenum in the current source file. The
current source file is the last file whose source text was printed. The breakpoint
will stop your program just before it executes any of the code on that line. ▪
- Set a breakpoint at line linenum in source file filename. ▪
- Set a breakpoint at entry to function function found in file
filename. Specifying a file name as well as a function name is superfluous except
when multiple files contain similarly named functions. ▪
- Set a breakpoint at address address. You can use this to set
breakpoints in parts of your program which do not have debugging information or source files.
You can see an overview of the current breakpoints using the command. In order to remove , breakpoints you can use the or the command. With the
command you can delete breakpoints according to where they are in your program. With the
command you can delete individual breakpoints by specifying their breakpoint numbers.
Once you want to resume execution, you can use the command. Step
There might be situations when you only want to execute one line of source code, or one
machine instruction from your program. This action is called a step and can be categorized as follows: ▪ Step into -
: Continue running your program until control reaches a different
source line, then stop it and return control to GDB. If the line you are stepping over
represents a function call, this command will step inside it. ▪ Step over -
: Continue to the next source line in the current stack frame. This
is similar to step, but function calls that appear within the line of code are executed without stopping.
There are also equivalent functions fo the machine instructions: stepi, nexti.
If you stepped into a function and you want to continue the execution until the function returns, you can use the command.
Printing registers and variables
You can display a summary of the current registers and flags using the command:
If you want to print the value of one specific register, you can use the command:
You can print the content of a variable in a similar manner: The
command allows you to specify the format of the output like this (you can find a
full list of possible format specifiers here) : Reading and modifying memory
You can use the command (for “examine”) to examine memory in any of several
formats, independently of your program's data types.
, , and are all optional parameters that specify how much memory to display and how to format it;
is an expression giving the address where you want to start displaying memory. ▪
n - the repeat count: The repeat count is a decimal integer; the default is 1. It
specifies how much memory (counting by units u) to display. ▪
f - the display format: The display format is one of the formats used by print ▪
u - the unit size: The unit size is any of (bytes), (halfwords), (words)
E.g.: Print 10 words in hexadecimal format, starting from the address of the current stack pointer.
In order to change the value of a variable or of a specific memory area, you can use the command: Stack info
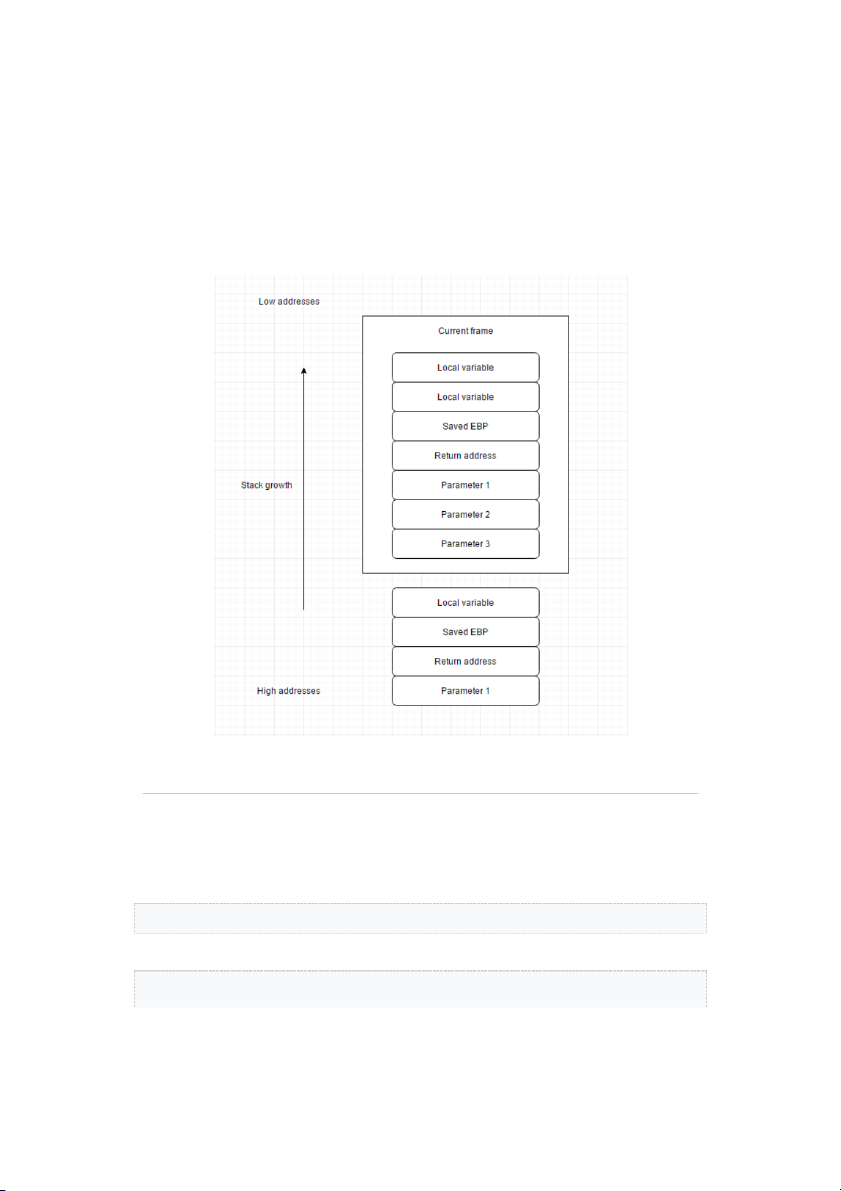
A backtrace is a summary of how your program got where it is. It shows one line per
frame, for many frames, starting with the currently executing frame (frame zero), followed
by its caller (frame one), and on up the stack.
: Print a backtrace of the entire stack: one line per frame for all frames in the stack. E.g.:
It is also possible to move up or down the stack using the following commands: ▪
: Move n frames up the stack. For positive numbers n, this advances toward
the outermost frame, to higher frame numbers, to frames that have existed longer. n defaults to one. ▪
: Move n frames down the stack. For positive numbers n, this advances
toward the innermost frame, to lower frame numbers, to frames that were created
more recently. n defaults to one.
Another useful command for printing information related to the current stack frame is
. This command prints a verbose description of the selected stack frame, including: ▪ the address of the frame ▪
the address of the next frame down (called by this frame) ▪
the address of the next frame up (caller of this frame) ▪
the language in which the source code corresponding to this frame is written ▪
the address of the frame's arguments ▪
the address of the frame's local variables ▪
the program counter saved in it (the address of execution in the caller frame) ▪
which registers were saved in the frame Exercises 00. Setup Compile the following code: like this: You may need to install for 64-bit systems. 01. Run, break, step
Run the program using GDB, setting the argument “AAA”. Set a breakpoint at the beginning of the
function. Continue execution until you hit the breakpoint. Try to reach the beginning of the
function without setting another breakpoint.
Hint: use step over and step into. 02. Printing stuff
Remove the existing breakpoint and set a new one at the beginning of the function.
Run again the program and continue execution until you hit the breakpoint. Print the value of . Print the address of . 03. ASLR
Start again the execution (do not exit GDB) and print again the address of . What do
you notice? Check in another tab if ASLR is enabled on your PC. What happens and how can you fix it?
Hint: http://visualgdb.com/gdbreference/commands/set_disable-randomization 04. Address investigation
Run until the beginning of the
function. Display stack info ( , ). At what address is
located? At what address is the saved return address located? How many
bytes of input do you need in order to overwrite the return address? 05. Buffer overflow
Disable again address randomization in gdb. Run the program with a string such that the
return address of the copy function is overwritten with AAAA. Check the address where the program fails.
06. Call the ''wanted'' function
We want to create an attack which invokes the wanted function. What is the address of
this function? Adjust the input so that the return address is overwritten with the address of the function.
hint1: use objdump -d ./exec to list all the addresses from the binary. Look for the wanted address.
hint2: use python -c 'print “A” * NR + “\xGH\xEF\xCD\xAB”' to generate the payload for
calling the function with address 0xABCDEFGH. You have to find the value of NR. 07. Writing memory
We want to use our new GDB skills to make the application print two times , even if we run it having as argument.
1. Find out the address of the buffer containing the string.
2. Continue the execution until the beginning of the function, disassemble the
code and go step by step through the assembly instructions until the instruction (do not execute the call).
3. Print the value of the stack pointer. Dump 2 values on the stack. What are the two values representing?
4. Overwrite the second value on the stack with the address of the buffer containing the
string and then continue the execution. What happened?
