Lab Manual: Lab 3 - Potentiometric Titration Guide | Môn Chemistry for BME Laboratory - Trường Đại học Quốc tế, Đại học Quốc gia Thành phố Hồ Chí Minh
Potentiometric titration belongs to chemical methods of analysis in which the endpoint of the titration is monitored with anindicator electrodethat records the change of the potential as a function of the amount (usually the volume) of the added titrant of exactly known concentration. Tài liệu được sưu tầm gồm 7 trang, giúp bạn ôn tập tốt hơn. Mời các bạn đón xem.
Môn: Chemistry for BME Laboratory 10 tài liệu
Trường: Trường Đại học Quốc tế, Đại học Quốc gia Thành phố Hồ Chí Minh 1.9 K tài liệu
Tác giả:


Preview text:
lOMoAR cPSD| 23136115
Course of Chemistry for BME (BM098IU) Semester 1, 2022-2023
Instructor: Dr. Truong Phuoc Long
LAB 3: POTENTIOMETRIC TITRATION 1. Lab objectives
• Understanding and performing the potentiometric titration.
• Know how to calibrate and protect the pH meter before use and after use. 2. Pre-lab
1) Explain clearly when we use a potentiometric titration for analysis. Can we use an indicator instead
of a pH meter for this analysis?
2) Write all relevant chemical reactions for this experiment. What can be expected about the acid
concentration at these two-equivalence point?
3) How many end points were you observed in the titration of H3PO4? Explain by using Ka values.
4) How does buffering in a titration of a weak acid or weak base affect the shape of the titration curve
when compared to the titration curve of strong acid with strong base? Explain.
5) What are the advantages and disadvantages of potentiometric titration?
6) What are the function(s) of reference electrode?
7) Write the working principle of calomel and silver/silver chloride reference electrodes?
8) Draw the apparatus for a potentiometric titration and name of each component? Explain their functions.
9) How is end point determination performed in potentiometric titrations?
3. Background information 3.1 Introduction
Potentiometric titration belongs to chemical methods of analysis in which the endpoint of the titration
is monitored with an indicator electrode that records the change of the potential as a function of the amount
(usually the volume) of the added titrant of exactly known concentration. Potentiometric titrations are
especially versatile because indicator electrodes suitable for the study of almost every chemical reaction
used in titrimetry are now available. This technique is also frequently used in the study of operational
conditions of visual titrimetric indicators proposed for general use in chemical analysis, as well as in the
study of numerous reactions, such as protonation and complexation, which find their application not
particularly in analytical measurements. The course of the potentiometric titration curve provides
information not only about the titration end point position, but also the position and shape of the curve may
provide data about the processes accompanying the titration reaction. Another advantage is that the
necessary apparatus is generally not expensive, reliable and readily available in the laboratories.
The titration endpoint can be determined manually or potentiometrically. In a manual titration, the
endpoint is determined by use of a visual indicator that changes color when the endpoint of the titration has
been reached. Potentiometric titration is a laboratory technique for determining analyte concentration. A
chemical indicator is not used in this procedure. The electric potential across the material is measured
instead. Potentiometric titration is performed using two electrodes: an indication electrode and a reference
electrode (generally a hydrogen electrode or a silver chloride electrode). The indicator electrode and the
ions of the analyte, which is often an electrolyte solution, create one half-cell. The reference electrode forms lOMoAR cPSD| 23136115
the other half-cell. The endpoint occurs where there is a maximal rate of change of potential at the endpoint of the titration.
Potentiometric titration includes four forms of titration: acid-base titration, redox titration,
complexometric titration, and precipitation titration. Each of these methods of titration is described briefly below.
• Acid-Base Titration: This sort of potentiometric titration is used to estimate the concentration of a
given acid/base by precisely neutralizing it with a known standard solution of base/acid.
• Redox Titration: A redox reaction occurs between an analyte and a titrant in this sort of
potentiometric titration. Titration of an iodine solution with a reducing agent to form iodide ion is an
example of this sort of titration (a starch indicator is used to get the endpoint).
• Complexometric Titration: This method of titration is also known as chelatometry. A colored
complex is created in this procedure, signifying the end point of the titration. This approach is used
to determine the metal ion composition in a particular solution.
• Precipitation Titration: This method of titration includes an interaction between the analyte and
the titrant that results in the formation of an insoluble precipitate. The titration is accomplished when
the addition of the titrant no longer forms a precipitate. 3.2 General Principle
A typical cell for potentiometric analysis consists of a reference electrode, an indicator electrode and a
salt bridge. This cell can be represented as
A reference electrode, Eref, is a half-cell having a known potential that remains constant at constant
temperature and independent of the composition of the analyte solution. The reference electrode is always
treated as the left-hand electrode in potentiometric measurements. Calomel electrodes and silver/silver
chloride electrodes are types of reference electrodes.
An indicator electrode has a potential that varies with variations in the concentration of an analyte. Most
indicator electrodes used in potentiometry are selective in their responses. Metallic indicator electrode and
membrane electrodes are types of indicator electrodes.
The third component of a potentiometric cell is a salt bridge that prevents the components of the analyte
solution from mixing with those reference electrodes. A potential develops across the liquid junctions at
each end of the salt bridge. The junction’s potential across the salt bridge, Ej, is small enough to be neglected.
The potential of the cell is given by the equation: Ecell = Eind – Eref + Ej
3.3 The Glass Electrode for pH Measurements
Typical cell for measuring pH consist of a glass indicator electrode and a saturated calomel reference
electrode immersed in the solution whose pH is unknown. The indicator electrode consists of a thin, pH
sensitive glass membrane sealed onto one end of a heavy-walled glass or plastic tube. A small volume of
hydrochloric acid saturated with silver chloride is contained in the tube. A silver wire in this solution forms lOMoAR cPSD| 23136115
a silver/silver chloride inner-reference electrode, which is connected to one of the terminals of the
potentialmeasuring device, pH-meter. The calomel electrode is connected to the other terminal.
The electric potential created between the glass electrode, and the inner-reference electrode is a
function of the pH value (activity of hydronium ion, aH3O+) of the measured solution. So once the potential
difference between glass electrode and outer-reference calomel electrode has been measured the pH value can be calculated.
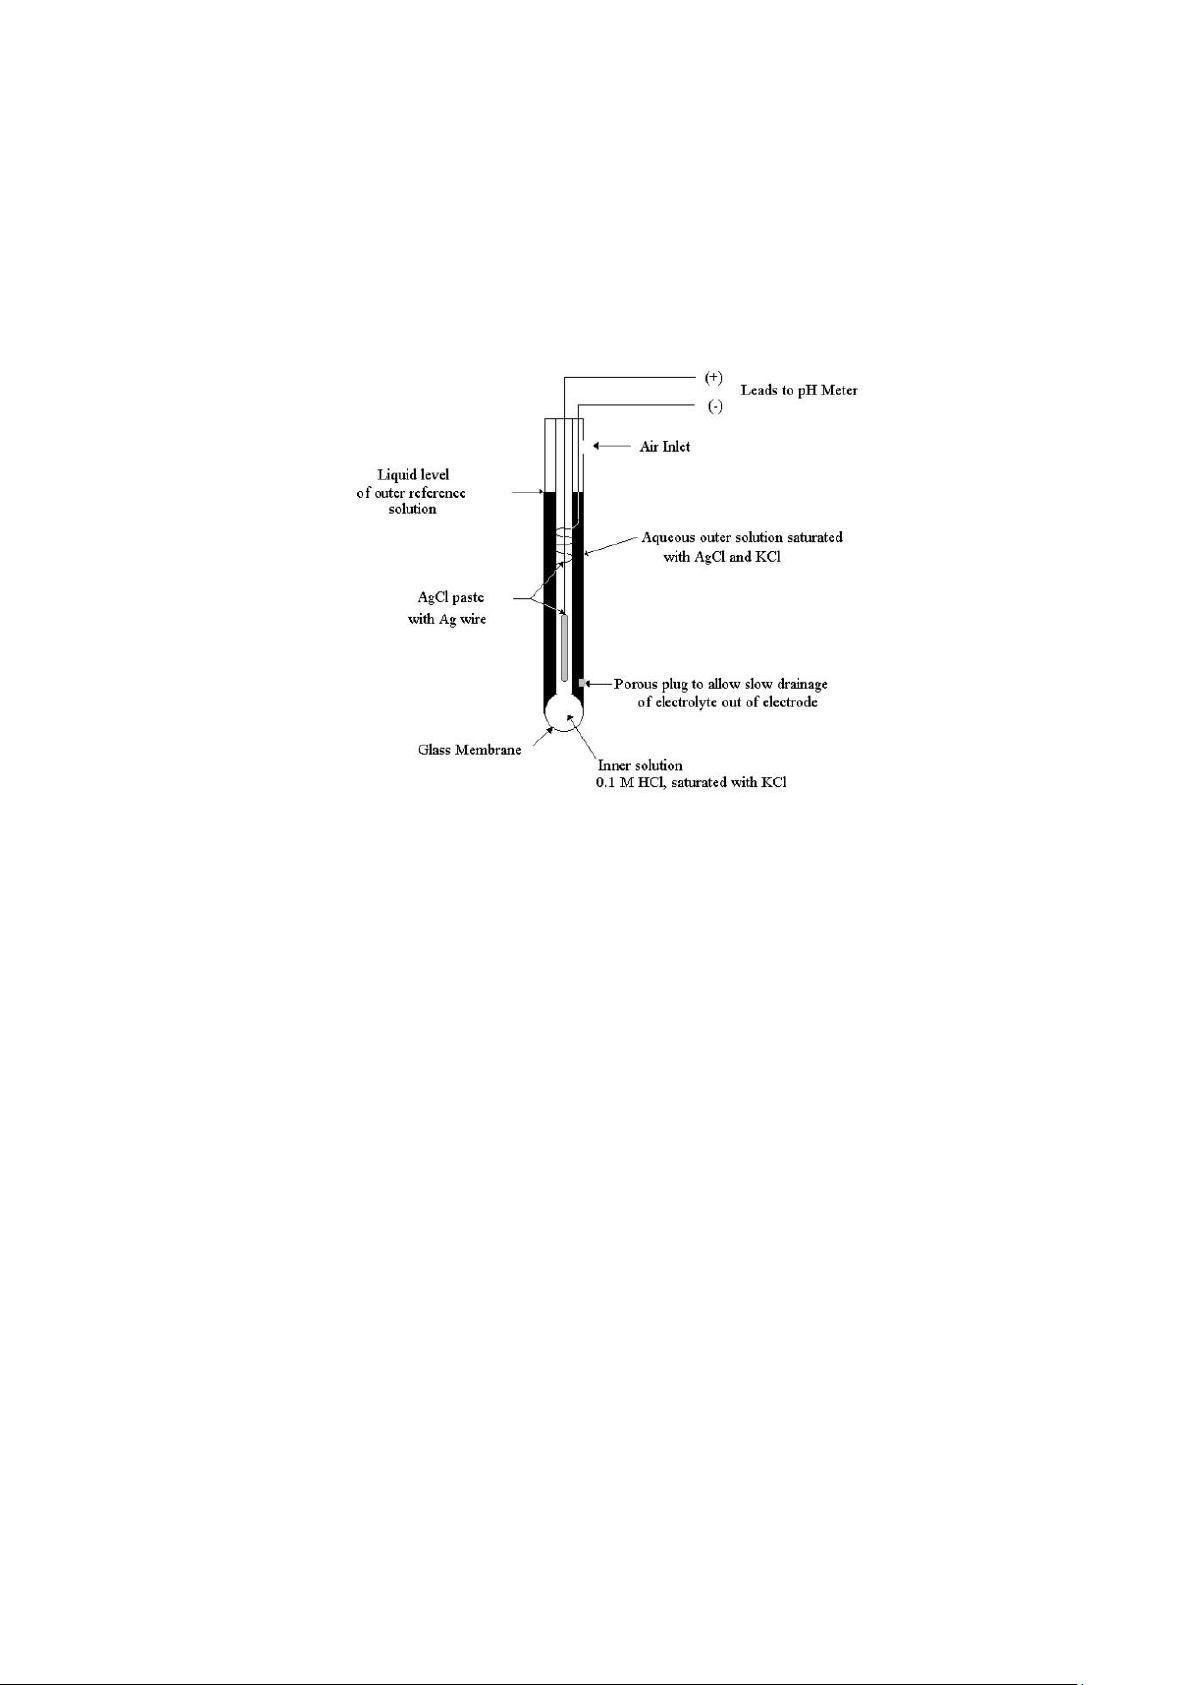
Modern pH electrodes are usually of the "combination" type, meaning that a single cylinder contains
both a glass membrane electrode and the outer-reference calomel electrode, (Figure 1).
Figure 1 Combination glass electrode
A change in hydronium ion concentration causes a change in composition of the glass membrane due to
an ion exchange process involving the solution and the membrane. A corresponding change in membrane
potential, proportional to pH, is what is measured. All other potentials are constant. In effect the membrane
potential (variable) is measured against two fixed potentials, the external reference and the internal
reference, both Ag/AgCl reference electrodes. Potential difference is measured using a high impedance
(internal resistance) potentiometer.
3.4 Potentiometric Titrations
Potentiometric titrations involve the measurement of the potential of a suitable indicator electrode with
respect to a reference electrode as a function of titrant volume. Potentiometric titrations provide more
reliable data than data from titrations that use chemical indicators and are particularly useful with colored
or turbid solutions and for detecting the presence of unsuspected species.
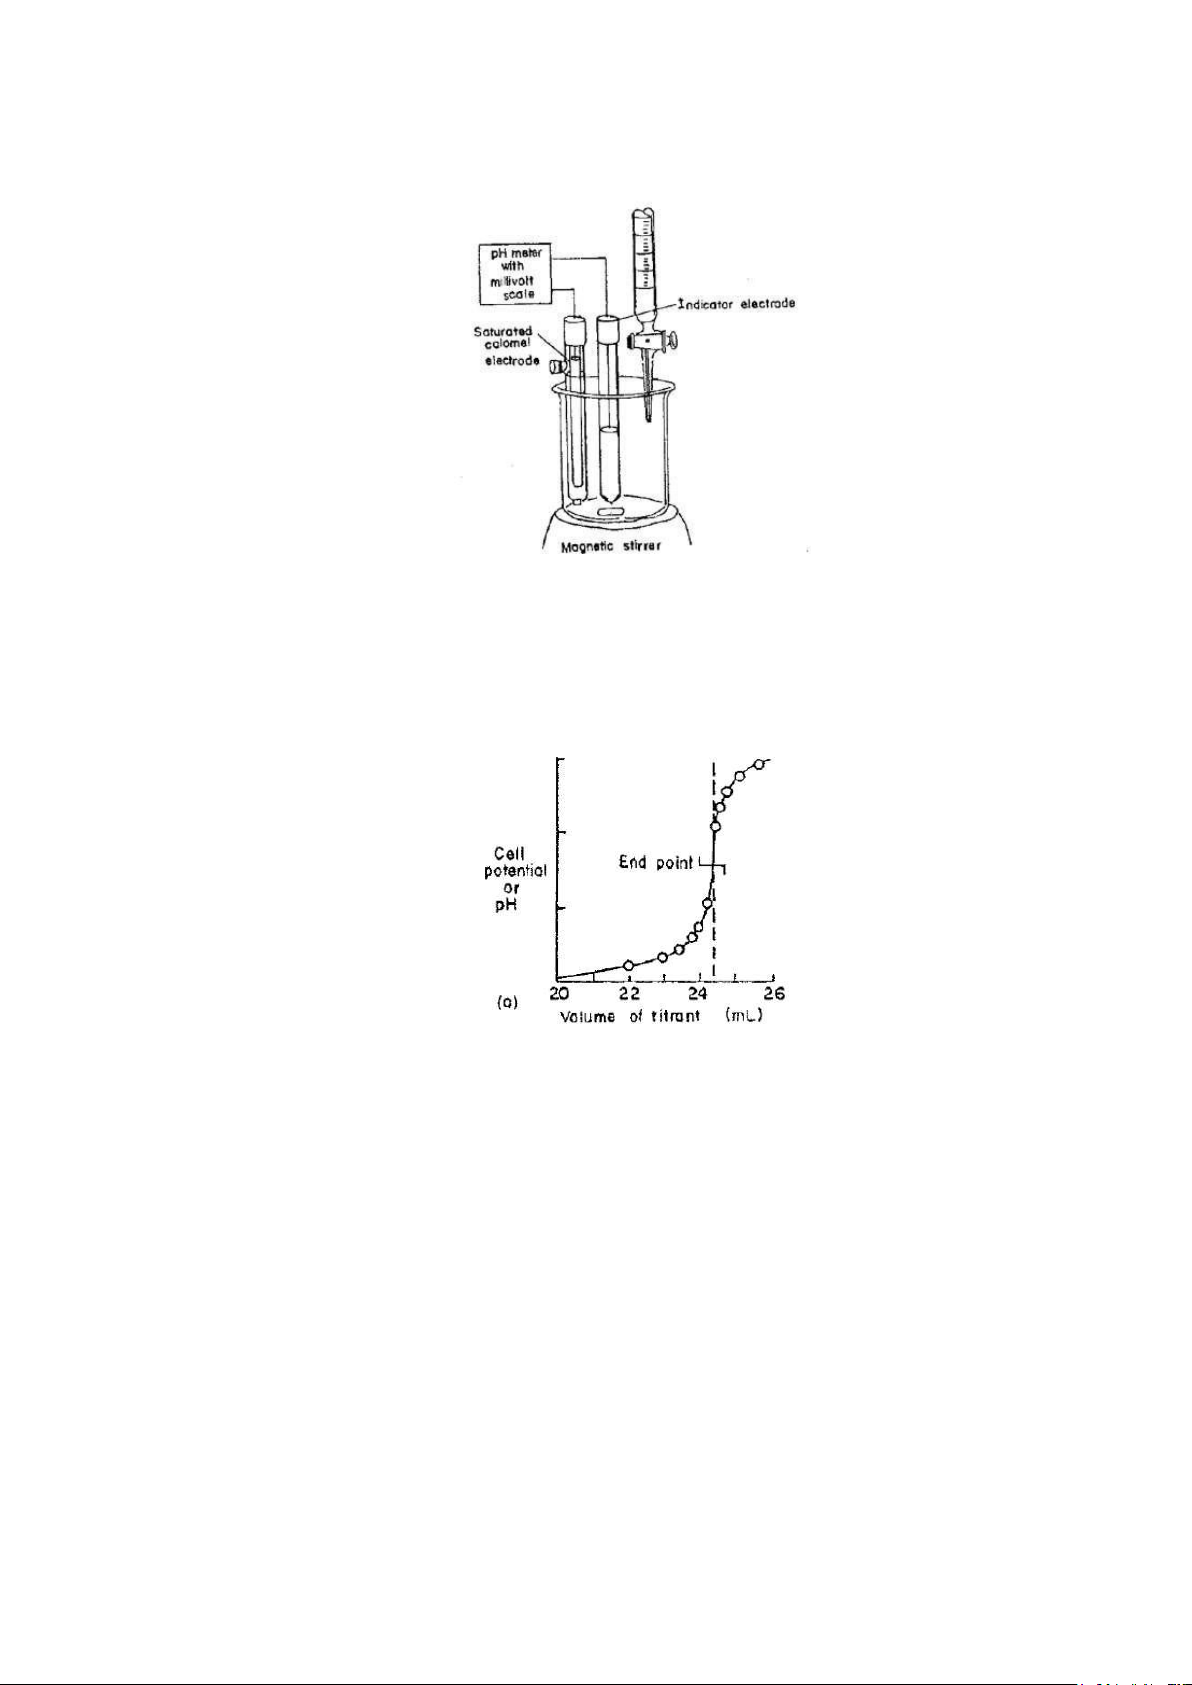
A typical set up for potentiometric titrations is given in Figure 2. Titration involves measuring and
recording the cell potential (in units of millivolts or pH) after each addition of titrant. The titrant is added in
large increments at the outset and in smaller and smaller increments as the end point is approached (as
indicated by larger changes in response per unit volume). Sufficient time must be allowed for the attainment
of equilibrium after each addition of the reagent by continuous stirring. For this a magnetic stirrer with a stirring magnet bar is used.
Potentiometric titrations can be classified as precipitation titrations, complex formation titrations,
neutralization titrations and oxidation/reduction titrations. lOMoAR cPSD| 23136115
Figure 2 Apparatus for potentiometric titrations
3.5 End-Point Detection with Potentiometric Titrations
Several methods can be used to determine the end point of a potentiometric titrations. The most straight
forward one involves a direct plot of potential as a function of reagent volume, as a Figure 3.
Figure 3 titration curve
The midpoint in the steeply rising portion of the curve is estimated visually and taken as the end point.
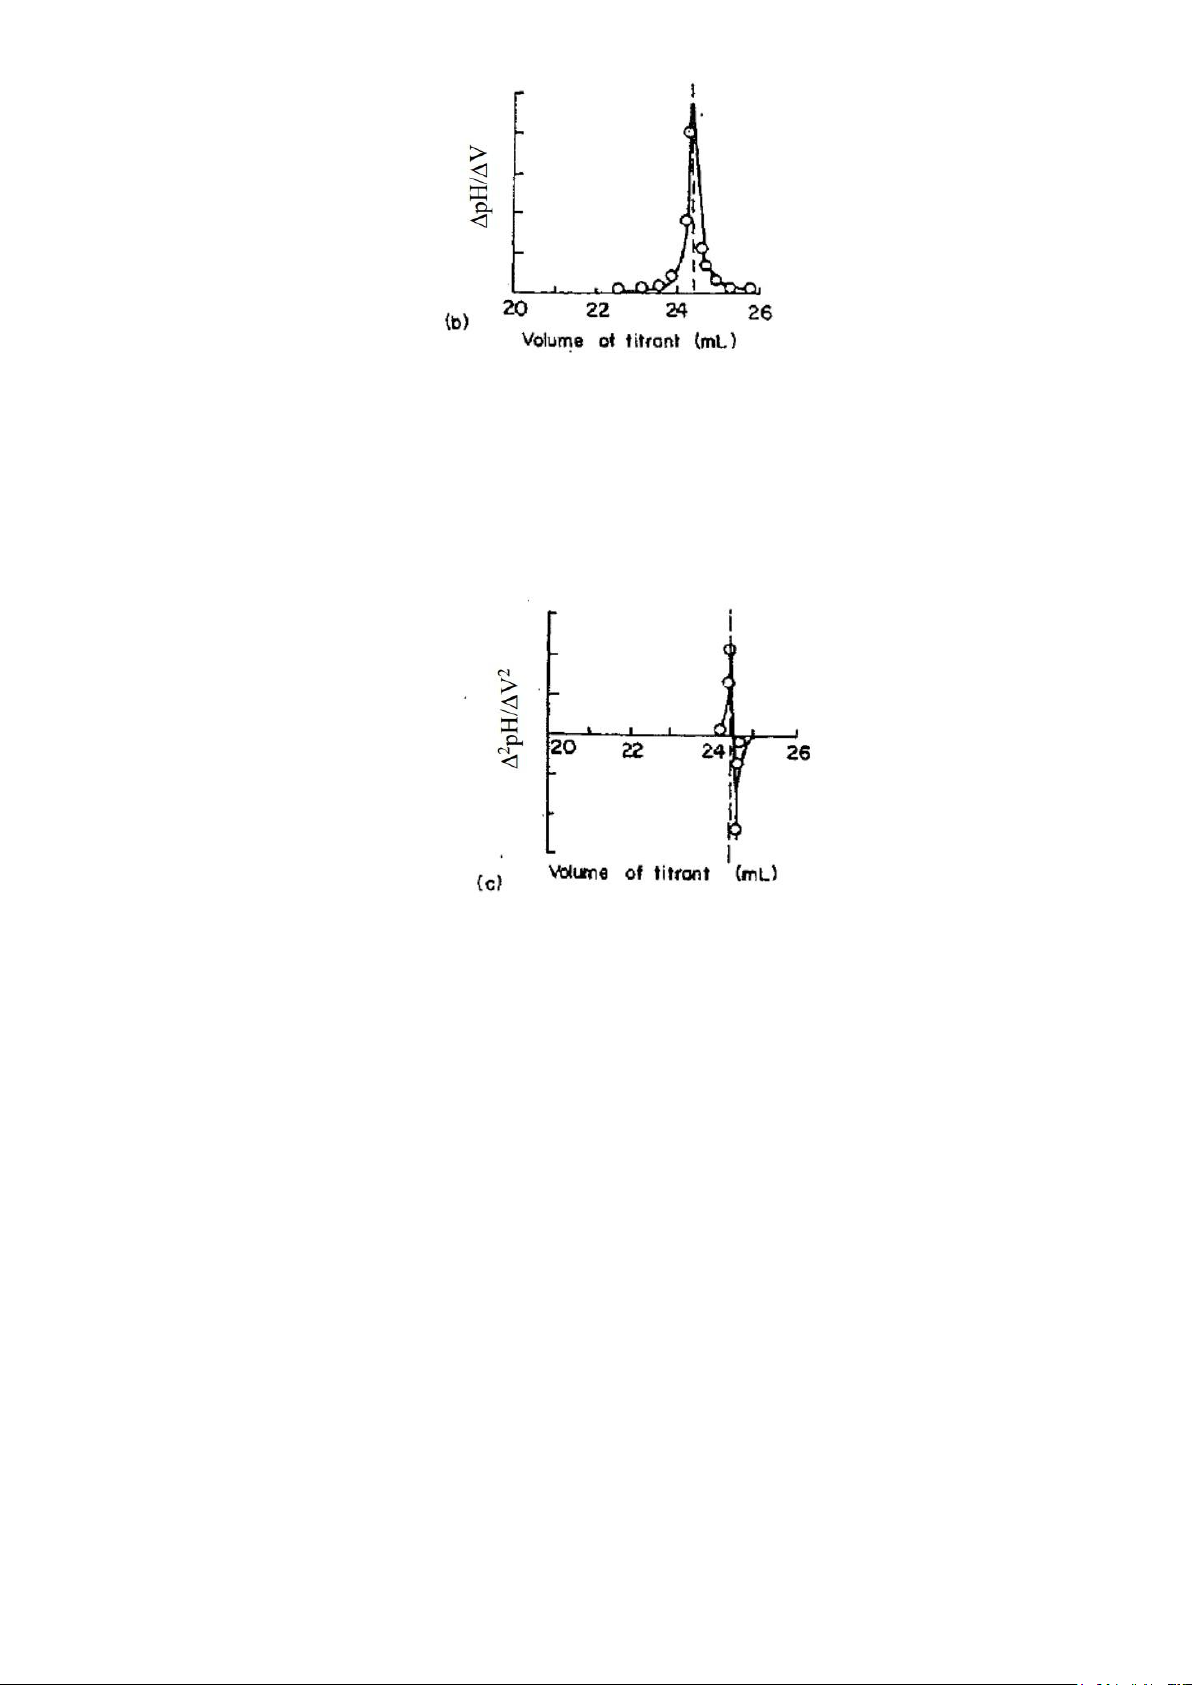
The second approach to end-point detection is to plot the derivative curves:
1. Plotting first derivative curve by calculating the change in potential or pH per unit volume of titrant
(that is, ΔE/ΔV or ΔpH/ΔV). A plot of ΔE/ΔV or ΔpH/ΔV as a function of corresponding reagent
volume produces a curve with a maximum that corresponds to the point of inflection (Figure 4). lOMoAR cPSD| 23136115
Figure 4 First-derivative curve
2. Plotting the second derivative curve by calculating change in potential-change or pH - change per
volume change. Then their ratios, Δ2E/ΔV2 or Δ2pH/ΔV2 values, are plotted against corresponding
volume of the titrant. As shown in Figure 5, the data changes sign from (+) to (-) at the inflection
point. Second derivative curve gives the end point more precisely.
Figure 5 Second derivative curve
4. Materials and equipment 4.1. Materials
• H3PO4 (unknown concentration) • 0.100N NaOH • Distilled water 4.2. Equipment • Burette 20ml • Beakers • pH meter lOMoAR cPSD| 23136115 Erlenmeyer flask 4.3
Safety precautions
- Phosphoric acid may be very harmful if it comes into contact with the skin, eyes, or is ingested.
Inhaling the fumes might also result in irritation. This substance may cause irritation to the skin, eyes, mouth, and lungs.
- Be cautious with the pH meter's electrical head. This apparatus has electrical components that might
come into touch with flesh or liquids. This device is used close to dangerous substances.
5. Experimental procedure
5.1. General potentiometric titration of H3PO4 with NaOH (1mL of base increments)
Step 1: Pipet 10.00mL of the H3PO4 solution into a clean, dry a beaker. Place the beaker on a magnetic stirrer.
Step 2: Fill a clean burette with 0.100M NaOH solution so that it is exactly at the 0.00mL mark and position over the beaker.
Step 3: Record the first potential value by using pH meter (pH of the H3PO4 solution).
Step 4: Add about 1.00mL of NaOH from the burette. Turn off the magnetic stirrer and record the second potential value.
Step 5: Repeat, add base in 1.00mL increments and record the potential value until all of base have
been added and two slopes occur.
Plot the general curve of the titration of H3PO4 with NaOH using Microsoft Excel.
5.2. First equivalence point of titration of H3PO4 with NaOH
Step 1: Prepare new H3PO4 solution into a beaker.
Step 2: Clean and refill NaOH into the burette.
Step 3: Add 1mL of base to the volume before of the FIRST slope occurred.
Step 4: Add base in 0.1mL increments and record the potential value.
Step 5: Repeat the previous step until the FIRST slope has been thoroughly occurred by recording potential values.
Plot the first slope of the titration of H3PO4 with NaOH using Microsoft Excel.
5.3. Second equivalence point of titration of H3PO4 with NaOH
Step 1: Prepare new H3PO4 solution into a beaker.
Step 2: Clean and refill NaOH into the burette.
Step 3: Add 1mL of base to the volume before of the SECOND slope occurred.
Step 4: Add base in 0.1mL increments and record the potential value.
Step 5: Repeat the previous step until the SECOND slope has been thoroughly occurred by recording potential values.
Plot the second slope of the titration of H3PO4 with NaOH using Microsoft Excel. lOMoAR cPSD| 23136115
From the equivalence points, determine the molar concentration of H3PO4 and discuss about it. 6. Clean-up
• Each group wipes down your experiment area with alcohol 70o, wash the used labware, and dispose other trash.
• Dispose of H3PO4 in the acid waste collector, and NaOH in the basic waste collector. Remember to
wear the gloves during washing, clean-up workstations and return chemicals to the original location.
The last finished group is on duty to clean up the laboratory. 7. Lab report
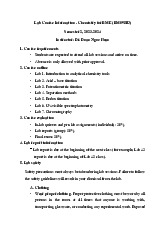
• Lab report (individual) is required for this lab session.
• The Introduction section should include brief information about: o Background of the potentiometric
titration (definition, principle, purposes, etc.) o Background of strong and weak acid, polyprotic acid,
conjugate acids and bases. Please give examples for each term. 8. Manual information
• This manual is developed by o Dr. Truong Phuoc Long, Instructor o
Tran Duong An Hoa, Teaching assistant o Nguyen Manh Khang,
Teaching assistant o Dao Ngoc Yen Khoa, Teaching assistant
• Last updated: Semester 1, 2022-2023
Tài liệu liên quan:
-
Report 1: Exploring Chemical Reactions at CIU | Môn Chemistry for BME Laboratory - Trường Đại học Quốc tế, Đại học Quốc gia Thành phố Hồ Chí Minh
129 65 -

Report 4 - Investigation of Chemical Equilibrium | Môn Chemistry for BME Laboratory - Trường Đại học Quốc tế, Đại học Quốc gia Thành phố Hồ Chí Minh
132 66 -

Quy Định An Toàn Phòng Thí Nghiệm | Môn Chemistry for BME Laboratory - Trường Đại học Quốc tế, Đại học Quốc gia Thành phố Hồ Chí Minh
72 36 -
Hướng dẫn viết báo cáo Môn Chemistry for BME Laboratory | Trường Đại học Quốc tế, Đại học Quốc gia Thành phố Hồ Chí Minh
107 54 -
About the lab Môn Chemistry for BME Laboratory | Trường Đại học Quốc tế, Đại học Quốc gia Thành phố Hồ Chí Minh
91 46