Lecture 14 - ENEE1006IU
Lecture 14 - ENEE1006IU
Môn: Thương mại điện tử (TMDT2023) 33 tài liệu
Trường: Trường Đại học Kinh Tế - Tài Chính Thành phố Hồ Chí Minh 0.9 K tài liệu
Tác giả:


Preview text:
APPLIED STATISTICS COURSE CODE: ENEE1006IU
Lecture 14: Chapter 8: Time series analysis and forecasting
(3 credits: 2 is for lecture, 1 is for lab-work) Instructor: TRAN THANH TU Email: tttu@hcmiu.edu.vn tttu@hcmiu.edu.vn 1
CHAPTER 8: TIME SERIES ANALYSIS AND FORECASTING • 8.1. Time series patterns • 8.2. Forecast accuracy • 8.3. Trend projection
• 8.4. Time series decomposition tttu@hcmiu.edu.vn 2
8.1. TIME SERIES PATTERNS
• A time series is a sequence of observations on
a variable measured at successive points in time
or over successive periods of time.
• The pattern of the data is an important factor in
understanding how the time series has behaved in the past.
xác định mẫu cơ bản trong dữ liệu
• To identify the underlying pattern in the data, a
useful first step is to construct a time series plot.
• A time series plot is a graphical presentation of
the relationship between time and the time series
variable; time is on the horizontal axis and the
time series values are shown on the vertical axis. tttu@hcmiu.edu.vn 3
8.1. TIME SERIES PATTERNS
• Horizontal Pattern: a horizontal pattern
exists when the data fluctuate around a constant mean
mẫu ngang tồn tại khi dữ liệu dao động xung quanh giá trị trung bình không đổi
• Trend Pattern: a trend is usual y the
result of long-term factors; gradual shifts or PC
movements to relatively higher or lower 2020-06-28 18:27:28
-------------------------------------------- yếu tố dài hạn
values over a longer period of time
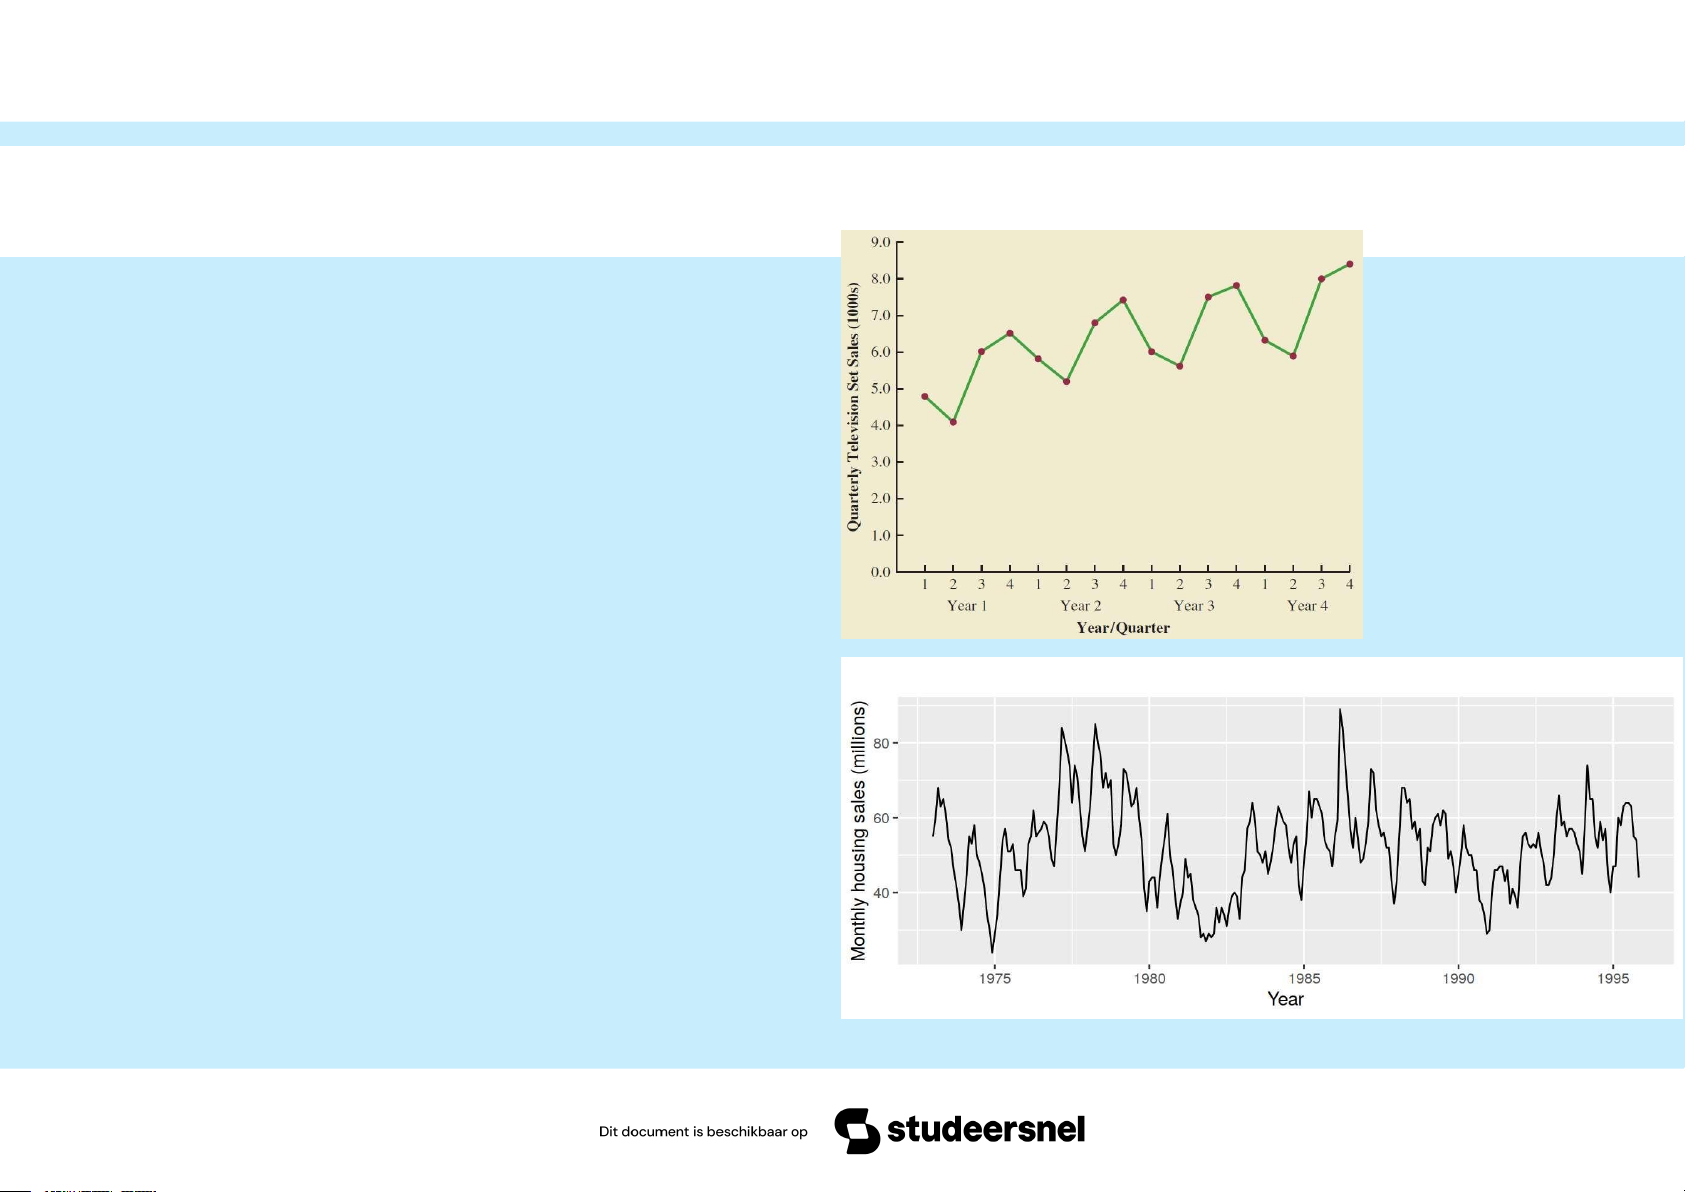
• Seasonal Pattern: Seasonal patterns
are recognized by seeing the same
repeating patterns over successive periods of time tttu@hcmiu.edu.vn 4
các mẫu lặp lại tương tự trong các khoảng thời gian liên tiếp
8.1. TIME SERIES PATTERNS
Xu hướng và mô hình theo mùa
• Trend and Seasonal Pattern: in such cases we need to use a
forecasting method that has the
capability to deal with both trend and seasonality Mô hình chu kỳ
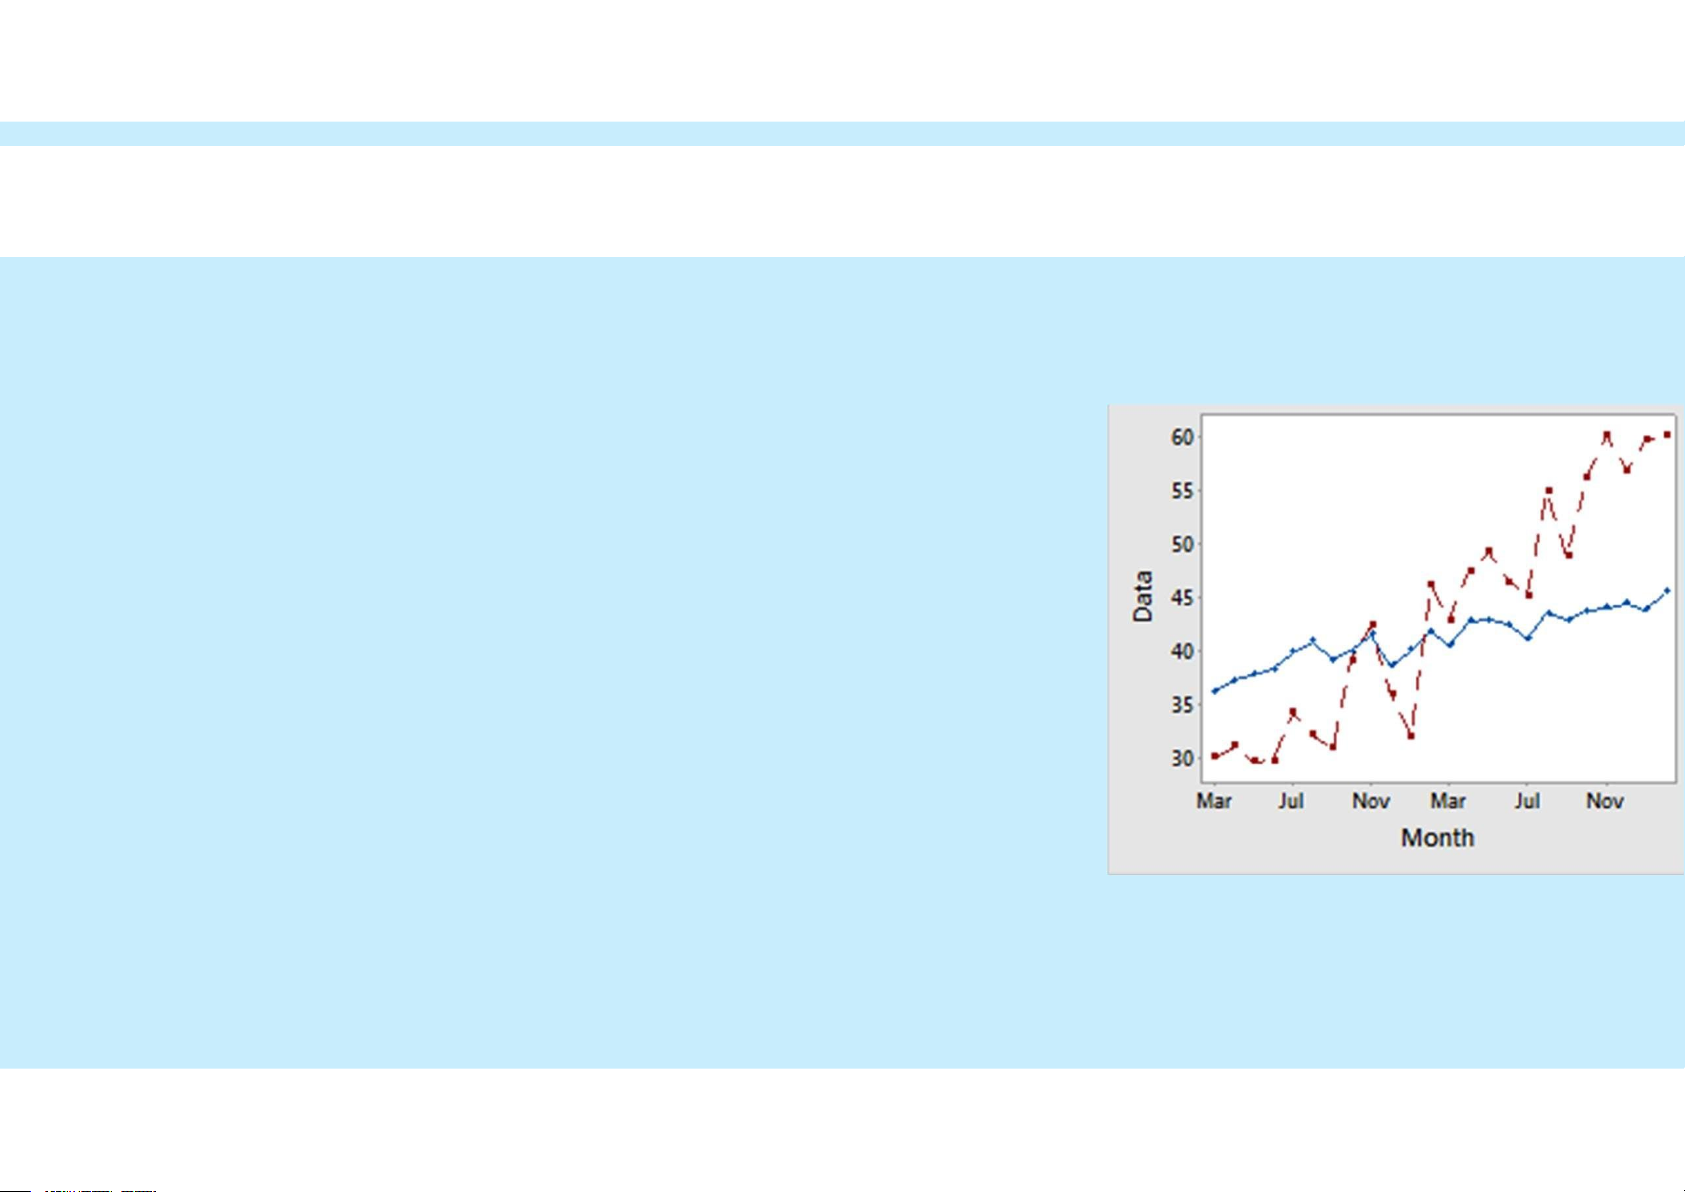
• Cyclical Pattern: a cyclical
pattern exists if the time series plot
shows an alternating sequence of
points below and above the trend
line lasting more than one year.
cyclical effects are often combined
with long-term trend effects and
referred to as trend-cycle effects tttu@hcmiu.edu.vn 5
Mô hình chu kỳ: mô hình chu kỳ tồn tại nếu biểu đồ chuỗi thời gian hiển thị chuỗi điểm xen kẽ bên dưới và bên trên đường
xu hướng kéo dài hơn một năm. hiệu ứng chu kỳ thường được kết hợp với hiệu ứng xu hướng dài hạn và được gọi là hiệu ứng chu kỳ xu hướng 8.2. FORECAST ACCURACY
• Principles of Forecasting:
Many types of forecasting models that differ in complexity and amount of
data & way they generate forecasts: độ phức tạp và lượng dữ liệu & cách chúng tạo dự báo
1. Forecasts are rarely perfect
2. Forecasts are more accurate for grouped data than for individual items
3. Forecast are more accurate for shorter than longer time periods tttu@hcmiu.edu.vn 6
TYPES OF FORECASTING METHODS
• Decide what needs to be forecast
Level of detail, units of analysis & time horizon required
• Evaluate and analyze appropriate data • Quyết định những gì cần được dự báo
Mức độ chi tiết, đơn vị phân tích và thời gian cần thiết
Identify needed data & whether it’s available • Đánh giá và phân tích dữ liệu phù hợp
Xác định dữ liệu cần thiết và liệu nó có sẵn
• Select and test the forecasting model
• Chọn và kiểm tra mô hình dự báo
Chi phí, dễ sử dụng và chính xác
Cost, ease of use & accuracy • Tạo dự báo
• Theo dõi độ chính xác dự báo theo thời gian • Generate the forecast
• Monitor forecast accuracy over time tttu@hcmiu.edu.vn 7
TYPES OF FORECASTING METHODS • Forecasting methods are classified into two groups: • Qualitative methods – judgmental methods Forecasts generated subjectively by the forecaster Educated guesses
• Quantitative methods – based on mathematical modeling Forecasts generated through mathematical modeling tttu@hcmiu.edu.vn 8 QUANTITATIVE METHODS • Time Series Models:
Assumes information needed to generate a forecast is contained in a time series of data
Assumes the future wil fol ow same patterns as the past
• Causal Models or Associative Models:
Explores cause-and-effect relationships
Uses leading indicators to predict the future
Housing starts and appliance sales tttu@hcmiu.edu.vn 9 TIME SERIES MODELS
• Forecaster looks for data patterns as
Data = historic pattern + random variation
• Historic pattern to be forecasted:
Level (long-term average) – data fluctuates around a constant mean
Trend – data exhibits an increasing or decreasing pattern
Seasonality – any pattern that regularly repeats itself and is of a constant length
Cycle – patterns created by economic fluctuations
• Random Variation cannot be predicted tttu@hcmiu.edu.vn 10 TIME SERIES MODELS • Naive: Ft+1 = At
The forecast is equal to the actual value observed during the last period – good for level patterns • Simple Mean: Ft+1 = ΣAt / n
The average of al available data - good for level patterns • Moving Average: F
The average value over a set time period t+1 = ΣAt / n (e.g.: the last four weeks)
Each new forecast drops the oldest data point & adds a new observation
More responsive to a trend but stil lags behind actual data
Phản ứng nhanh hơn với xu hướng nhưng vẫn chậm so với dữ liệu thực tế tttu@hcmiu.edu.vn 11 TIME SERIES MODELS • Weighted Moving Average: F A
t+1 = ΣCt t
• Al weights must add to 100% or 1.00
e.g. Ct =0.5, Ct-1 =0.3, Ct-2 =0.2 (weights add to 1.0)
Cho phép nhấn mạnh một giai đoạn hơn các giai đoạn khác
• Al ows emphasizing one period over others; above indicates more weight on recent data (Ct=0.5)
cân bằng tất cả các giai đoạn
• Differs from the simple moving average that weighs al periods equal y - more responsive to trends tttu@hcmiu.edu.vn 12 TIME SERIES MODELS • Exponential Smoothing:
Ft+1 = αAt + (1– α)Ft
Most frequently used time series method because of ease of use and minimal amount of data needed
• Need just three pieces of data to start:
Last period’s forecast (Ft)
Last periods actual value (At)
Select value of smoothing coefficient, α,between 0 and 1.0
• If no last period forecast is available, average the last few periods or use naive method
• Higher α values (e.g. 0.7 or 0.8) may place too much weight on last period’s random variation tttu@hcmiu.edu.vn 13
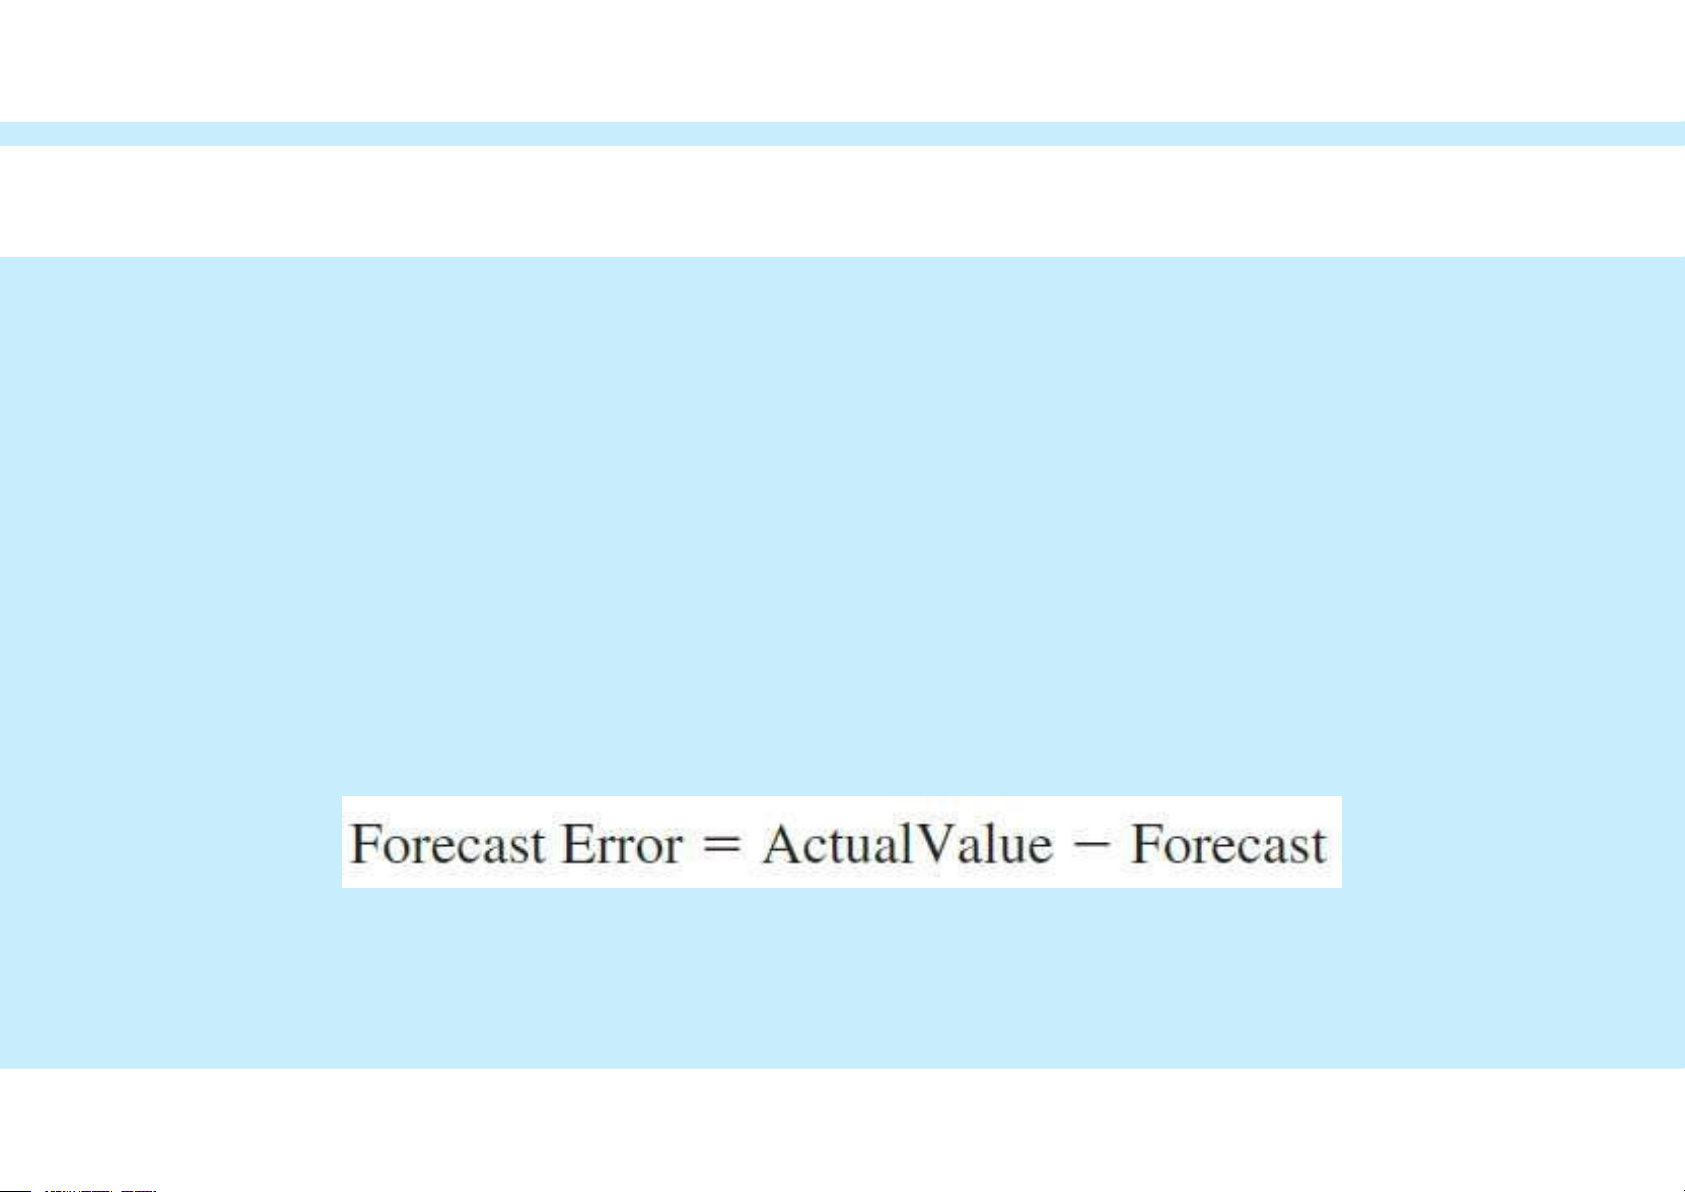
MEASURING FORECAST ERROR
• Forecasts are never perfect
• Need to know how much we should rely on our chosen forecasting method • Measuring forecast error:
Et = At – Ft
• Note that over-forecasts = negative errors and under-forecasts = positive errors tttu@hcmiu.edu.vn 14
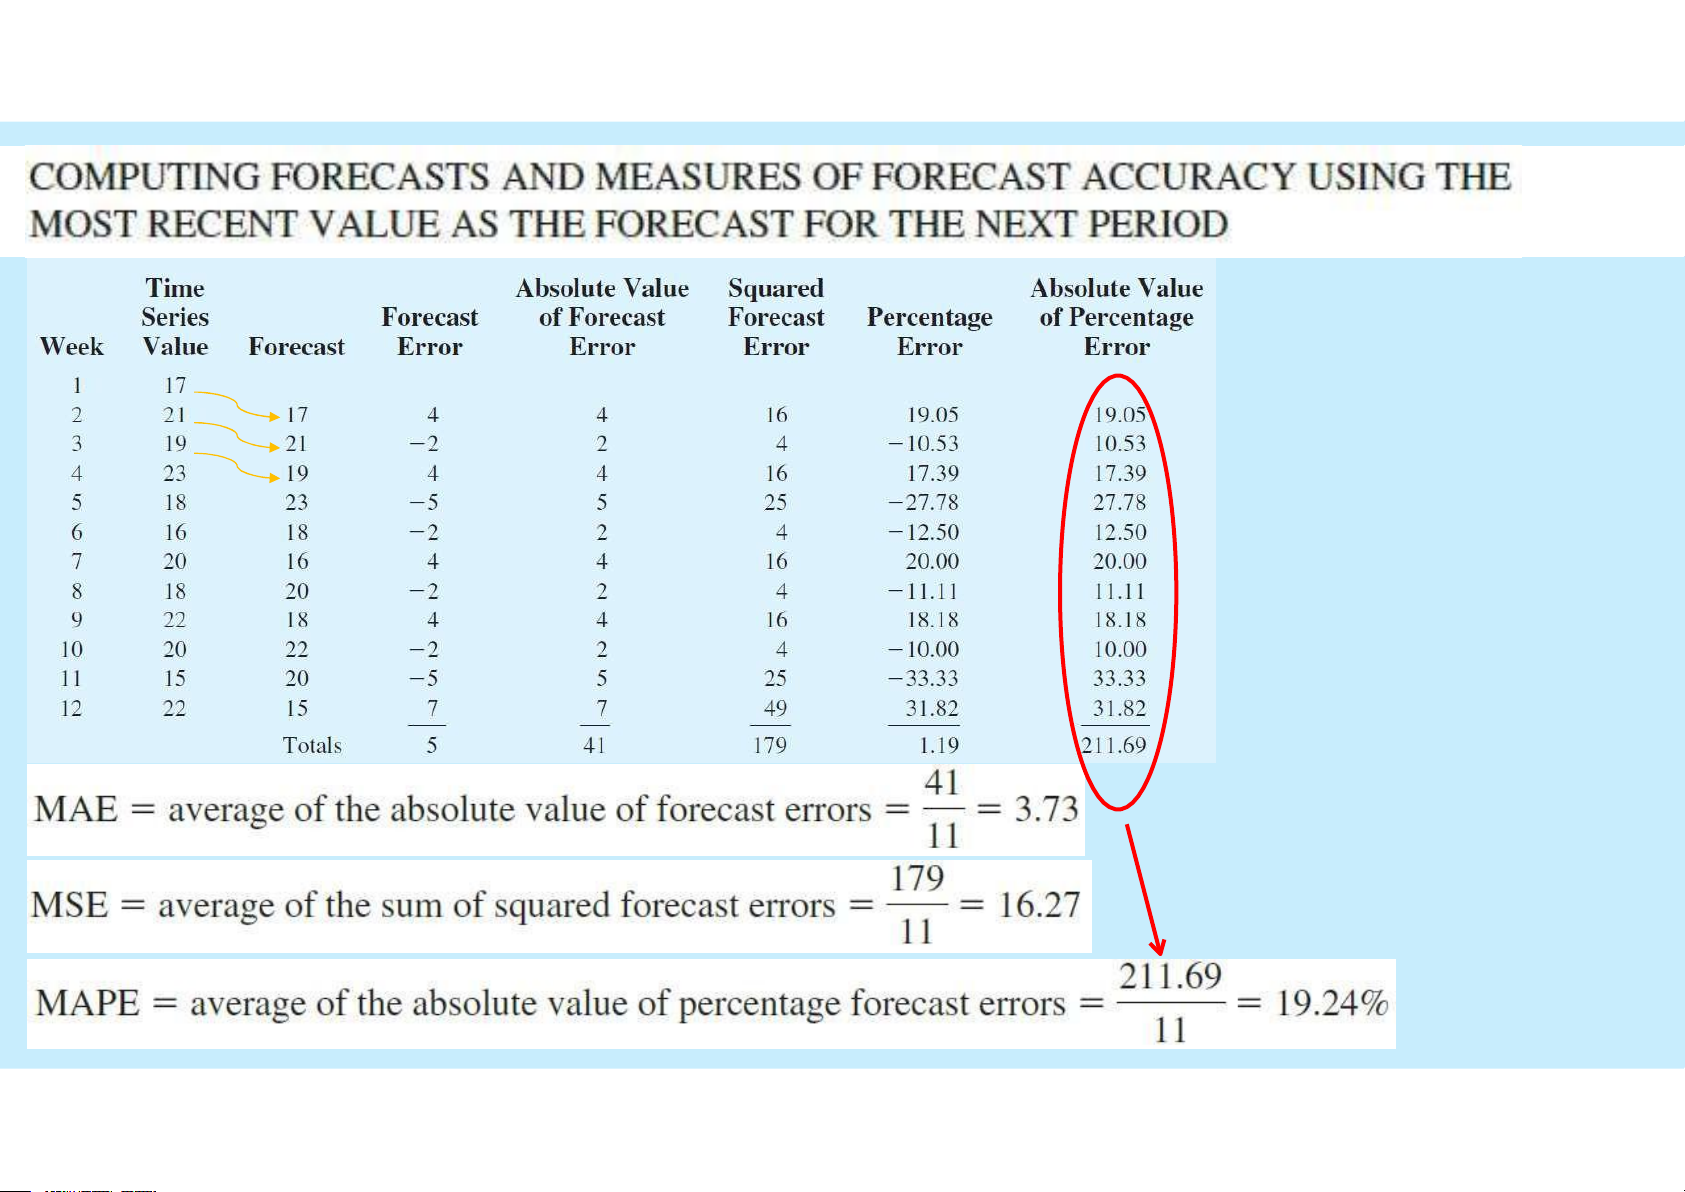
MEASURING FORECASTING ACCURACY
• Mean Absolute Deviation (MAD)
measures the total error in a forecast without regard to sign
MAD = Σ actual – forecast n
• Cumulative Forecast Error (CFE)
Measures any bias in the forecast
CFE = Σ(actual– forecast)
• Mean Square Error (MSE)
Σ (actual -forecast )2 Penalizes larger errors MSE = n • Tracking Signal CFE
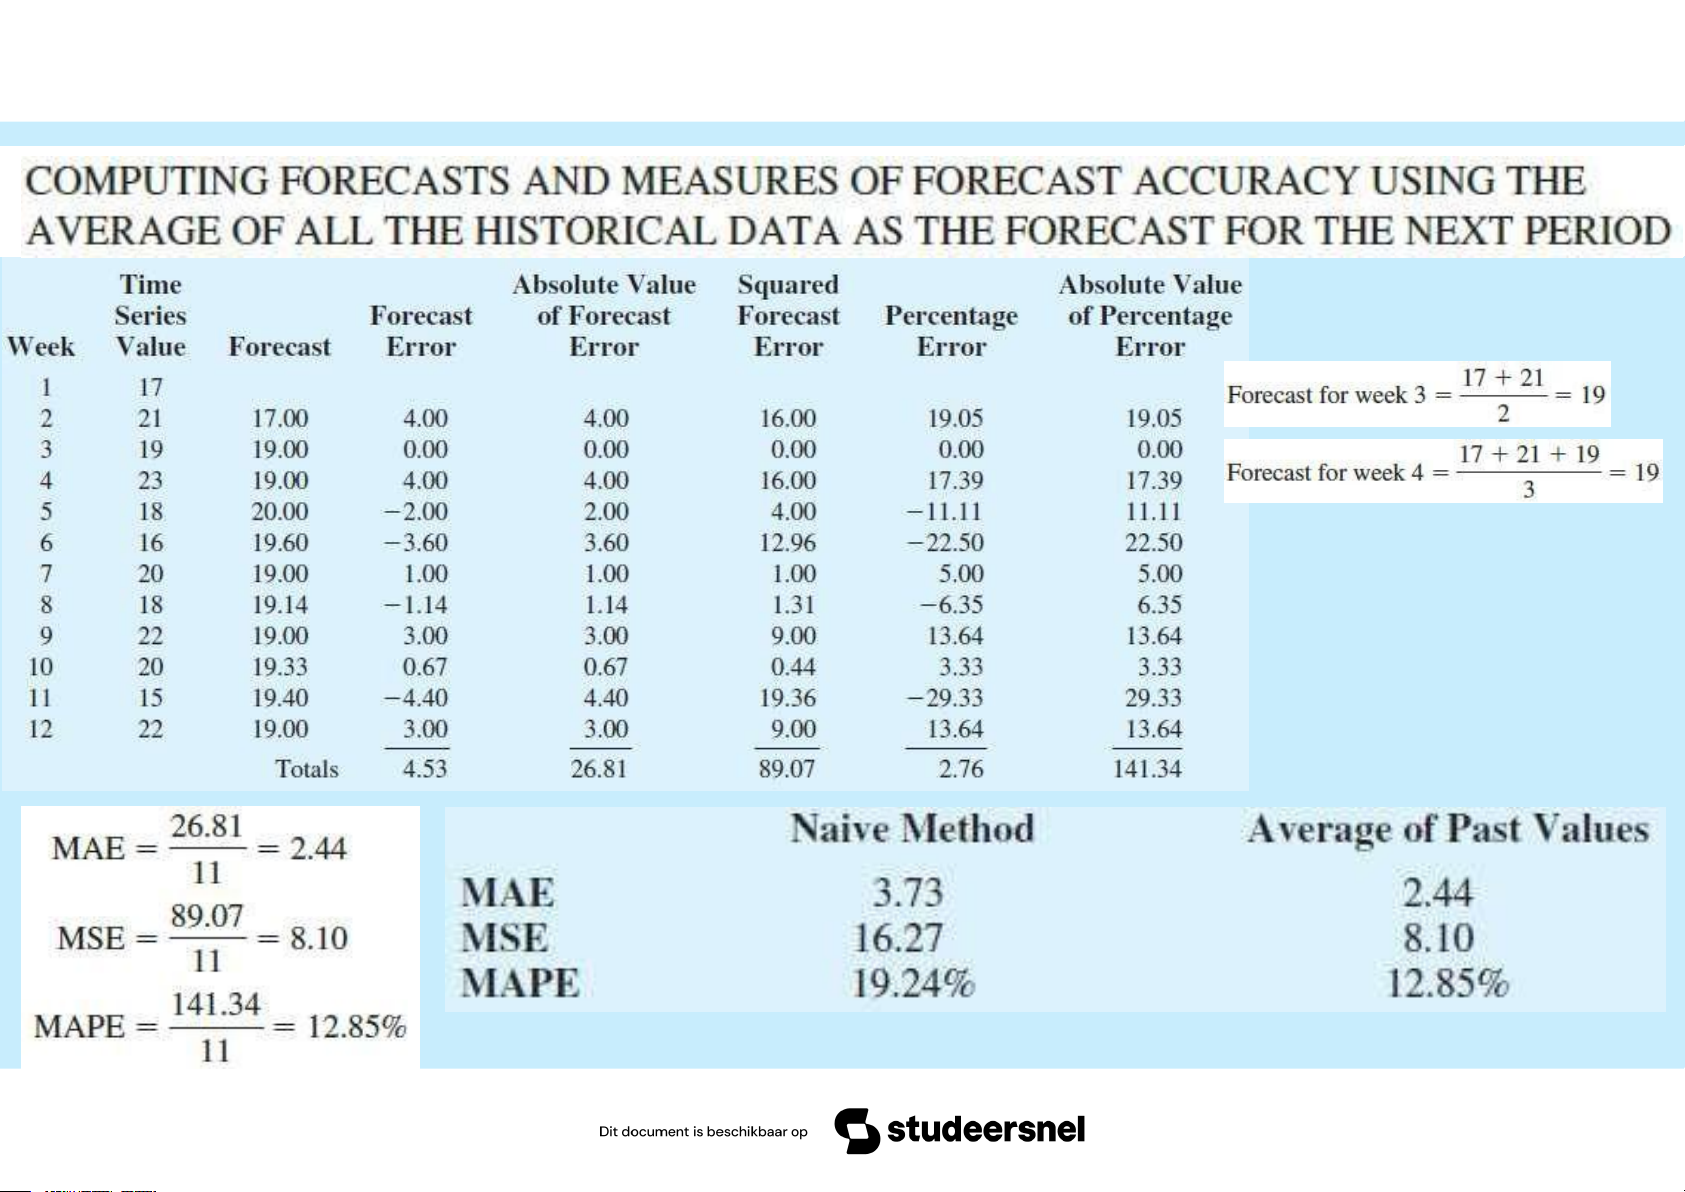
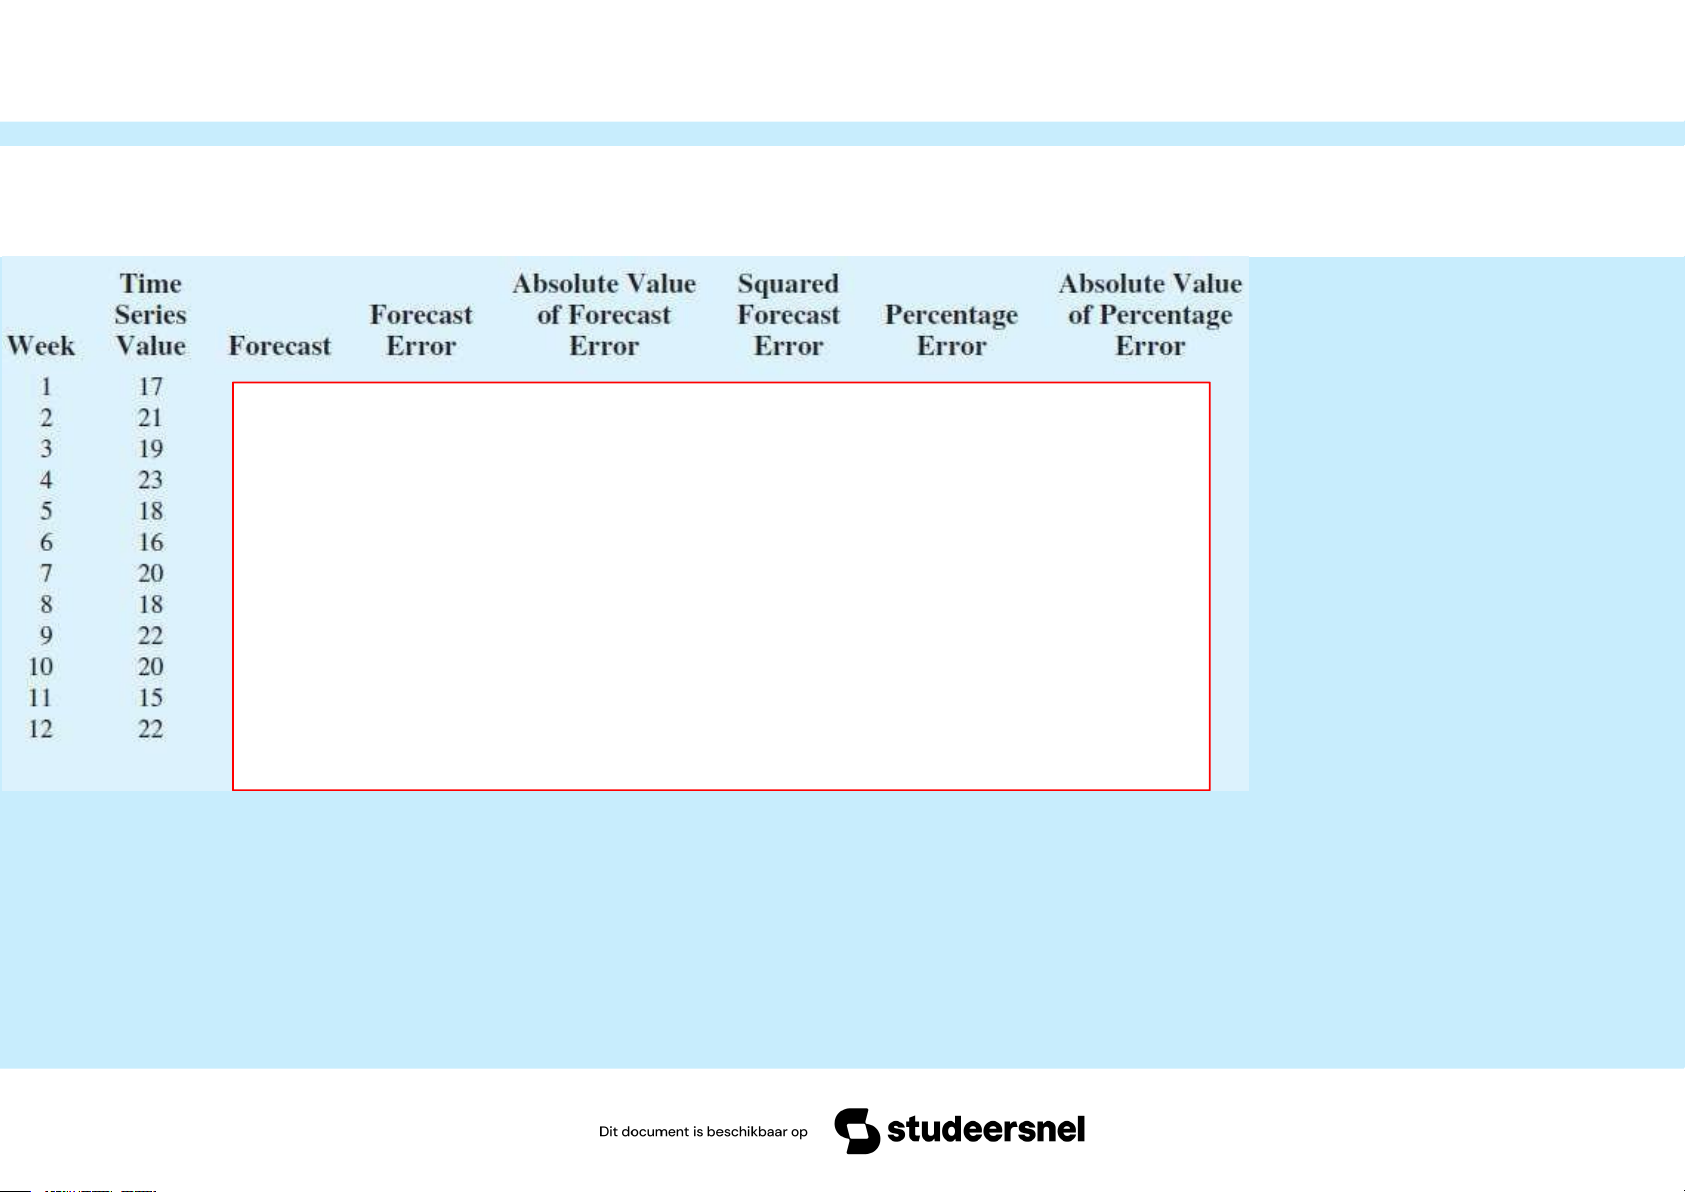
Measures if your model is working TS = MAD tttu@hcmiu.edu.vn 15 These measures of forecast accuracy simply measure how wel the forecasting method is able to forecast historical values of the time series. tttu@hcmiu.edu.vn 16 tttu@hcmiu.edu.vn 17 tttu@hcmiu.edu.vn 18 HOMEWORKS (1)
Note: Each table for each method
Compute the forecasts and measures of forecast accuracy, using:
1. Weighted moving averages as the forecast for the next period, assuming that:
- Period is 3-week observations
- The assigned weights: 3/6 to the most recent observation, 2/6 to the second most
recent observation, and 1/6 to the third most recent observation tttu@hcmiu.edu.vn 19 HOMEWORKS (2)
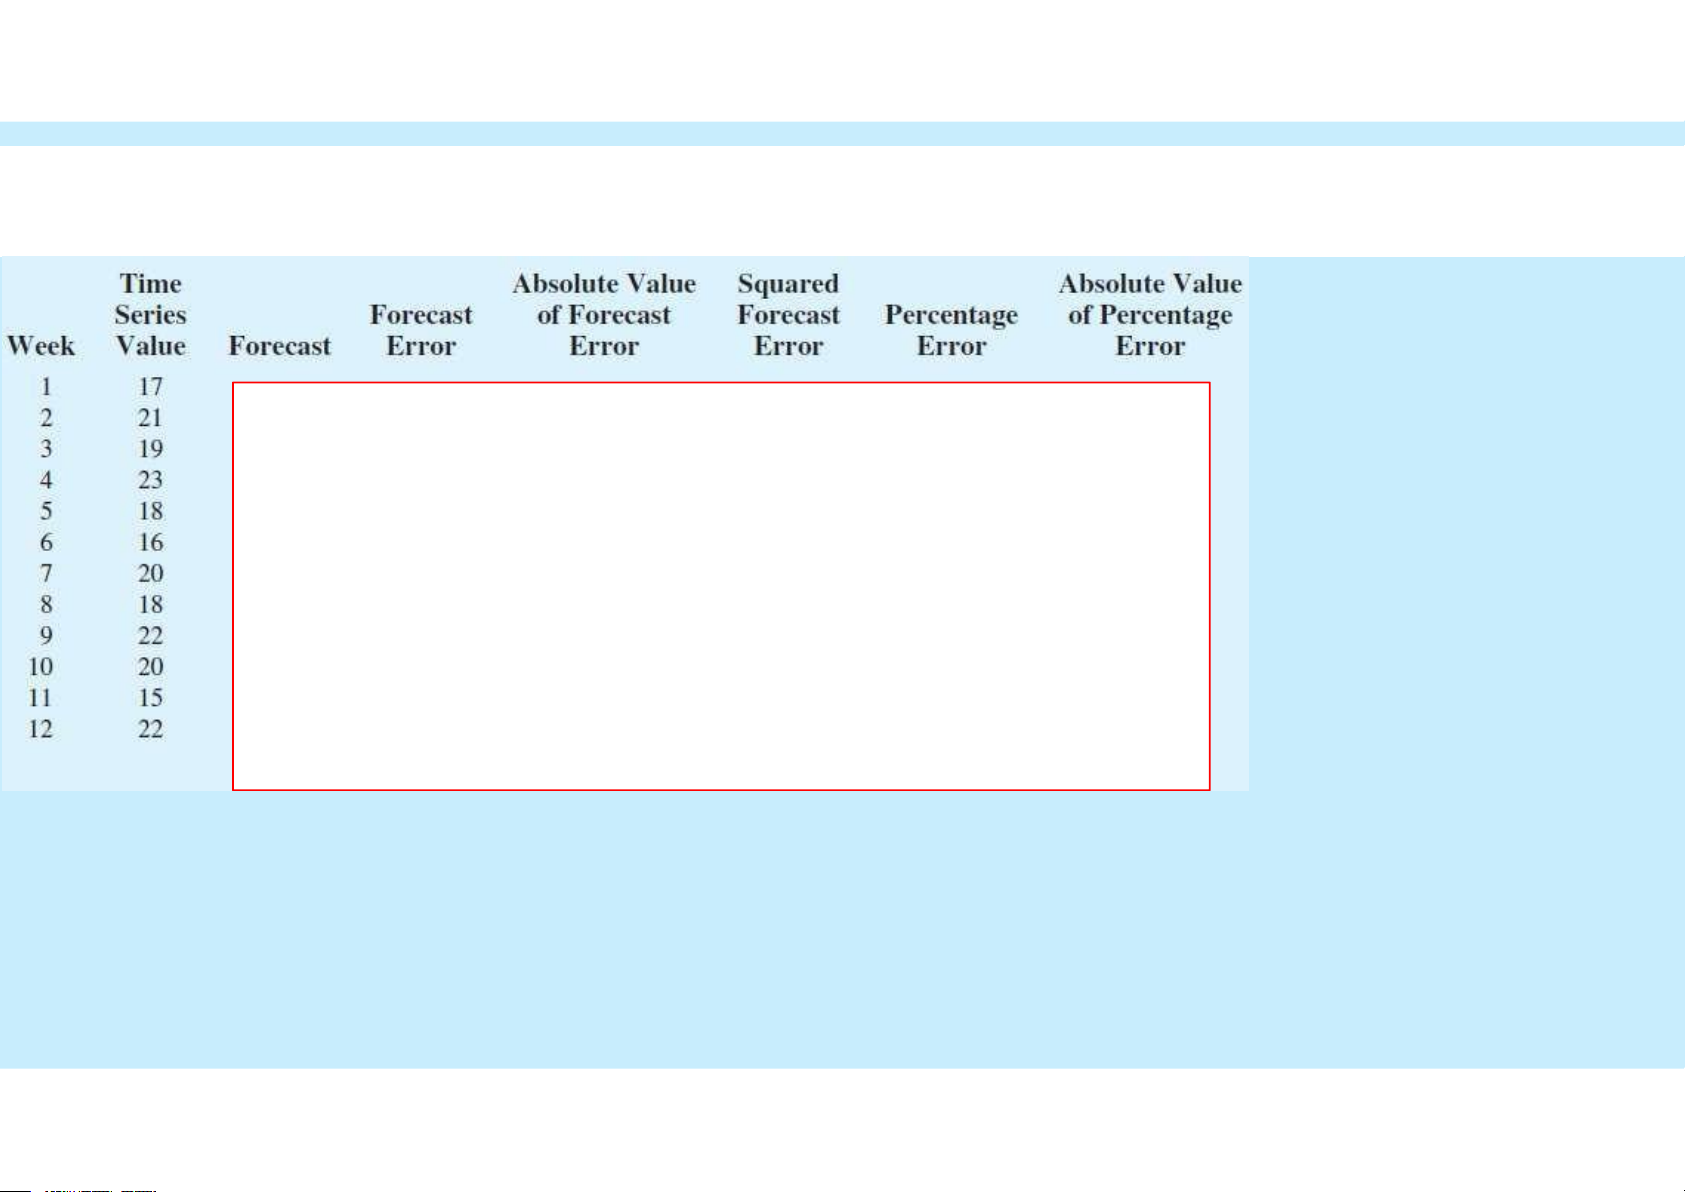
Note: Each table for each method
Compute the forecasts and measures of forecast accuracy, using:
2. Exponential smoothing, assuming that: - α = 0.4 tttu@hcmiu.edu.vn 20
Tài liệu liên quan:
-
Đề cương môn Thương mại điện tử - trường đại học kinh tế- tài chính thành phố Hồ chí minh
60 30 -
Báo cáo cuối kỳ môn Thương mại điện tử - trường đại học kinh tế- tài chính thành phố Hồ chí minh
80 40 -

Đề cương môn Thương mại điện tử - trường đại học kinh tế- tài chính thành phố Hồ chí minh
56 28 -
Đề cương môn Thương mại điện tử - trường đại học kinh tế- tài chính thành phố Hồ chí minh.
53 27