Lecture 3: Data Preprocessing Overview and Techniques | Môn Data Mining - Trường Đại học Quốc tế, Đại học Quốc gia Thành phố Hồ Chí Minh
Lecture 3: Data Preprocessing Overview and Techniques Môn Data Mining. Tài liệu được sưu tầm gồm 36 trang, giúp bạn ôn tập tốt hơn. Mời các bạn đón xem.
Môn: Data Mining 10 tài liệu
Trường: Trường Đại học Quốc tế, Đại học Quốc gia Thành phố Hồ Chí Minh 2 K tài liệu
Tác giả:


Preview text:
lOMoAR cPSD| 23136115 2 / 1 6 / 2 0 2 5 Lecture 3: 1 Data preprocessing
Lecturer: Dr. Nguyen, Thi Thanh Sang (nttsang@hcmiu.edu.vn) References:
Chapter 3 in Data Mining: Concepts and Techniques (Third Edition), by Jiawei Han, Micheline Kamber 1 2 lOMoAR cPSD| 23136115 2 / 1 6 / 2 0 2 5 Data Preprocessing 2
Data Preprocessing: An Overview Data Quality
Major Tasks in Data Preprocessing Data Cleaning Data Integration Data Reduction
Data Transformation and Data Discretization Summary 3 3
Major Tasks in Data Preprocessing Data cleaning lOMoAR cPSD| 23136115 3 2 / 1 6
Fill in missing values, smooth noisy data, identify or / 2 0 2 5
remove outliers, and resolve inconsistencies Data integration
Integration of multiple databases, data cubes, or files Data reduction Dimensionality reduction Numerosity reduction Data compression
Data transformation and data discretization Normalization Concept hierarchy generation 5 5 Data Cleaning
Data in the Real World Is Dirty: Lots of potentially incorrect data, e.g., instrument faulty,
human or computer error, transmission error
incomplete: lacking attribute values, lacking certain attributes of 4 interest, or containing only aggregate data
e.g., Occupation = “ ” (missing data)
noisy: containing noise, errors, or outliers
e.g., Salary = “−10” (an error) lOMoAR cPSD| 23136115 2 / 1 6 / 2 0 2 5
inconsistent: containing discrepancies in codes or names, e.g.,
Age = “42”, Birthday = “03/07/2010”
Was rating “1, 2, 3”, now rating “A, B, C”
discrepancy between duplicate records
Intentional (e.g., disguised missing data) Jan. 1 as everyone’s birthday? 7 7 How to Handle Missing Data?
Ignore the tuple: usually done when class label is missing
(when doing classification)—not effective when the % of
missing values per attribute varies considerably 5
Fill in the missing value manually: tedious + infeasible?
Fill in it automatically with
a global constant : e.g., “unknown”, a new class?! lOMoAR cPSD| 23136115 2 / 1 6 / 2 0 2 5 the attribute mean
the attribute mean for all samples belonging to the same class: smarter
the most probable value: inference-based such as
Bayesian formula or decision tree 9 9 technology limitation
inconsistency in naming convention How to Handle Noisy Data? Binning 6
first sort data and partition into (equal-frequency) bins
then one can smooth by bin means, smooth by bin median, smooth
by bin boundaries, etc. Regression
smooth by fitting the data into regression functions lOMoAR cPSD| 23136115 2 / 1 6 / 2 0 2 5 Clustering detect and remove outliers
Combined computer and human inspection
detect suspicious values and check by human (e.g., deal with possible outliers) 11 11 lOMoAR cPSD| 23136115 2 / 1 6 / 2 0 2 5 Data Preprocessing 7
Data Preprocessing: An Overview Data Quality
Major Tasks in Data Preprocessing Data Cleaning Data Integration Data Reduction
Data Transformation and Data Discretization Summary 13 13 lOMoAR cPSD| 23136115 2 / 1 6 / 2 0 2 5
Handling Redundancy in Data Integration
Redundant data occur often when integration of multiple databases 8
Object identification: The same attribute or object may
have different names in different databases
Derivable data: One attribute may be a “derived” attribute
in another table, e.g., annual revenue
Redundant attributes may be able to be detected by correlation analysis and covariance analysis
Careful integration of the data from multiple sources may help
reduce/avoid redundancies and inconsistencies and improve mining speed and quality 15 15 2 larger
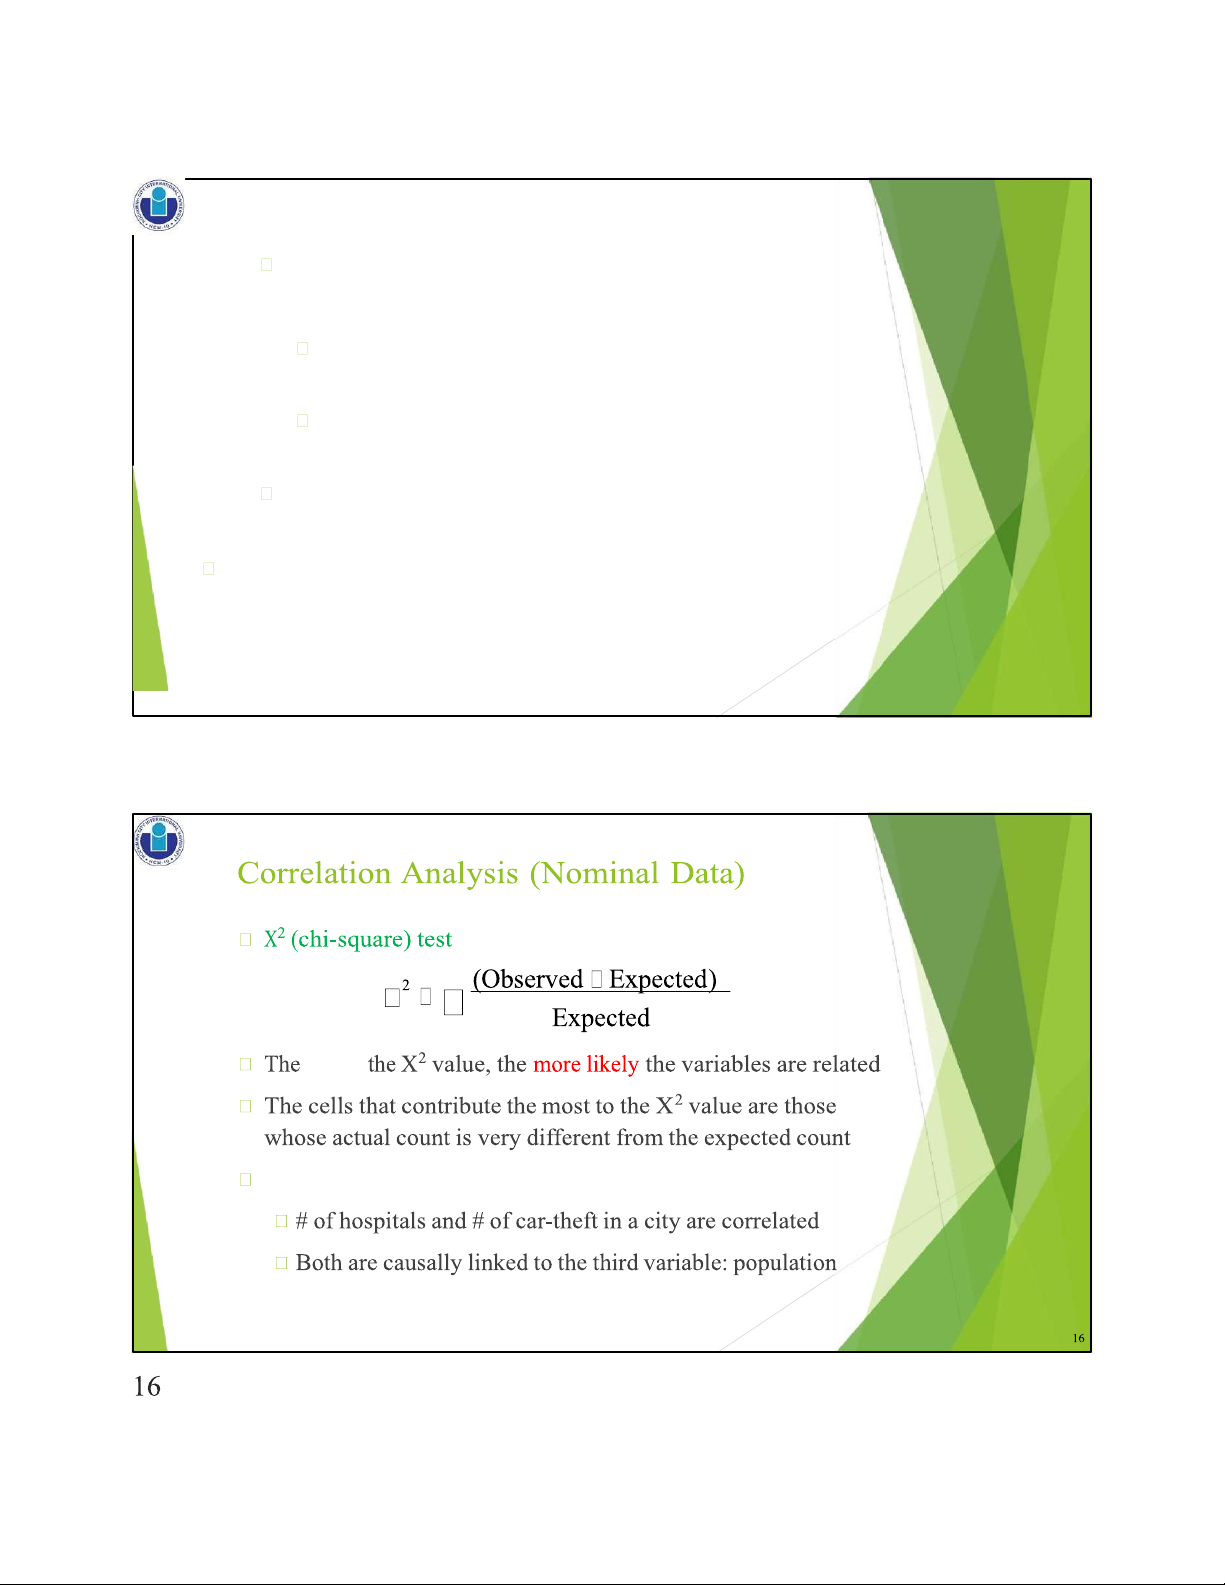
Correlation does not imply causality lOMoAR cPSD| 23136115 2 / 1 6 / 2 0 2 5
Chi-Square Calculation: An Example Play chess Not play chess Sum (row) 9 Like science fiction 250(90) 200(360) 450 Not like science fiction 50(210) 1000(840) 1050 Sum(col.) 300 1200 1500 Χ2 (chi-square) calculation
(numbers in parenthesis are expected counts calculated based on the data
distribution in the two categories) 2 (250 90)2 (50 210)2 (200 360)2 (1000 840)2 507.93 90 210 360 840
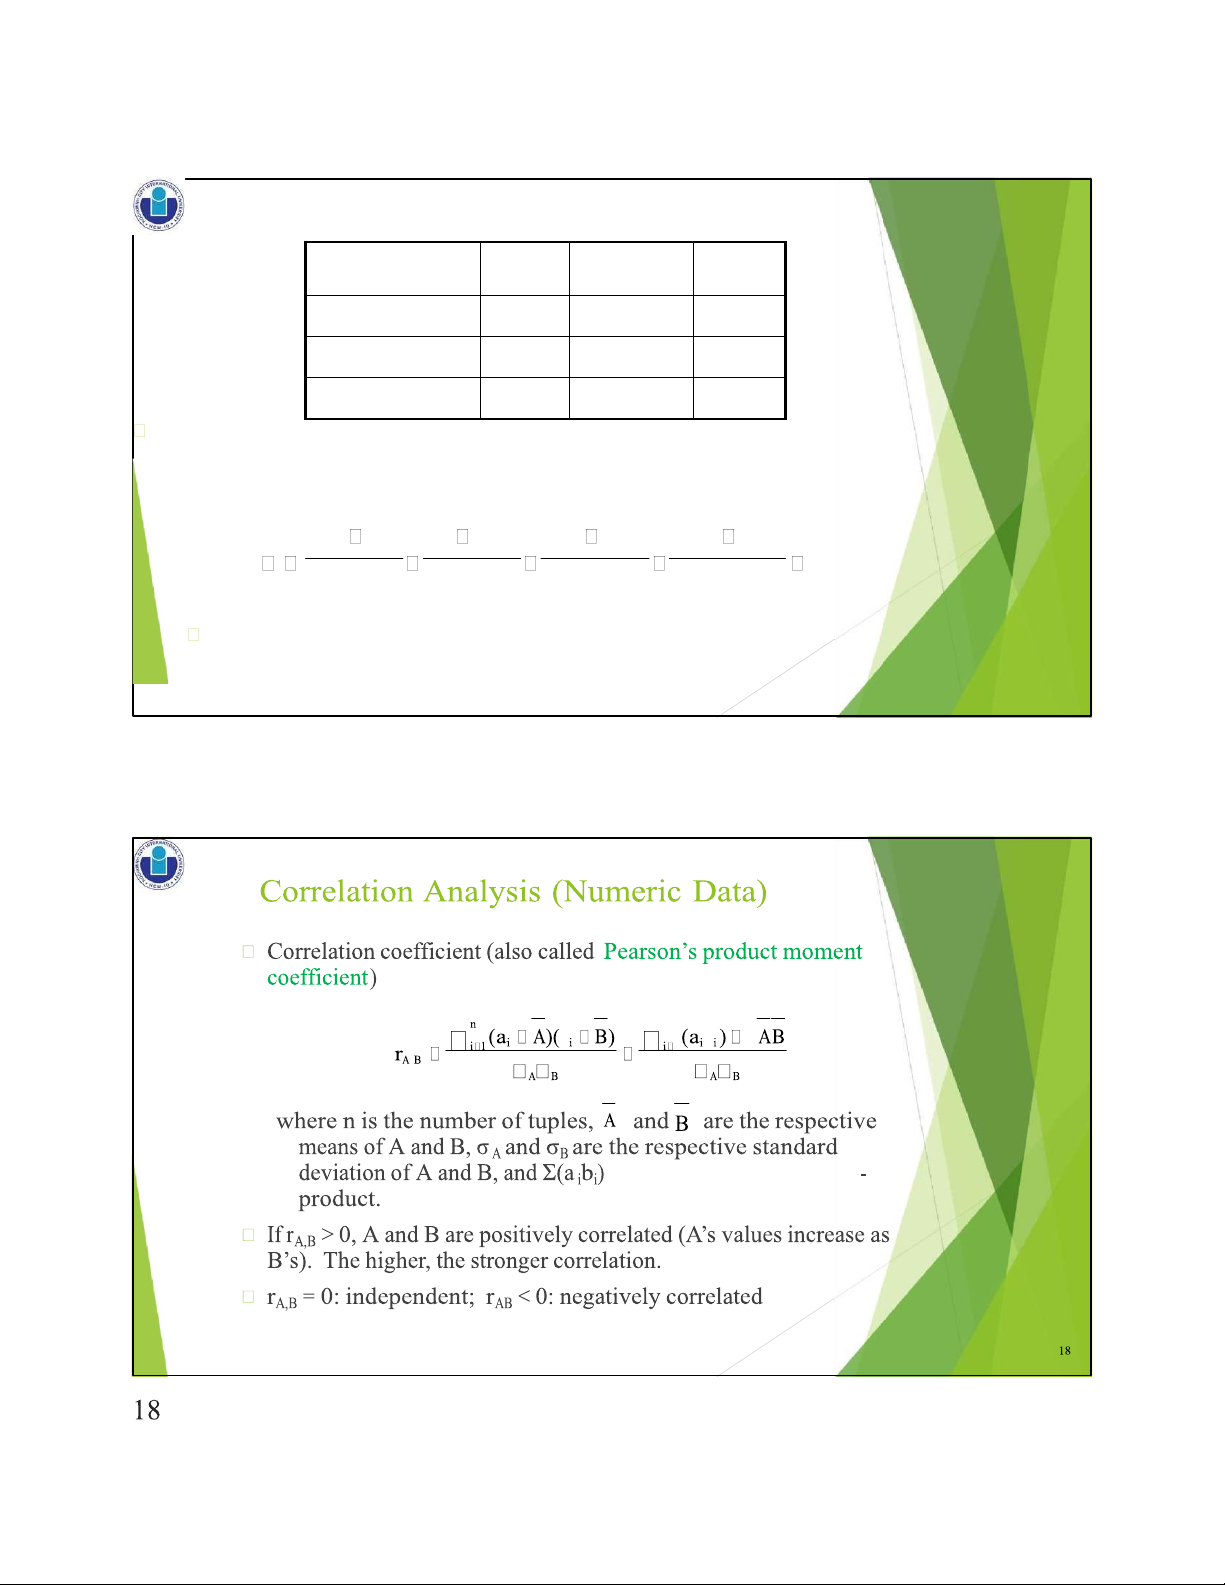
It shows that like_science_fiction and play_chess are correlated in the group 17 17 n b 1 b n , n n is the sum of the AB cross lOMoAR cPSD| 23136115 2 / 1 6 / 2 0 2 5
Correlation (viewed as linear relationship)
Correlation measures the linear relationship between objects 1 0
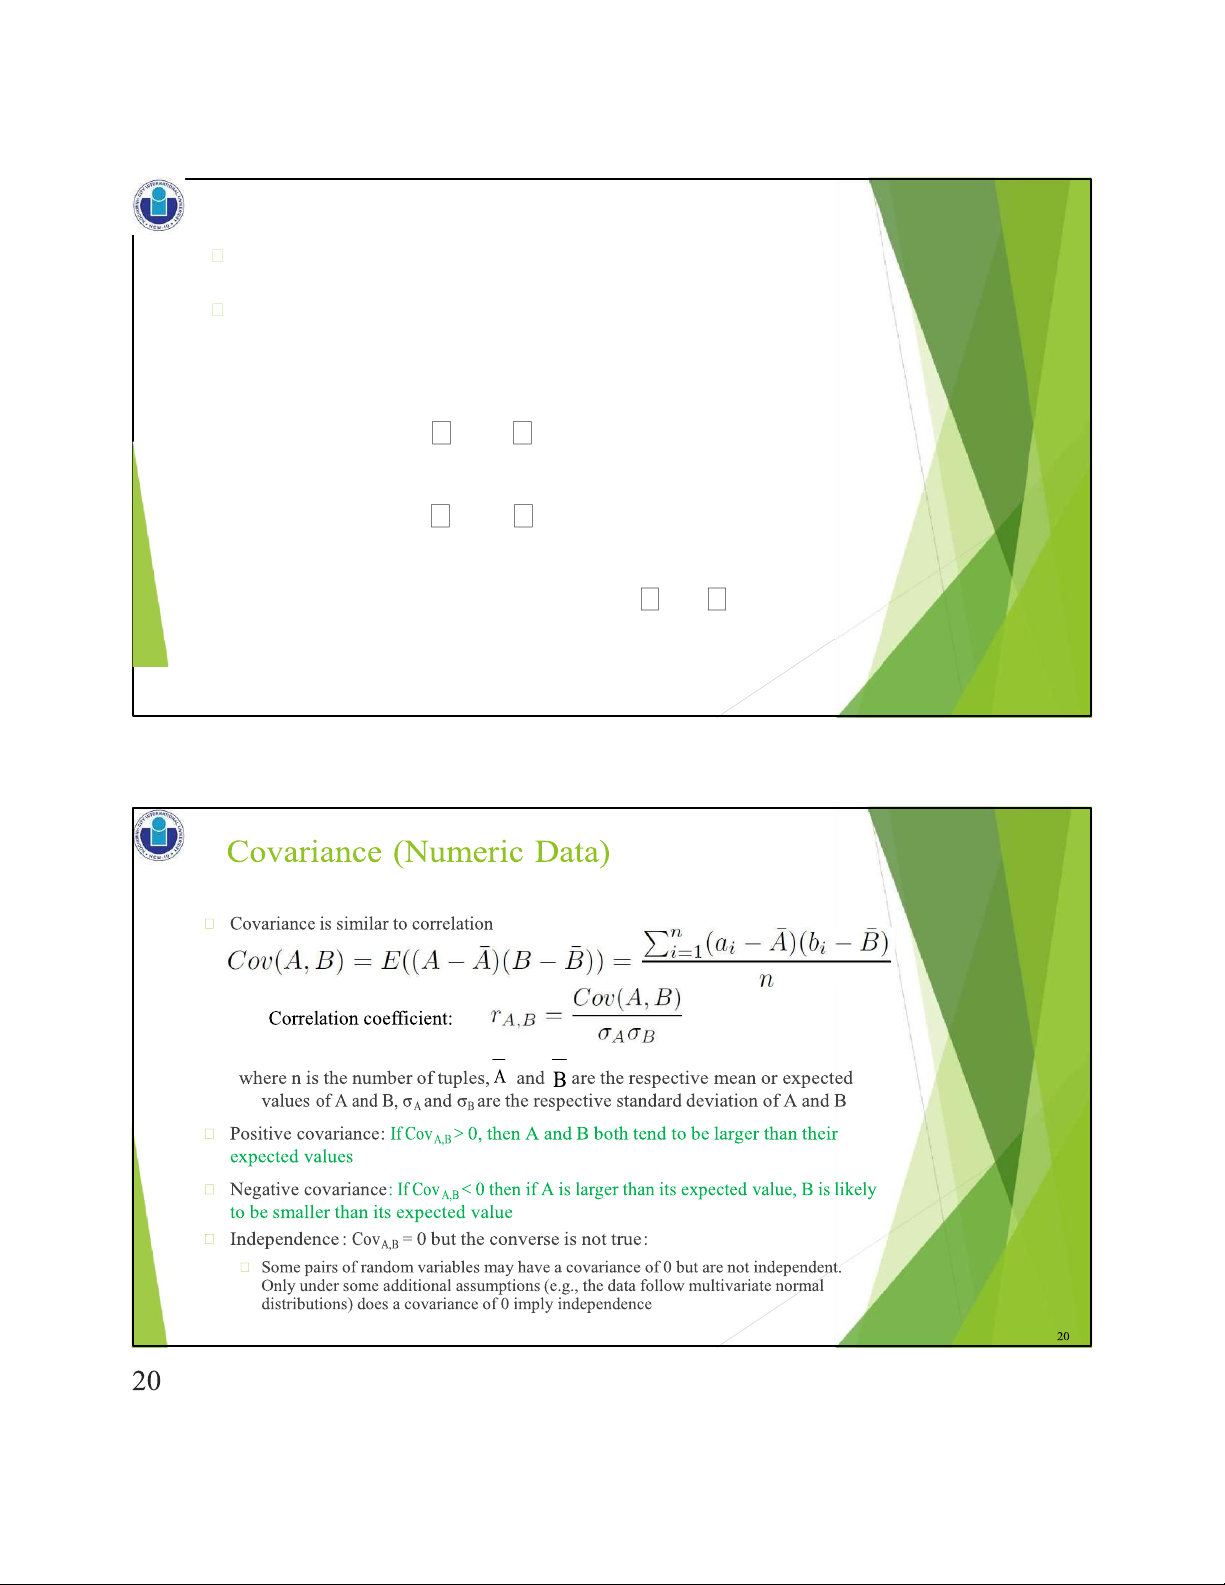
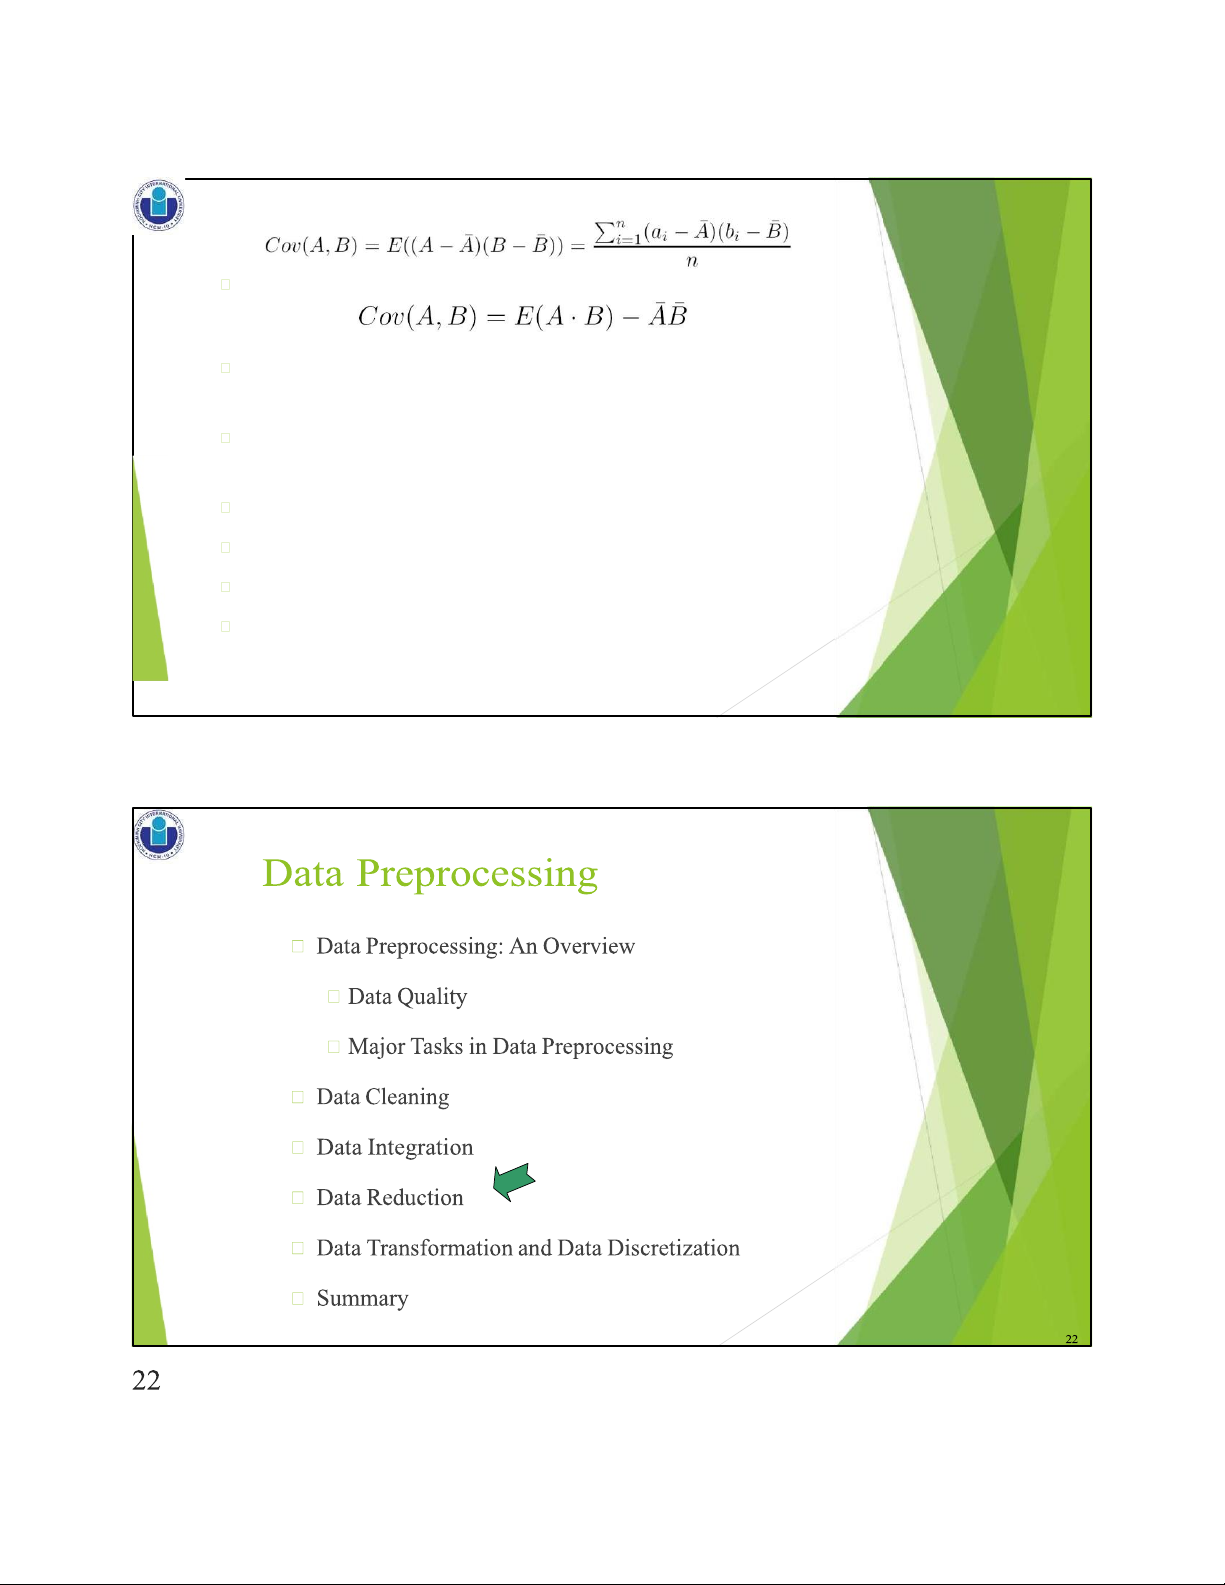
To compute correlation, we standardize data objects, A and B, and then take their dot product a'k (ak mean(A)) / std(A) b'k (bk mean(B)) / std(B) correlation(A, B) A' B' 19 19 lOMoAR cPSD| 23136115 2 / 1 6 / 2 0 2 5 Co-Variance: An Example
It can be simplified in computation as 1 1
Suppose two stocks A and B have the following values in one week: (2, 5), (3, 8), (5, 10), (4, 11), (6, 14).
Question: If the stocks are affected by the same industry trends, will their prices rise or fall together?
E(A) = (2 + 3 + 5 + 4 + 6)/ 5 = 20/5 = 4
E(B) = (5 + 8 + 10 + 11 + 14) /5 = 48/5 = 9.6
Cov(A,B) = (2×5+3×8+5×10+4×11+6×14)/5 − 4 × 9.6 = 4
Thus, A and B rise together since Cov(A, B) > 0. 21 lOMoAR cPSD| 23136115 2 / 1 6 / 2 0 2 5 Data Reduction Strategies
Data reduction: Obtain a reduced representation of the data set that is much
smaller in volume but yet produces the same (or almost the same) analytical results
Why data reduction? — A database/data warehouse may store terabytes of data. Complex 1 2
data analysis may take a very long time to run on the complete data set. Data reduction strategies
Dimensionality reduction, e.g., remove unimportant attributes Wavelet transforms
Principal Components Analysis (PCA)
Feature subset selection, feature creation
Numerosity reduction (some simply call it: Data Reduction)
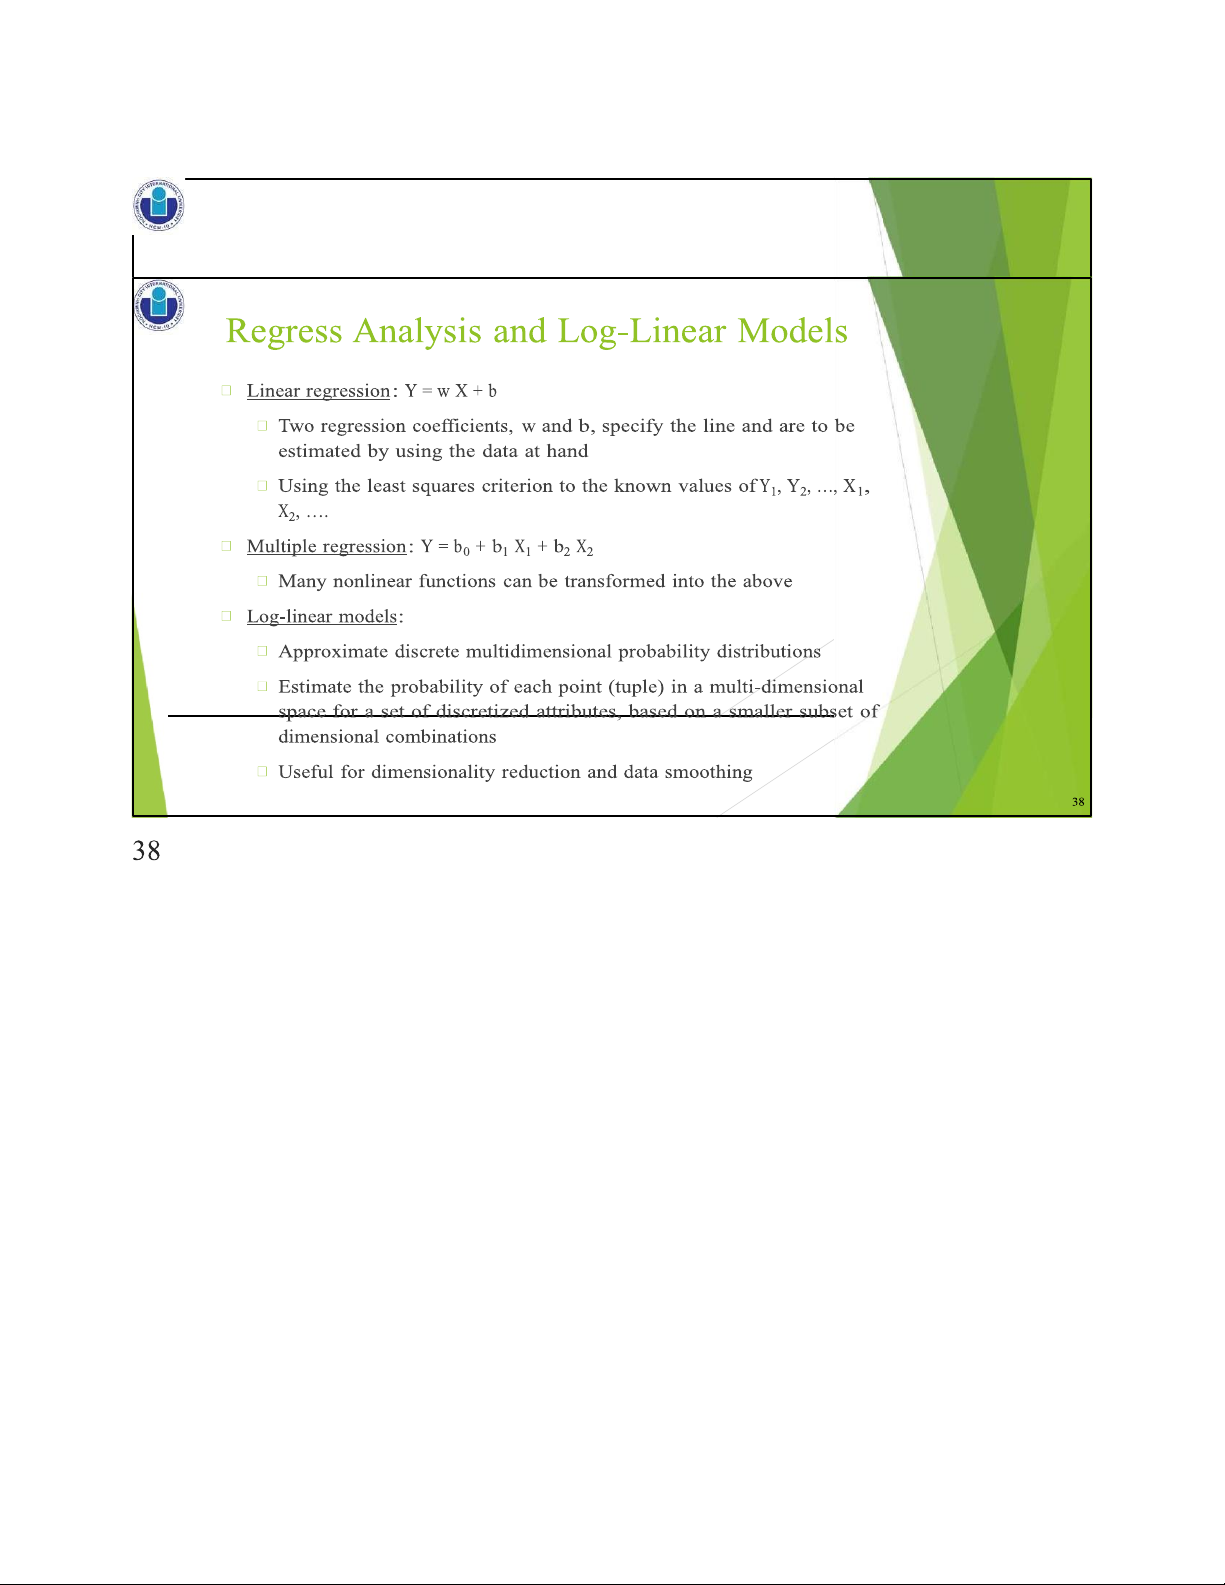
Regression and Log-Linear Models
Histograms, clustering, sampling Data cube aggregation Data compression 23 23
analysis, becomes less meaningful
The possible combinations of subspaces will grow exponentially lOMoAR cPSD| 23136115 2 / 1 6 / 2 0 2 5 Mapping Data to a New Space Fourier transform Wavelet transform 1 3 25 25 Decomposes a signal into Allow natural clusters to lOMoAR cPSD| 23136115 2 / 1 6 / 2 0 2 5 Wavelet Transformation
Discrete wavelet transform (DWT) for linear signal processing, multi- resolution analysis 1 4
Compressed approximation: store only a small fraction of the strongest of the wavelet coefficients
Similar to discrete Fourier transform (DFT), but better lossy
compression, localized in space Method:
Length, L, must be an integer power of 2 (padding with 0’s, when necessary)
Each transform has 2 functions: smoothing, difference
Applies to pairs of data, resulting in two set of data of length L/2
Applies two functions recursively, until reaches the desired length 27 27
Wavelets: A math tool for space-efficient hierarchical
S = [2, 2, 0, 2, 3, 5, 4, 4] can be transformed to S
Compression: many small detail coefficients can be replaced by lOMoAR cPSD| 23136115 2 / 1 6 / 2 0 2 5 Why Wavelet Transform? Use hat-shape filters
Emphasize region where points cluster 1 5
Suppress weaker information in their boundaries
Effective removal of outliers
Insensitive to noise, insensitive to input order Multi-resolution
Detect arbitrary shaped clusters at different scales Efficient Complexity O(N)
Only applicable to low dimensional data 29 29 x 2 1 lOMoAR cPSD| 23136115 2 / 1 6 / 2 0 2 5
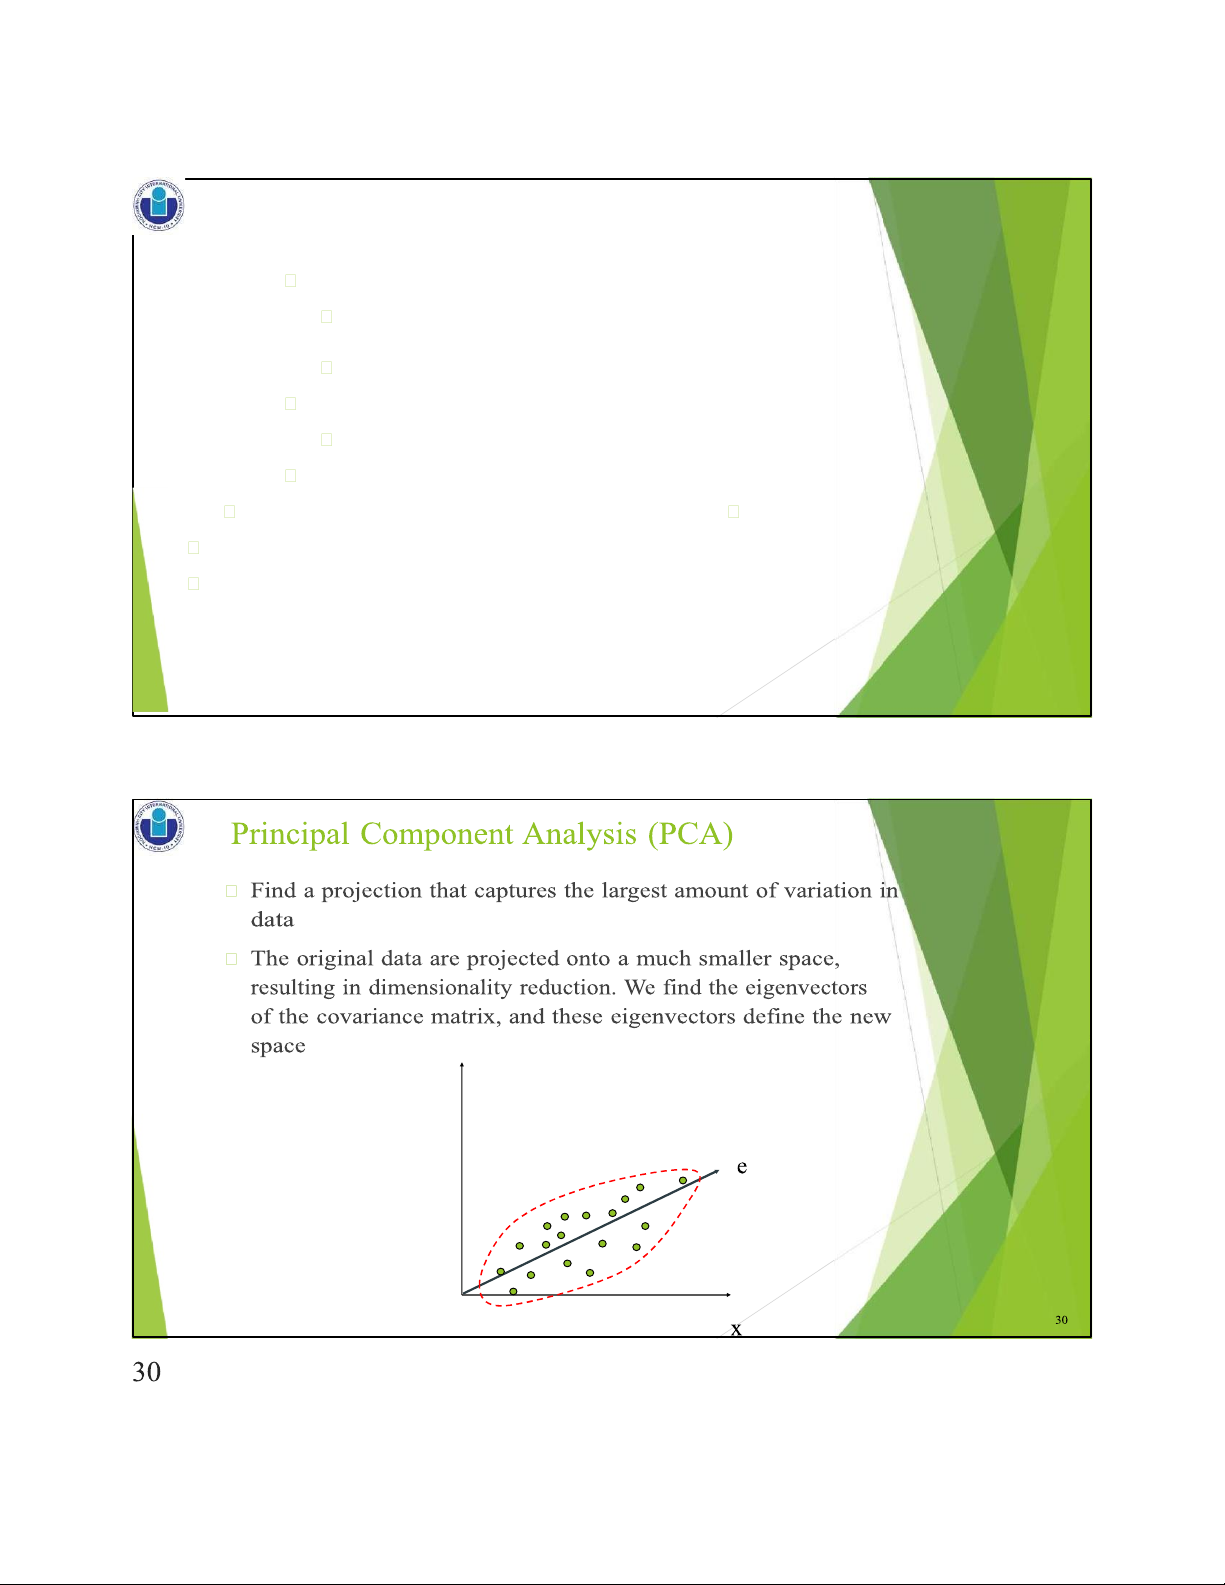
Principal Component Analysis (Steps)
Given N data vectors from n-dimensions, find k ≤ n orthogonal vectors
(principal components) that can be best used to represent data 1 6
Compute k orthonormal (unit) vectors, i.e., principal components
Each input data (vector) is a linear combination of the k principal component vectors
The principal components are sorted in order of decreasing
Normalize input data: Each attribute falls within the same range
“significance” or strength
Since the components are sorted, the size of the data can be reduced by eliminating
the weak components, i.e., those with low variance (i.e., using the strongest
principal components, it is possible to reconstruct a good approximation of the original data) Works for numeric data only 31 lOMoAR cPSD| 23136115 2 / 1 6 / 2 0 2 5 31
Heuristic Search in Attribute Selection
There are 2d possible attribute combinations of d attributes
Typical heuristic attribute selection methods: 1 7
Best single attribute under the attribute independence
assumption: choose by significance tests Best step-wise feature selection:
The best single-attribute is picked first
Then next best attribute condition to the first, ...
Step-wise attribute elimination:
Repeatedly eliminate the worst attribute
Best combined attribute selection and elimination Optimal branch and bound:
Use attribute elimination and backtracking 33 lOMoAR cPSD| 23136115 2 / 1 6 / 2 0 2 5 33
Data Reduction 2: Numerosity Reduction
Reduce data volume by choosing alternative, smaller forms of data representation 1 8
Assume the data fits some model, estimate model parameters,
store only the parameters, and discard the data (except possible outliers)
Ex.: Log-linear models—obtain value at a point in m-
D space as the product on appropriate marginal
Parametric methods (e.g., regression) subspaces Non-parametric methods Do not assume models lOMoAR cPSD| 23136115 2 / 1 6 / 2 0 2 5
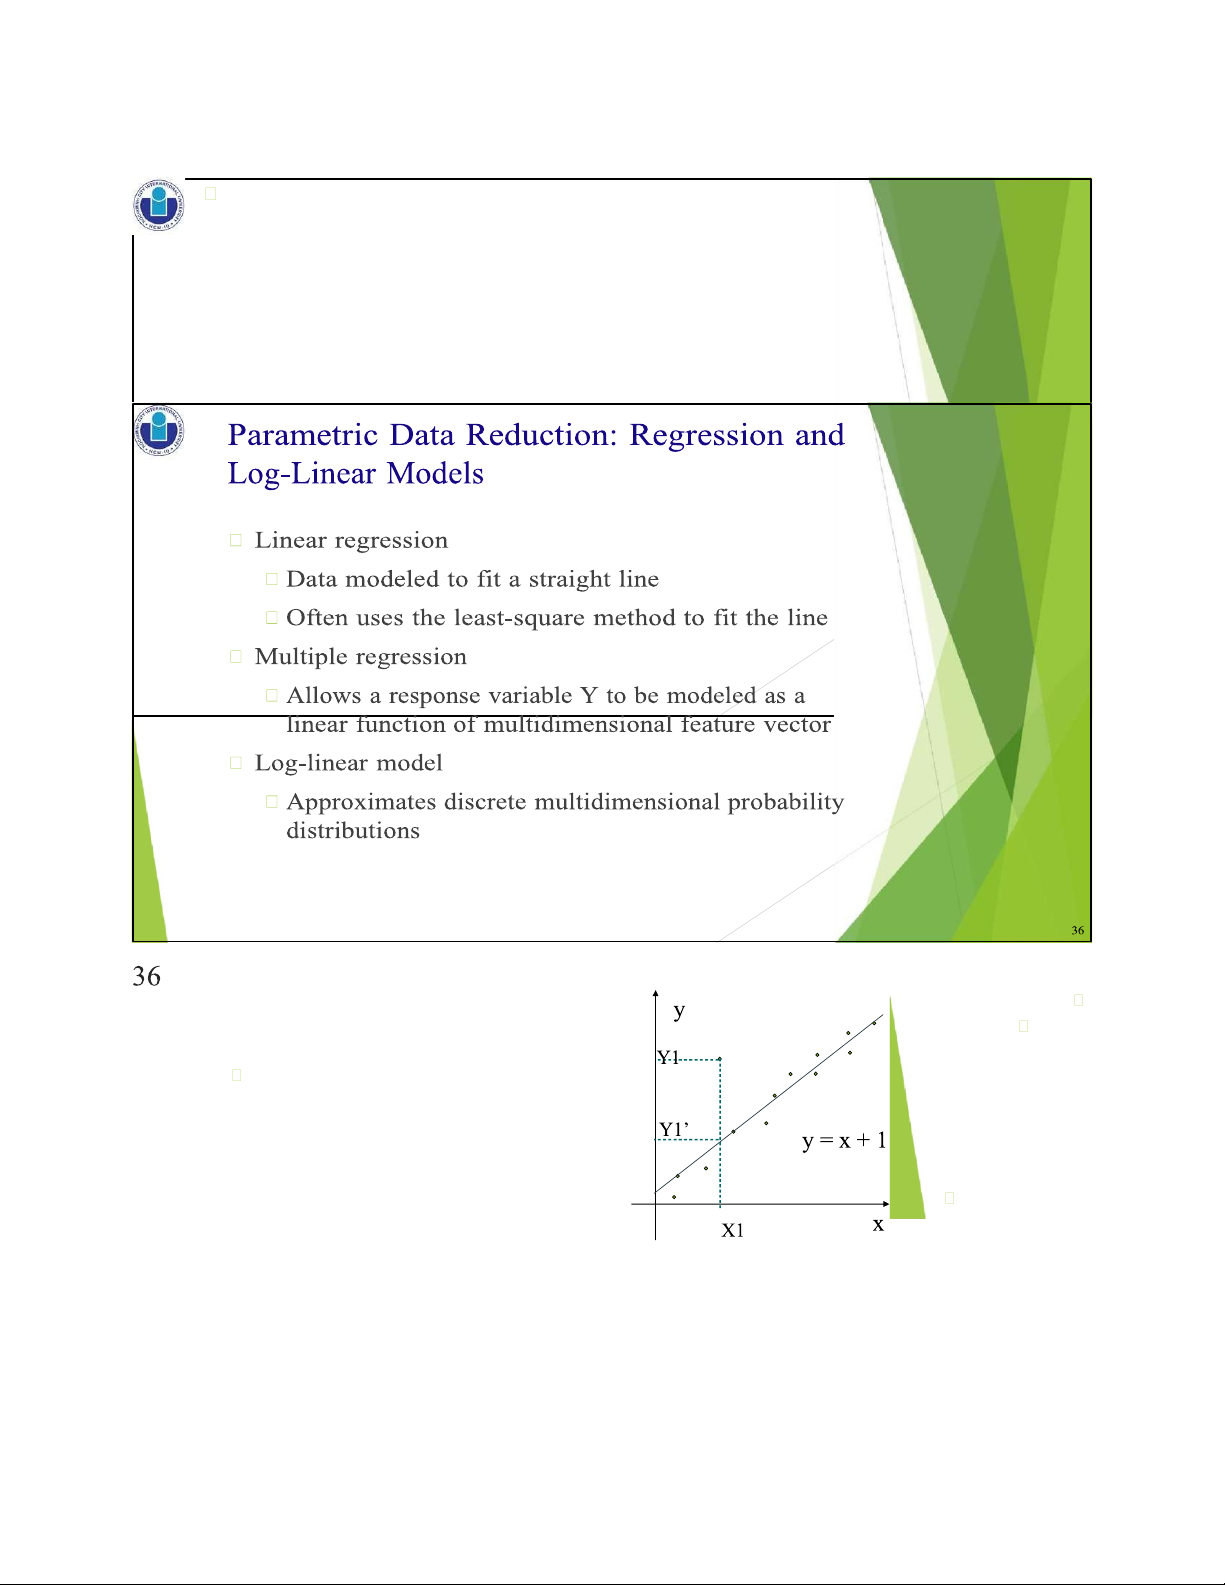
Major families: histograms, clustering, sampling, … 35 35 Regression Analysis The parameters are
Regression analysis: A collective name for estimated so
techniques for the modeling and analysis of as to give a
numerical data consisting of values of a "best fit" of the data
dependent variable (also called response
variable or measurement) and of one or more Most
independent variables (aka. explanatory commonly variables or predictors)
the best fit is evaluated by using
the least squares method, but other criteria have also been used lOMoAR cPSD| 23136115 2 / 1 6 / 2 0 2 5 37 1 9
Used for prediction (including forecasting
of time-series data), inference, hypothesis
testing, and modeling of causal relationships 37
Tài liệu liên quan:
-

Notes: Key Concepts and Techniques | Môn Data Mining - Trường Đại học Quốc tế, Đại học Quốc gia Thành phố Hồ Chí Minh
104 52 -
Lecture 6: Decision Tree & Bayesian Classification | Môn Data Mining - Trường Đại học Quốc tế, Đại học Quốc gia Thành phố Hồ Chí Minh
124 62 -

Lab 5: Integrating Processes and Ethics | Môn Data Mining - Trường Đại học Quốc tế, Đại học Quốc gia Thành phố Hồ Chí Minh
111 56 -

Lecture 4: Knowledge Representation | Môn Data Mining - Trường Đại học Quốc tế, Đại học Quốc gia Thành phố Hồ Chí Minh
107 54