Management Science: Chapter 1 Introduction & Key Objectives Overview | Kinh tế vĩ mô | Trường Đại học kinh tế Thành Phố Hồ Chí Minh
Some people approach management science with a certain amount of anxiety and skepti- cism. The main source of the anxiety is the reputation of the field as being highly mathemati- cal. This reputation then generates skepticism that such a theoretical approach can have much relevance for dealing with practical managerial problems. Most traditional courses (and text- books) about management science have only reinforced these perceptions by emphasizing the mathematics of the field rather than its practical application. Tài liệu được sưu tầm và soạn thảo dưới dạng file PDF để gửi tới các bạn cùng tham khảo, ôn tập đầy đủ kiến thức, chuẩn bị cho các buổi học thật tốt. Mời bạn đọc đón xem!
Môn: Kinh tế vi mô (ECO501) 93 tài liệu
Trường: Đại học Kinh tế Thành phố Hồ Chí Minh 3 K tài liệu
Tác giả:

Preview text:
Chapter One Introduction Learning Objectives
After completing this chapter, you should be able to
1. Define the term management science.
2. Describe the nature of management science.
3. Explain what a mathematical model is.
4. Use a mathematical model to perform break-even analysis.
5. Use a spreadsheet model to perform break-even analysis.
6. Describe the relationship between analytics and management science.
7. Identify the levels of annual savings that management science sometimes can provide to organizations.
8. Identify some special features of this book.
Welcome to the field of management science! We think that it is a particularly exciting and
interesting field. Exciting because management science is having a dramatic impact on the
profitability of numerous business firms around the world. Interesting because the methods
used to do this are so ingenious. We are looking forward to giving you a guided tour to intro-
duce you to the special features of the field.
Some people approach management science with a certain amount of anxiety and skepti-
cism. The main source of the anxiety is the reputation of the field as being highly mathemati-
cal. This reputation then generates skepticism that such a theoretical approach can have much
relevance for dealing with practical managerial problems. Most traditional courses (and text-
books) about management science have only reinforced these perceptions by emphasizing the
mathematics of the field rather than its practical application.
Rest easy. This is not a traditional management science textbook. We realize that most
readers of this book are aspiring to become managers, not mathematicians. Therefore, the
emphasis throughout is on conveying what a future manager needs to know about manage-
ment science. Yes, this means including a little mathematics here and there, because it is a
major language of the field. The mathematics you do see will be at the level of high school
algebra plus (in the later chapters) basic concepts of elementary probability theory. We think
you will be pleasantly surprised by the new appreciation you gain for how useful and intuitive
mathematics at this level can be. However, managers do not need to know any of the heavy
mathematical theory that underlies the various techniques of management science. Therefore,
the use of mathematics plays only a strictly secondary role in the book.
One reason we can deemphasize mathematics is that powerful spreadsheet software is
available for applying management science. Spreadsheets provide a comfortable and familiar
environment for formulating and analyzing managerial problems. The spreadsheet takes care
of applying the necessary mathematics automatically in the background with only a minimum
of guidance by the user. This has revolutionized the use of management science. In the past,
technically trained management scientists were needed to carry out significant management
science studies for management. Now spreadsheets are bringing many of the tools and con-
cepts of management science within the reach of managers for conducting their own analyses.
Although busy managers will continue to call upon management science teams to conduct
major studies for them, they are increasingly becoming direct users themselves through the 1 2 Chapter One Introduction
medium of spreadsheet software. Therefore, since this book is aimed at future managers (and
management consultants), we will emphasize the use of spreadsheets for applying manage- ment science.
What does an enlightened future manager need to learn from a management science course?
1. Gain an appreciation for the relevance and power of management science. (Therefore, we
include many application vignettes throughout the book that give examples of actual appli-
cations of management science and the impact they had on the organizations involved.)
2. Learn to recognize when management science can (and cannot) be fruitfully applied.
(Therefore, we will emphasize the kinds of problems to which the various management
science techniques can be applied.)
3. Learn how to apply the major techniques of management science to analyze a variety of man-
agerial problems. (Therefore, we will focus largely on how spreadsheets enable many such
applications with no more background in management science than provided by this book.)
4. Develop an understanding of how to interpret the results of a management science study.
(Therefore, we will present many case studies that illustrate management science studies
and how their results depend on the assumptions and data that were used.)
The objectives just described are the key teaching goals of this book.
We begin this process in the next four sections by introducing the nature of management
science and the impact that it is having on many organizations. (This process will continue
throughout the remaining chapters as well.) Section 1.5 then points out some of the special
features of this book that you can look forward to seeing in the subsequent chapters.
1.1 THE NATURE OF MANAGEMENT SCIENCE
What is the name management science (sometimes abbreviated MS) supposed to convey? It
does involve management and science or, more precisely, the science of management, but this
still is too vague. Here is a more suggestive definition.
Management science is a discipline that attempts to aid managerial decision making by applying
a scientific approach to managerial problems that involve quantitative factors.
Now let us see how elaborating upon each of the italicized terms in this definition conveys
much more about the nature of management science.
Management Science Is a Discipline
As a discipline, management science is a whole body of knowledge and techniques that are
based on a scientific foundation. For example, it is analogous in some ways to the medical
field. A medical doctor has been trained in a whole body of knowledge and techniques that
are based on the scientific foundations of the medical field. After receiving this training and
entering practice, the doctor must diagnose a patient’s illness and then choose the appropriate
medical procedures to apply to the illness. The patient then makes the final decision on which
medical procedures to accept. For less serious cases, the patient may choose not to consult
a doctor and instead use his own basic knowledge of medical principles to treat himself.
Similarly, a management scientist must receive substantial training (albeit considerably less
than for a medical doctor). This training also is in a whole body of knowledge and techniques
that are based on the scientific foundations of the discipline. After entering practice, the
management scientist must diagnose a managerial problem and then choose the appropriate
management science techniques to apply in analyzing the problem. The cognizant manager
then makes the final decision as to which conclusions from this analysis to accept. For less
extensive managerial problems where management science can be helpful, the manager may
choose not to consult a management scientist and instead use his or her own basic knowledge
of management science principles to analyze the problem.
Although it has considerably longer roots, the rapid development of the discipline began in
the 1940s and 1950s. The initial impetus came early in World War II, when large numbers of
scientists were called upon to apply a scientific approach to the management of the war effort
1.1 The Nature of Management Science 3
for the allies. When the war ended, the success of this approach in the war effort spurred inter-
est in applying it outside the military as well. By the early 1950s, substantial applications of
management science were being seen in a variety of organizations in business, industry, and government.
Another landmark event in the history of management science was the discovery in 1947
by George Dantzig of the simplex method for solving linear programming problems. (Lin-
ear programming is the subject of several early chapters.) Considerable progress in develop-
ing the other techniques of management science also occurred throughout the middle of the
20th century. However, the very limited computational power available at that time (whether
when doing the computations by hand or with the relatively primitive electronic computers of
the day) prevented applying these techniques except to small problems. Fortunately, another
factor that gave great impetus to the growth of the discipline ever since that time was the
onslaught of the computer revolution. Even massive problems usually can be solved now with today’s powerful computers.
The traditional name given to the discipline (and the one that still is widely used today operations research
outside of business schools) is operations research .This name was applied because the Management science began
teams of scientists in World War II were doing research on how to manage military opera- its rapid development dur-
tions. The abbreviation OR also is widely used. This abbreviation often is combined with the ing World War II with the
one for management science (MS), thereby referring to the discipline as OR/MS. Accord- name operations research.
ing to estimates from the U.S. Bureau of Labor Statistics in 2015, there were approximately
96,000 individuals at that time working as operations research analysts in the United States
(some with just a B.S. degree) with an average annual salary of about $84,000. The Bureau
also forecasted that this number of individuals working as operations research analysts would
grow by 30 percent over the subsequent decade.
Another discipline that is closely related to management science is analytics (sometimes
called business analytics when dealing with business problems). Like management science,
analytics attempts to aid managerial decision making but with particular emphasis on three
types of analysis: (1) descriptive analytics—the use of data (sometimes massive amounts of
data) to analyze trends, (2) predictive analytics—the use of data to predict what will happen in
the future (perhaps by using the forecasting techniques described in Chapter 10), and (3) pre-
scriptive analytics—the use of data to prescribe the best course of action (frequently by using
the optimization techniques described throughout this book). Broadly speaking, the techniques
of the management science discipline provide the firepower for prescriptive analytics and, to
a lesser extent, for predictive analytics, but not so much for descriptive analytics. (Section 1.3
will further describe the relationship between analytics and management science.)
One major international professional society for the management science discipline (as
well as for business analytics) is the Institute for Operations Research and the Management
Sciences (INFORMS). Headquartered in the United States, with well over 12,000 members,
this society holds major conferences in the United States each year (including an annual
Conference for Business Analytics and Operations Research) plus occasional conferences
elsewhere. It also publishes several prominent journals, including Management Science,
Operations Research, Analytics, and Interfaces. (Articles describing actual applications of
management science are featured in
Interfaces, so you will see many references and links to
this journal throughout the book.) In addition, a few dozen countries around the world have
their own national operations research societies. (More about this in Section 1.4.)
Thus, operations research/management science (OR/MS) is a truly international discipline.
(We hereafter will normally just use the name management science or the abbreviation MS.)
Management Science Aids Managerial Decision Making
The key word here is that management science aids managerial decision making. Manage-
ment scientists don’t make managerial decisions. Managers do. A management science study
only provides an analysis and recommendations, based on the quantitative factors involved in
the problem, as input to the cognizant managers. Managers must also take into account vari-
ous intangible considerations that are outside the realm of management science and then use
their best judgment to make the decision. Sometimes managers find that qualitative factors
are as important as quantitative factors in making a decision. 4 Chapter One Introduction
A small informal management science study might be conducted by just a single individ-
ual, who may be the cognizant manager. However, management science teams normally are
used for larger studies. (We often will use the term team to cover both cases throughout the
book.) Such a team often includes some members who are not management scientists but who
provide other types of expertise needed for the study. Although a management science team
often is entirely in-house (employees of the company), part or all of the team may instead
be consultants who have been hired for just the one study. Consulting firms that partially or
entirely specialize in management science currently are a growing industry.
Management Science Uses a Scientific Approach
Management science is based strongly on some scientific fields, including mathematics, sta-
tistics, and computer science. It also draws on the social sciences, especially economics. Since
the field is concerned with the practical management of organizations, a management sci-
entist should have solid training in business administration, including its various functional areas, as well.
To a considerable extent, a management science team will attempt to use the scientific
method in conducting its study. This means that the team will emphasize conducting a sys-
tematic investigation that includes careful data gathering, developing and testing hypotheses
about the problem (typically in the form of a mathematical model), and then applying sound
logic in the subsequent analysis.
When conducting this systematic investigation, the management science team typically
will follow the (overlapping) steps outlined and described below.
Step 1: Define the problem and gather data. In this step, the team consults with manage-
ment to clearly identify the problem of concern and ascertain the appropriate objectives for
the study. The team then typically spends a surprisingly large amount of time gathering rel-
evant data about the problem with the assistance of other key individuals in the organization.
A common frustration is that some key data are either very rough or completely unavailable.
This may necessitate installing a new computer-based management information system.
Another increasingly common problem is that there may be too much data available to
be easily analyzed. Dramatic advances in computerized data capture, processing power,
data transmission, and storage capabilities are enabling organizations to integrate their
various databases into massive data warehouses. This has led to the development of data-
mining software for extracting hidden predictive information, correlations, and patterns from large databases.
Fortunately, the rapid development of the information technology (IT) field in recent
years is leading to a dramatic improvement in the quantity and quality of data that may be
available to the management science (MS) team. Corporate IT now is often able to provide
the computational resources and databases, as well as any helpful data mining, that are
needed by the MS team. Thus, the MS team often will collaborate closely with the IT group.
Step 2: Formulate a model (typically a mathematical model) to represent the
problem. Models, or approximate representations, are an integral part of everyday life.
Common examples include model airplanes, portraits, globes, and so on. Similarly, mod-
els play an important role in science and business, as illustrated by models of the atom,
models of genetic structure, mathematical equations describing physical laws of motion
or chemical reactions, graphs, organization charts, and industrial accounting systems.
Such models are invaluable for abstracting the essence of the subject of inquiry, showing
interrelationships, and facilitating analysis.
Mathematical models are also approximate representations, but they are expressed
in terms of mathematical symbols and expressions. Such laws of physics as F = m a and E = mc
2 are familiar examples. Similarly, the mathematical model of a business problem
is the system of equations and related mathematical expressions that describes the essence of the problem.
With the emergence of powerful spreadsheet technology, spreadsheet models now
are widely used to analyze managerial problems. A spreadsheet model lays out the rel-
evant data, measures of performance, interrelationships, and so forth, on a spreadsheet in
1.1 The Nature of Management Science 5
an organized way that facilitates fruitful analysis of the problem. It also frequently incor-
porates an underlying mathematical model to assist in the analysis, but the mathematics is
kept in the background so the user can concentrate on the analysis.
The modeling process is a creative one. When dealing with real managerial problems
(as opposed to some cut-and-dried textbook problems), there normally is no single “cor-
rect” model but rather a number of alternative ways to approach the problem. The model-
ing process also is typically an evolutionary process that begins with a simple “verbal
model” to define the essence of the problem and then gradually evolves into increasingly
more complete mathematical models (perhaps in a spreadsheet format).
We further describe and illustrate such mathematical models in the next section.
Step 3: Develop a computer-based procedure for deriving solutions to the problem
from the model. The beauty of a well-designed mathematical model is that it enables the
use of mathematical procedures to find good solutions to the problem. These procedures
usually are run on a computer because the calculations are too extensive to be done by
hand. In some cases, the management science team will need to develop the procedure. In
others, a standard software package already will be available for solving the model. When
the mathematical model is incorporated into a spreadsheet, the spreadsheet software nor-
mally includes a Solver that usually will solve the model.
Step 4: Test the model and refine it as needed. Now that the model can be solved, the
team needs to thoroughly check and test the model to make sure that it provides a sufficiently
accurate representation of the real problem. A number of questions should be addressed,
perhaps with the help of others who are particularly familiar with the problem. Have all the
relevant factors and interrelationships in the problem been accurately incorporated into the
model? Does the model seem to provide reasonable solutions? When it is applied to a past
situation, does the solution improve upon what was actually done? When assumptions about
costs and revenues are changed, do the solutions change in a plausible manner?
Step 5: Apply the model to analyze the problem and develop recommendations for
management. The management science team now is ready to solve the model, perhaps
under a variety of assumptions, in order to analyze the problem. The resulting recommen-
dations then are presented to the managers who must make the decisions about how to deal with the problem.
If the model is to be applied repeatedly to help guide decisions on an ongoing
basis, the team might also develop a decision support system. This is an interactive
computer-based system that aids managerial decision making. The system draws current
data from databases or management information systems and then solves the various
versions of the model specified by the manager.
Step 6: Help to implement the team’s recommendations that are adopted by
management. Once management makes its decisions, the management science team nor-
mally is asked to help oversee the implementation of the new procedures. This includes
providing some information to the operating management and personnel involved on the
rationale for the changes that are being made. The team also makes sure that the new
operating system is consistent with its recommendations as they have been modified and
approved by management. If successful, the new system may be used for years to come.
With this in mind, the team monitors the initial experience with the system and seeks to
identify any modifications that should be made in the future.
Management Science Considers Quantitative Factors
Many managerial problems revolve around such quantitative factors as production quantities,
revenues, costs, the amounts available of needed resources, and so on. By incorporating these
quantitative factors into a mathematical model and then applying mathematical procedures to
solve the model, management science provides a uniquely powerful way of analyzing such
managerial problems. Although management science is concerned with the practical manage-
ment of organizations, including taking into account relevant qualitative factors, its special
contribution lies in this unique ability to deal with the quantitative factors. 6 Chapter One Introduction
The Special Products Company example discussed next will illustrate how management
science considers quantitative factors.
1. When did the rapid development of the management science discipline begin? Review Questions
2. What is the traditional name given to this discipline that still is widely used outside of business schools?
3. What does a management science study provide to managers to aid their decision making?
4. Upon which scientific fields and social sciences is management science especially based?
5. What is a decision support system?
6. What are some common quantitative factors around which many managerial problems revolve?
1.2 AN ILLUSTRATION OF THE MANAGEMENT SCIENCE APPROACH: BREAK-EVEN ANALYSIS
The Special Products Company produces expensive and unusual gifts to be sold in stores
that cater to affluent customers who already have everything. The latest new-product pro-
posal to management from the company’s Research Department is a first-of-its-kind iWatch.
This iWatch would combine the features of a top-of-the-line atomic wristwatch and a next-
generation smartphone, including the ability to respond to voice commands or questions with
voice responses. It also would connect to the Internet wirelessly to provide weather, sports
scores, stock quotes, and more. An extensive research-and-development project would be
needed to develop the iWatch. The proposal is to provide a generous budget of $10 million
for this project in order to provide as many desirable features as possible within this budget.
It is clear that the production costs for the iWatch would be very large because of the extreme
miniaturization that would be required, so the selling price would need to be far beyond the
reach of middle-class customers. Therefore, the marketing of the iWatch would be aimed at
wealthy customers who want the most advanced products regardless of cost.
Management needs to decide whether to develop and market this new product and, if so,
how many of these watches to produce. Before making these decisions, a sales forecast will
be obtained to estimate how many watches can be sold. Since most of these sales would
occur quickly during the relatively brief time before the “next big thing” arrives to take over
the market, there would be only one production run for the iWatch and the number produced
would be set equal to the sales forecast. Following the production run, the iWatch would be
marketed as aggressively as needed to sell this entire inventory if possible. Management now
needs a management science study to be conducted to determine how large this sales potential
needs to be to make the iWatch profitable after considering all the prospective revenues and
costs, so let’s next look at the estimates of these financial figures. A cost that remains the
If the company goes ahead with this product, the research-and-development cost of same regardless of the pro-
$10 million is referred to as a fixed cost because it remains the same regardless of how many duction volume is referred
watches are produced and sold. (However, note that this cost would no tbe incurred if manage- to as a fixed cost, whereas
ment decides not to introduce the product since the research-and-development project then a cost that varies with the production volume is called would not be undertaken.) a variable cost.
In addition to this fixed cost, there is a production cost that varies with the number of watches
produced. This variable cos tis $1,000 per watch produced, which adds up to $1,000 time s the
number of watches produced. (The cost for each additional unit produced, $1,000, is referred to as the marginal cost )
. Each watch sold would generate a unit revenue of $2,000 for the company.
Spreadsheet Modeling of the Problem
You will see throughout this book that spreadsheets provide a very convenient way of using a man-
agement science approach for modeling and analyzing a wide variety of managerial problems. This
certainly is true for the Special Products Company problem as well, as we now will demonstrate.
Figure 1.1 shows a spreadsheet formulation of this problem after obtaining a preliminary
sales forecast that indicates 30,000 watches can be sold. The data have been entered into cells
C4 to C7. Cell C9 is used to record a trial value for the decision as to how many watches to
produce. As one of the many possibilities that eventually might be tried, Figure 1.1 shows the
specific trial value of 20,000.
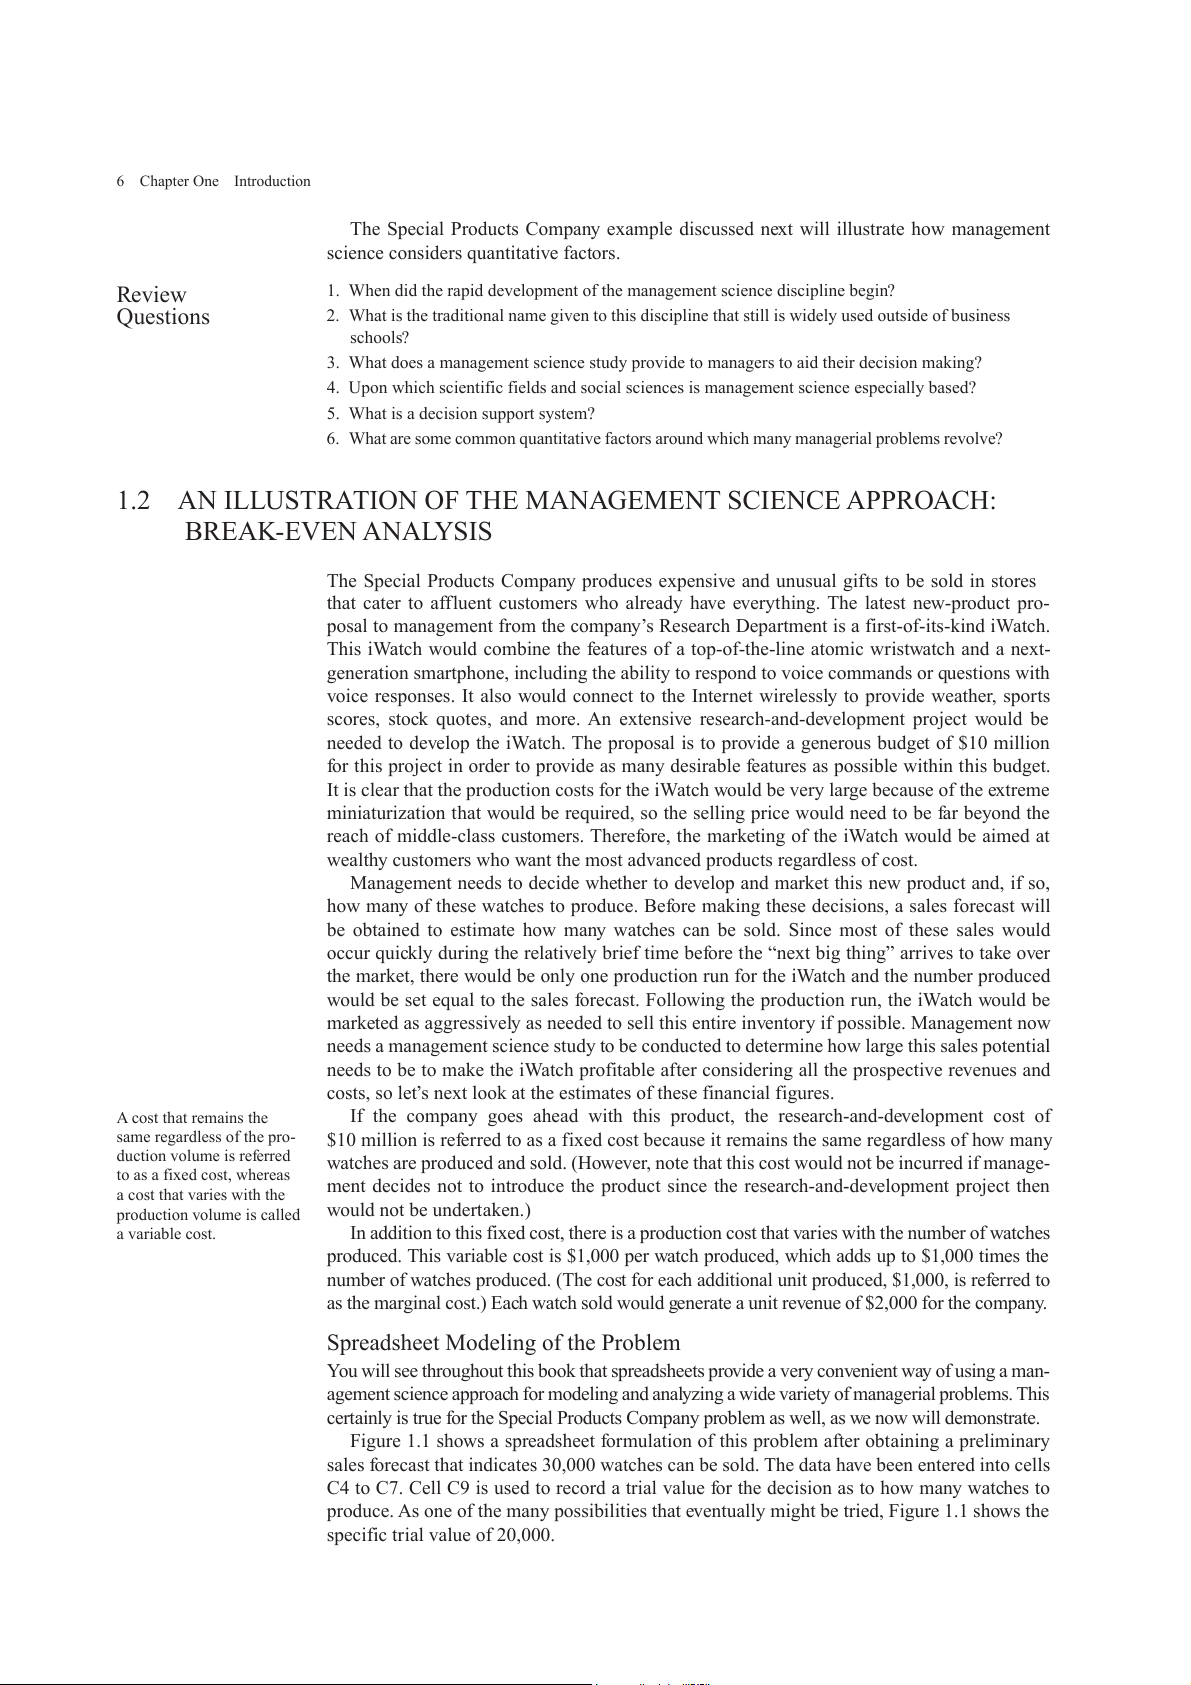
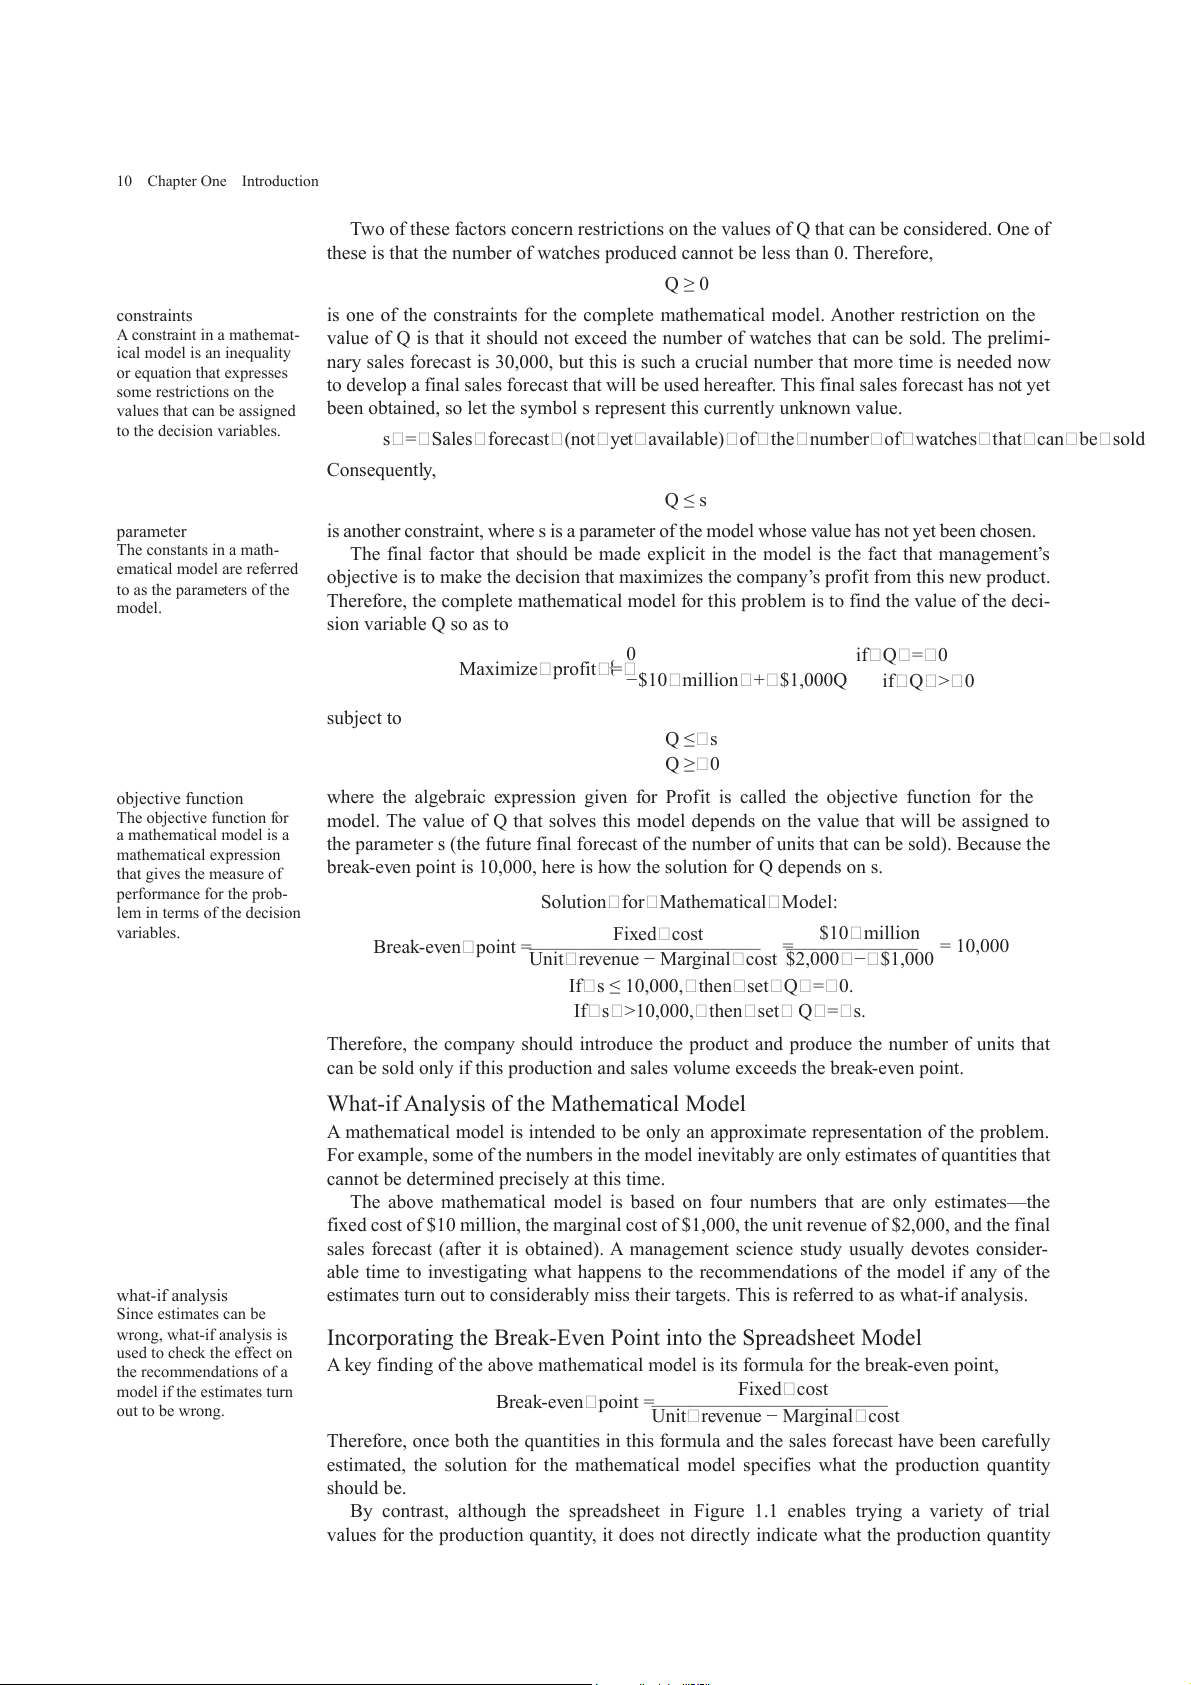
1.2 An Illustration of the Management Science Approach: Break-Even Analysis 7 FIGURE 1.1
A spreadsheet formulation of the Special Products Company problem. A B C D E F 1
Special Products Co. Break-Even Analysis 2 3 Data R esults 4 Unit Revenue $2,000 Total Re enue v $40,000,000 5 Fixed Cost $10,000,000 Total Fixed Cost $10,000,000 6 Marginal Cost $1,000 Total V riable Cost a $20,000,000 7 Sales Forecast 30,000 Profit (Loss) $10,000,000 8 9 Production Quantity 20,000 E F Range Name Cell 3 Results FixedCost C5 4 Total Re enue v
=UnitRevenue MIN(SalesForecast, ProductionQuantity) MarginalCost C6 * ProductionQuantity C9 5 Total Fixed Cost
=IF(ProductionQuantity > 0, FixedCost, 0) Profit F7 6 Total V riable Cost a
=MarginalCost ProductionQuantity * SalesForecast C7 7
Profit (Loss) =TotalRevenue – (TotalFixedCost + TotalVariableCost) TotalFixedCost F5 TotalRe enue v F4 TotalVariableCost F6 UnitRevenue C4 Excel Tip: To update
Cells F4 to F7 give the resulting total revenue, total costs, and profit (loss) by using the formulas throughout the
Excel equations shown under the spreadsheet in Figure 1.1. The Excel equations could have spreadsheet to incorporate a
been written using cell references (e.g., F6 = C6*C9). However, the spreadsheet model newly defined range name,
is made clearer by giving “range names” to key cells or blocks of cells. (A range name choose Apply Names from the Define Name menu on
is a descriptive name given to a cell or range of cells that immediately identifies what is the Formulas tab.
there. Appendix A provides details about how to incorporate range names into a spread-
sheet model.) To define a name for a selected cell (or range of cells), click on the name box
(on the left of the formula bar above the spreadsheet) and type a name. These cell names
then can be used in other formulas to create an equation that is easy to decipher (e.g.,
TotalVariableCost = MarginalCost*ProductionQuantity rather than the more cryptic F6 =
C6*C9). Note that spaces are not allowed in range names. When a range name has more Excel Tip: A list of all the
than one word, we have used capital letters to distinguish the start of each new word (e.g., defined names and their ProductionQuantity). corresponding cell refer-
The lower left-hand corner of Figure 1.1 lists the names of the quantities in the spreadsheet ences can be pasted into a
in alphabetical order and then gives cell references where the quantities are found. Although spreadsheet by choosing Paste Names from the Use
this isn’t particularly necessary for such a small spreadsheet, you should find it helpful for the in Formula menu on the
larger spreadsheets found later in the book. Formulas tab, and then
This same spreadsheet, along with all of the other spreadsheets in the book, are available clicking on Paste List.
to you at www.mhhe.com/Hillier6e. As you can see for yourself by bringing up and playing
with the spreadsheet, it provides a straightforward way of performing what-if analysis on the A spreadsheet is a conve- nient tool for performing
problem. What-if analysis involves addressing such questions as, What happens if the sales what-if analysis.
forecast should have been considerably lower? What happens if some of the cost and revenue
estimates are wrong? Simply enter a variety of new values for these quantities in the spread-
sheet and see what happens to the profit shown in cell F7.
The lower right-hand corner of Figure 1.1 introduces two useful Excel functions, the The Excel function MIN
MIN(a, b) function and the IF(a, b, c) function. The equation for cell F4 uses the MIN(a, b) (a, b) gives the minimum
function, which gives the minimum of a and
b. In this case, the estimated number of watches of the numbers in the cells
that will be sold is the minimum of the sales forecast and the production quantity, so whose addresses are a and b.
F4 = UnitRevenue*MIN(SalesForecast, ProductionQuantity) 8 Chapter One Introduction
enters the unit revenue (from cell C4) times the minimum of the sales forecast (from C7) and
the production quantity (from C9) into cell F4.
Also note that the equation for cell F5 uses the IF(a, b, c) function, which does the follow-
ing: If statement a is true, it uses b; otherwise, it uses c. Therefore, The Excel function IF (a, b,
F5 = IF(ProductionQuantity > 0, FixedCost, 0)
c) tests if a is true. If so, it uses b; otherwise it uses c.
says to enter the fixed cost (C5) into cell F5 if the production quantity (C9) is greater than
zero, but otherwise enter 0 (the fixed cost is avoided if production is not initiated).
The spreadsheet in Figure 1.1, along with its equations for the results in column F, con-
stitutes a spreadsheet model for the Special Products Company problem. You will see many
examples of such spreadsheet models throughout the book.
This particular spreadsheet model is based on an underlying mathematical model that uses
algebra to spell out the equations in cells F4:F7 and then to derive some additional useful
information. Let us take a look at this mathematical model next.
Expressing the Problem Mathematically
The issue facing management is to make the following decision.
Decision to be made: Number of watches to produce (if any).
Since this number is not yet known, we introduce an algebraic variable Q to represent this quantity. Thus,
Q = Number of watches to produce,
where Q is referred to as a decision variable. Naturally, the value chosen for Q should not
exceed the sales forecast for the number of watches that can be sold. Choosing a value of 0 for
Q would correspond to deciding not to introduce the product, in which case none of the costs
or revenues described in the preceding paragraph would be incurred.
The objective is to choose the value of Q that maximizes the company’s profit from this
new product. The management science approach is to formulate a mathematical model to
represent this problem by developing an equation that expresses the profit in terms of the
decision variable Q. To get there, it is necessary first to develop equations in terms of Q for
the total cost and revenue generated by the watches.
If Q = 0, no cost is incurred. However, if Q > 0, there is both a fixed cost and a variable cost.
Fixed cost = $10 million (if Q > 0) Variable cost = $1,000Q
Therefore, the total cost would be 0 if Q = 0 Total cost = { $10 million + $1,000Q if Q > 0
Since each watch sold would generate a revenue of $2,000 for the company, the total rev-
enue from selling Q watches would be Total revenue = $2,000Q
Consequently, the profit from producing and selling Q watches would be
Profit = Total revenue − Total cost 0 if Q = 0 = {
$2,000Q − ( $10 million + $1,000 ) Q if Q > 0
Thus, since $2,000Q − $1,000Q = $1,000Q
Profit = −$10 million + $1,000Q if Q > 0 Analysis of the Problem
This last equation shows that the attractiveness of the proposed new product depends greatly
on the value of Q, that is, on the number of watches that can be produced and sold. A small
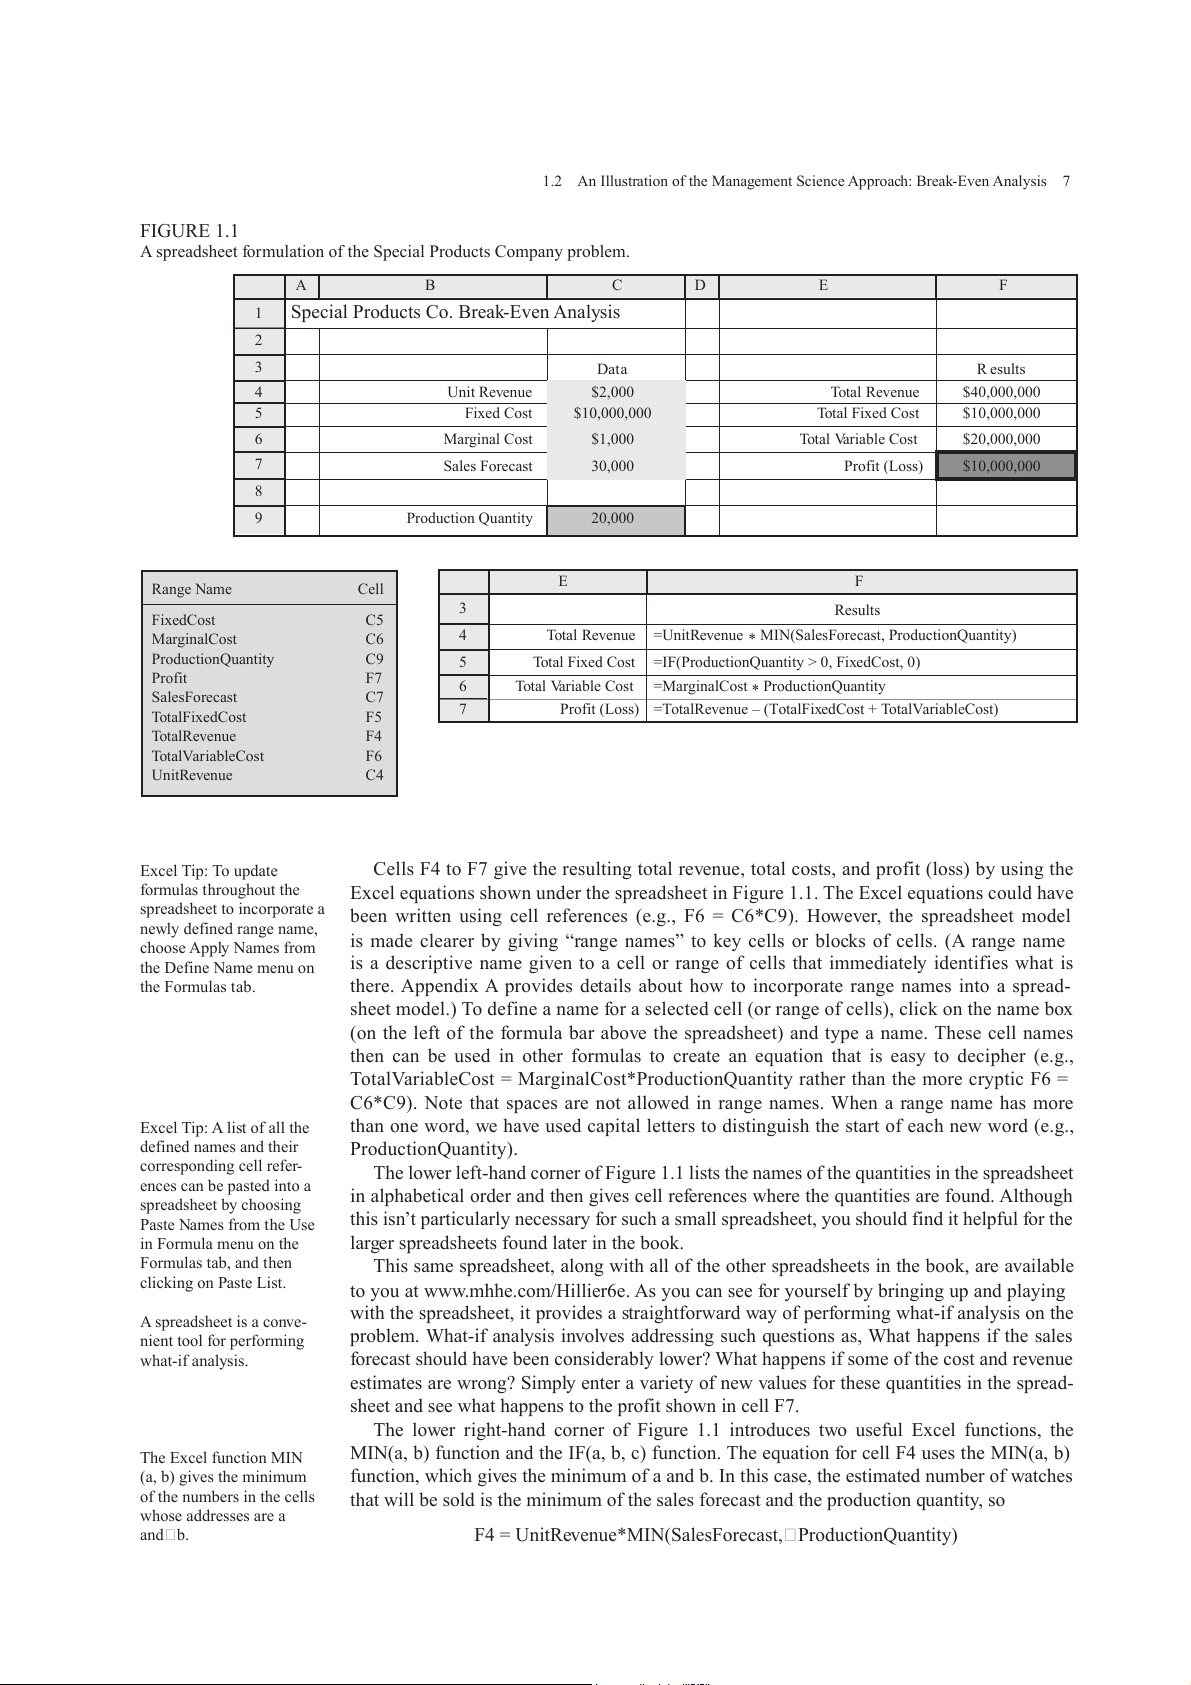
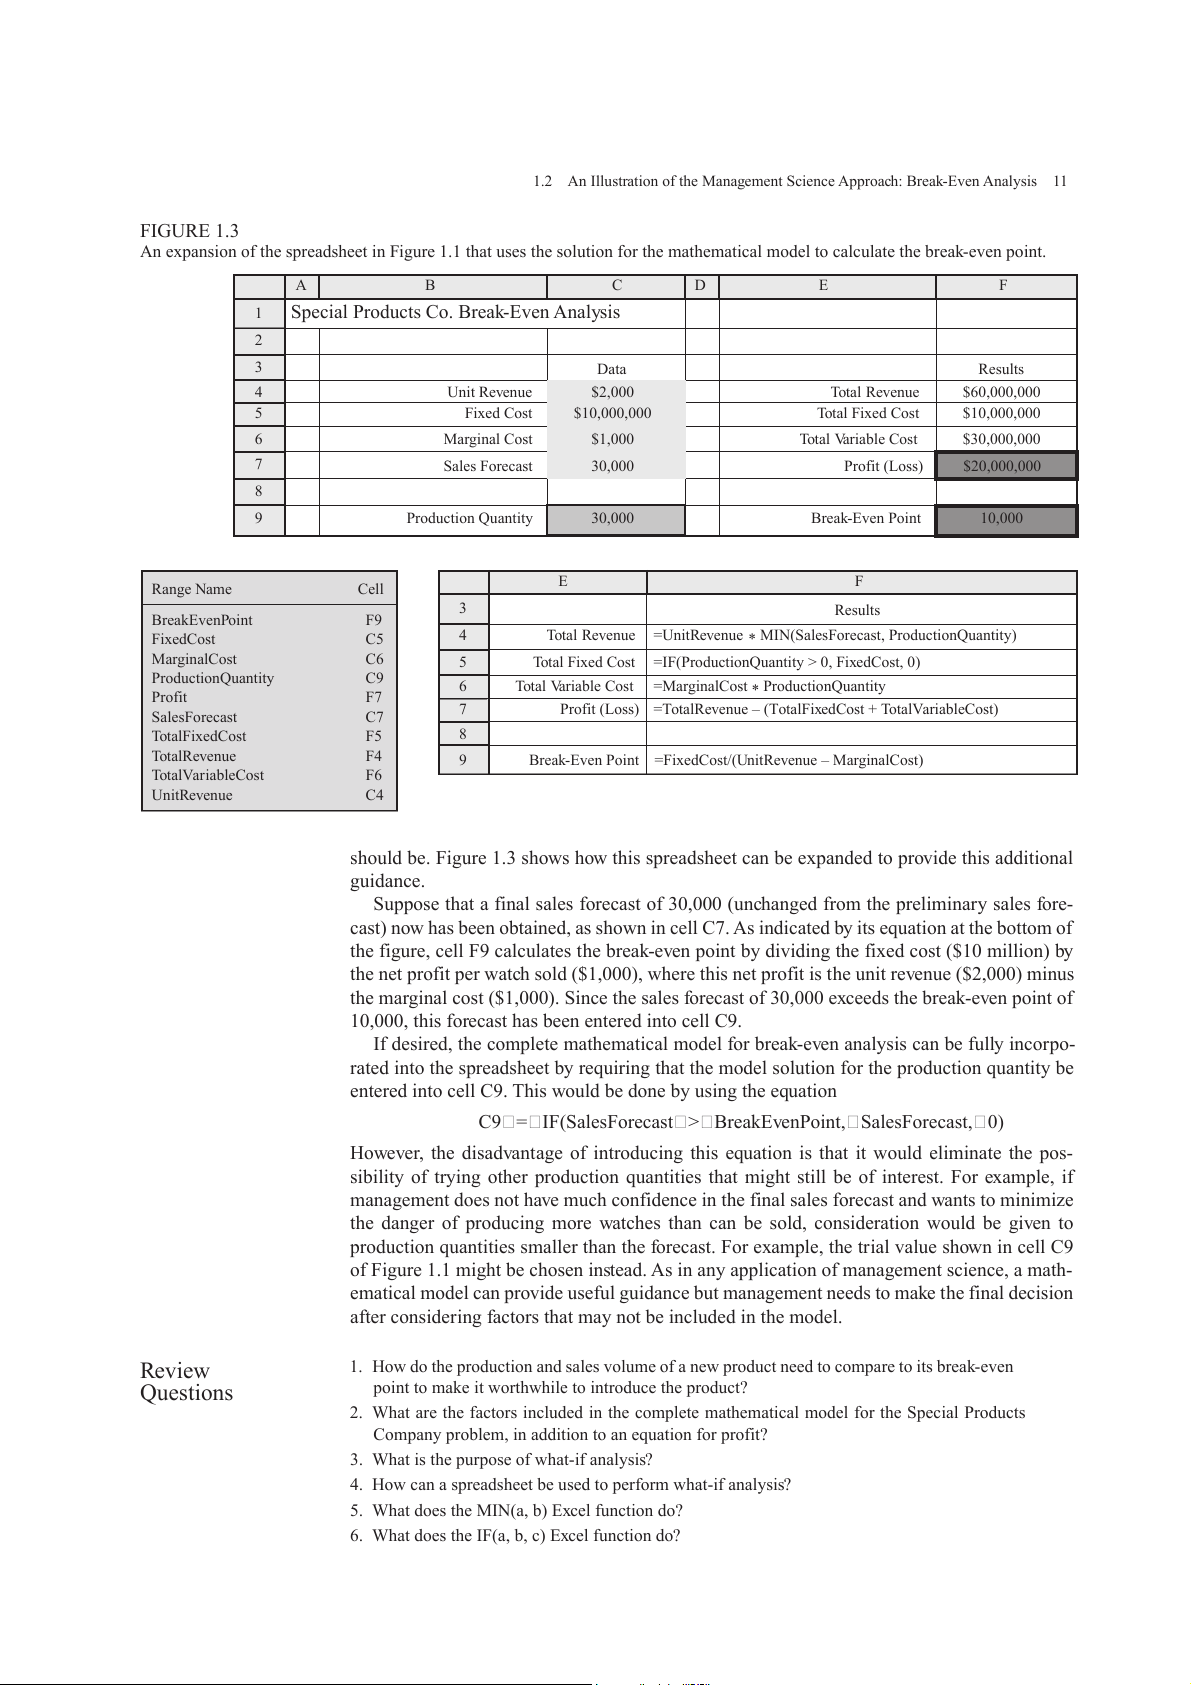
1.2 An Illustration of the Management Science Approach: Break-Even Analysis 9 FIGURE 1.2 Revenue/Cost Break-even analysis for in $millions the Special Products Company shows that the 50 cost line and revenue line intersect at Q = 10,000 watches, so this is the break-even point for the 40 Profit proposed new product. Total revenue = $2000Q 30 20
Total cost = $10 million + $1000 if Q > 0 Q 10
Fixed cost = $10 million if > 0 Q Loss 0 5 10 15 20 25 Q
Production Quantity (thousands)
Break-even point = 10,000 watches
value of Q means a loss (negative profit) for the company, whereas a sufficiently large value
would generate a positive profit for the company. For example, look at the difference between Q = 2,000 and Q = 20,000.
Profit = − $10 million + $1,000 (2,000) = −$8 million if Q = 2,000
Profit = − $10 million + $1,000 (20,000) = $10 million if Q = 20,000
Figure 1.2 plots both the company’s total cost and total revenue for the various values
of Q. Note that the cost line and the revenue line intersect at Q = 10,000. For any value of
Q < 10,000, cost exceeds revenue, so the gap between the two lines represents the loss to the
company. For any Q > 10,000, revenue exceeds cost, so the gap between the two lines now
shows positive profit. At Q = 10,000, the profit is 0. Since 10,000 units is the production and
sales volume at which the company would break even on the proposed new product, this vol-
ume is referred to as the break-even point. This is the point that must be exceeded to make
it worthwhile to introduce the product. Therefore, the crucial question is whether the sales
forecast for how many watches can be sold is above or below the break-even point.
Figure 1.2 illustrates the graphical procedure for finding the break-even point. Another
alternative is to use an algebraic procedure to solve for the point. Because the profit is 0 at
this point, the procedure consists of solving the following equation for the unknown Q.
Profit = −$10 million + $1,000Q = 0 Thus, $1,000Q = $10 million $10 million Q = __________ $1,000 Q = 10,000
A Complete Mathematical Model for the Problem
The preceding analysis of the problem made use of a basic mathematical model that consisted
of the equation for profit expressed in terms of Q .However, implicit in this analysis were some
additional factors that can be incorporated into a complete mathematical model for the problem. 10 Chapter One Introduction
Two of these factors concern restrictions on the values of Q that can be considered. One of
these is that the number of watches produced cannot be less than 0. Therefore, Q ≥ 0 constraints
is one of the constraints for the complete mathematical model. Another restriction on the A constraint in a mathemat-
value of Q is that it should not exceed the number of watches that can be sold. The prelimi- ical model is an inequality
nary sales forecast is 30,000, but this is such a crucial number that more time is needed now or equation that expresses
to develop a final sales forecast that will be used hereafter. This final sales forecast has not yet some restrictions on the values that can be assigned
been obtained, so let the symbol s represent this currently unknown value. to the decision variables.
s = Sales forecast (not yet available) of the number of watches that can be sold Consequently, Q s ≤ parameter
is another constraint, where s is a paramete
r of the model whose value has not yet been chosen. The constants in a math-
The final factor that should be made explicit in the model is the fact that management’s ematical model are referred
objective is to make the decision that maximizes the company’s profit from this new product. to as the parameters of the
Therefore, the complete mathematical model for this problem is to find the value of the deci- model. sion variable Q so as to 0 if Q = 0 Maximize profit = { − $10 million + $1,000Q if Q > 0 subject to Q ≤ s Q ≥ 0 objective function
where the algebraic expression given for Profit is called the objective function for the The objective function for
model. The value of Q that solves this model depends on the value that will be assigned to a mathematical model is a
the parameter s (the future final forecast of the number of units that can be sold). Because the mathematical expression
break-even point is 10,000, here is how the solution for Q depends on s. that gives the measure of performance for the prob-
Solution for Mathematical Model: lem in terms of the decision variables. Fixed cost $10 million = = 10,000 Break-even point = _________________________ ______________ Unit revenue − Marginal cost $2,000 − $1,000
If s ≤ 10,000, then set Q = 0.
If s >10,000, then set Q = s.
Therefore, the company should introduce the product and produce the number of units that
can be sold only if this production and sales volume exceeds the break-even point.
What-if Analysis of the Mathematical Model
A mathematical model is intended to be only an approximate representation of the problem.
For example, some of the numbers in the model inevitably are only estimates of quantities that
cannot be determined precisely at this time.
The above mathematical model is based on four numbers that are only estimates—the
fixed cost of $10 million, the marginal cost of $1,000, the unit revenue of $2,000, and the final
sales forecast (after it is obtained). A management science study usually devotes consider-
able time to investigating what happens to the recommendations of the model if any of the what-if analysis
estimates turn out to considerably miss their targets. This is referred to as . what-if analysis Since estimates can be wrong, what-if analysis is
Incorporating the Break-Even Point into the Spreadsheet Model used to check the effect on
A key finding of the above mathematical model is its formula for the break-even point, the recommendations of a model if the estimates turn Fixed cost Break-even point = _________________________ out to be wrong. Unit revenue − Marginal cost
Therefore, once both the quantities in this formula and the sales forecast have been carefully
estimated, the solution for the mathematical model specifies what the production quantity should be.
By contrast, although the spreadsheet in Figure 1.1 enables trying a variety of trial
values for the production quantity, it does not directly indicate what the production quantity
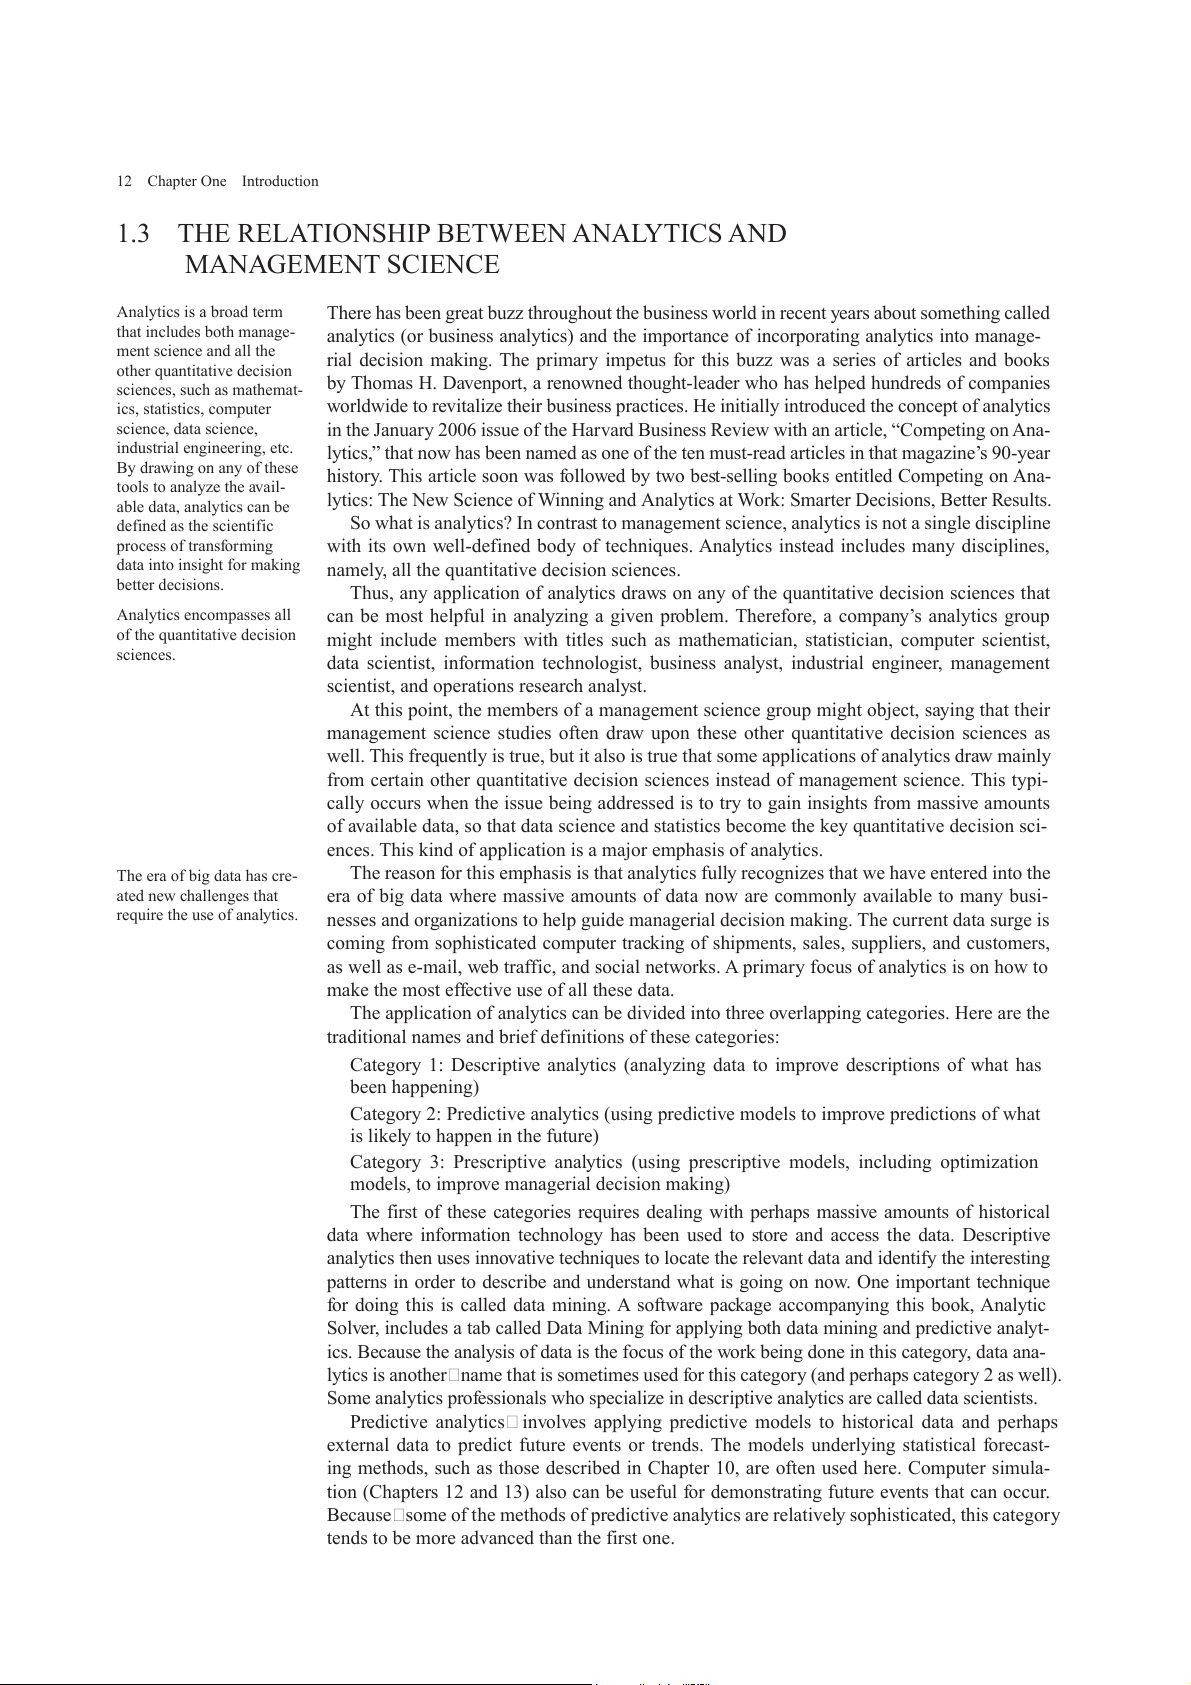
1.2 An Illustration of the Management Science Approach: Break-Even Analysis 11 FIGURE 1.3
An expansion of the spreadsheet in Figure 1.1 that uses the solution for the mathematical model to calculate the break-even point. A B C D E F 1
Special Products Co. Break-Even Analysis 2 3 Data Results 4 Unit Revenue $2,000 Total Re enue v $60,000,000 5 Fixed Cost $10,000,000 Total Fixed Cost $10,000,000 6 Marginal Cost $1,000 Total V riable Cost a $30,000,000 7 Sales Forecast 30,000 Profit (Loss) $20,000,000 8 9 Production Quantity 30,000 Break-Even Point 10,000 E F Range Name Cell 3 Results BreakEvenPoint F9 4 Total Re enue v
=UnitRevenue MIN(SalesForecast, ProductionQuantity) FixedCost C5 * MarginalCost C6 5 Total Fixed Cost
=IF(ProductionQuantity > 0, FixedCost, 0) ProductionQuantity C9 6 Total V riable Cost a
=MarginalCost ProductionQuantity * Profit F7 7
Profit (Loss) =TotalRevenue – (TotalFixedCost + TotalVariableCost) SalesForecast C7 TotalFixedCost F5 8 TotalRe enue v F4 9
Break-Even Point =FixedCost/(UnitRe enue – Mar v ginalCost) TotalVariableCost F6 UnitRevenue C4
should be. Figure 1.3 shows how this spreadsheet can be expanded to provide this additional guidance.
Suppose that a final sales forecast of 30,000 (unchanged from the preliminary sales fore-
cast) now has been obtained, as shown in cell C7. As indicated by its equation at the bottom of
the figure, cell F9 calculates the break-even point by dividing the fixed cost ($10 million) by
the net profit per watch sold ($1,000), where this net profit is the unit revenue ($2,000) minus
the marginal cost ($1,000). Since the sales forecast of 30,000 exceeds the break-even point of
10,000, this forecast has been entered into cell C9.
If desired, the complete mathematical model for break-even analysis can be fully incorpo-
rated into the spreadsheet by requiring that the model solution for the production quantity be
entered into cell C9. This would be done by using the equation
C9 = IF(SalesForecast > BreakEvenPoint, SalesForecast, 0)
However, the disadvantage of introducing this equation is that it would eliminate the pos-
sibility of trying other production quantities that might still be of interest. For example, if
management does not have much confidence in the final sales forecast and wants to minimize
the danger of producing more watches than can be sold, consideration would be given to
production quantities smaller than the forecast. For example, the trial value shown in cell C9
of Figure 1.1 might be chosen instead. As in any application of management science, a math-
ematical model can provide useful guidance but management needs to make the final decision
after considering factors that may not be included in the model.
1. How do the production and sales volume of a new product need to compare to its break-even Review
point to make it worthwhile to introduce the product? Questions
2. What are the factors included in the complete mathematical model for the Special Products
Company problem, in addition to an equation for profit?
3. What is the purpose of what-if analysis?
4. How can a spreadsheet be used to perform what-if analysis?
5. What does the MIN(a, b) Excel function do?
6. What does the IF(a, b, c) Excel function do? 12 Chapter One Introduction
1.3 THE RELATIONSHIP BETWEEN ANALYTICS AND MANAGEMENT SCIENCE Analytics is a broad term
There has been great buzz throughout the business world in recent years about something called that includes both manage-
analytics (or business analytics
) and the importance of incorporating analytics into manage- ment science and all the
rial decision making. The primary impetus for this buzz was a series of articles and books other quantitative decision
by Thomas H. Davenport, a renowned thought-leader who has helped hundreds of companies sciences, such as mathemat- ics, statistics, computer
worldwide to revitalize their business practices. He initially introduced the concept of analytics science, data science,
in the January 2006 issue of the Harvard Business Review with an article, “Competing on Ana- industrial engineering, etc.
lytics,” that now has been named as one of the ten must-read articles in that magazine’s 90-year By drawing on any of these
history. This article soon was followed by two best-selling books entitled Competing on Ana- tools to analyze the avail-
lytics: The New Science of Winning and A
nalytics at Work: Smarter Decisions, Better Results. able data, analytics can be defined as the scientific
So what is analytics? In contrast to management science, analytics is not a single discipline process of transforming
with its own well-defined body of techniques. Analytics instead includes many disciplines, data into insight for making
namely, all the quantitative decision sciences. better decisions.
Thus, any application of analytics draws on any of the quantitative decision sciences that Analytics encompasses all
can be most helpful in analyzing a given problem. Therefore, a company’s analytics group of the quantitative decision
might include members with titles such as mathematician, statistician, computer scientist, sciences.
data scientist, information technologist, business analyst, industrial engineer, management
scientist, and operations research analyst.
At this point, the members of a management science group might object, saying that their
management science studies often draw upon these other quantitative decision sciences as
well. This frequently is true, but it also is true that some applications of analytics draw mainly
from certain other quantitative decision sciences instead of management science. This typi-
cally occurs when the issue being addressed is to try to gain insights from massive amounts
of available data, so that data science and statistics become the key quantitative decision sci-
ences. This kind of application is a major emphasis of analytics. The era of big data has cre-
The reason for this emphasis is that analytics fully recognizes that we have entered into the ated new challenges that
era of big data where massive amounts of data now are commonly available to many busi- require the use of analytics.
nesses and organizations to help guide managerial decision making. The current data surge is
coming from sophisticated computer tracking of shipments, sales, suppliers, and customers,
as well as e-mail, web traffic, and social networks. A primary focus of analytics is on how to
make the most effective use of all these data.
The application of analytics can be divided into three overlapping categories. Here are the
traditional names and brief definitions of these categories:
Category 1: Descriptive analytics (analyzing data to improve descriptions of what has been happening)
Category 2: Predictive analytics (using predictive models to improve predictions of what
is likely to happen in the future)
Category 3: Prescriptive analytics (using prescriptive models, including optimization
models, to improve managerial decision making)
The first of these categories requires dealing with perhaps massive amounts of historical
data where information technology has been used to store and access the data. Descriptive
analytics then uses innovative techniques to locate the relevant data and identify the interesting
patterns in order to describe and understand what is going on now. One important technique
for doing this is called data mining .A software package accompanying this book, Analytic
Solver, includes a tab called Data Mining for applying both data mining and predictive analyt-
ics. Because the analysis of data is the focus of the work being done in this category, data ana-
lytics is another name that is sometimes used for this category (and perhaps category 2 as well).
Some analytics professionals who specialize in descriptive analytics are called data scientists.
Predictive analytics involves applying predictive models to historical data and perhaps
external data to predict future events or trends. The models underlying statistical forecast-
ing methods, such as those described in Chapter 10, are often used here. Computer simula-
tion (Chapters 12 and 13) also can be useful for demonstrating future events that can occur.
Because some of the methods of predictive analytics are relatively sophisticated, this category
tends to be more advanced than the first one.
1.3 The Relationship Between Analytics and Management Science 13 Prescriptive analytics uses
Prescriptive analytics is the final (and most advanced) category. It involves applying powerful techniques drawn
sophisticated models to the data to prescribe what should be done in the future. The power- mainly from management
ful optimization models and techniques of management science described in many of the science to prescribe what should be done in the
chapters of this book commonly are what are used here. The purpose is to guide managerial future. decision making, so the name
also could be used to describe this categor decision analytics y.
Management scientists often deal with all three of these categories, but not very much
with the first one, somewhat more with the second one, and then heavily with the third one.
Thus, management science can be thought of as focusing mainly on advanced analytics (pre-
dictive and prescriptive activities) whereas analytics professionals might get more involved
than management scientists with the entire business process, including what precedes the first
category (identifying a need) and what follows the last category (implementation). Looking to
the future, the two approaches should tend to merge somewhat over time.
Although analytics was initially introduced as a key tool for mainly business organizations,
it also can be a powerful tool in other contexts. As one example, analytics (together with man-
agement science) played a key role in the 2012 presidential campaign in the United States.
The Obama campaign management hired a multi-disciplinary team of statisticians, predictive
modelers, data-mining experts, mathematicians, software programmers, and management sci-
entists. It eventually built an entire analytics department five times as large as that of its 2008
campaign. With all this analytics input, the Obama team launched a full-scale and all-front
campaign, leveraging massive amounts of data from various sources to directly micro-target
potential voters and donors with tailored messages. The election had been expected to be a
very close one, but the Obama “ground game” that had been propelled by descriptive and
predictive analytics was given much of the credit for the clear-cut Obama win. Sports analytics is another
Another famous application of analytics is described in the book Moneybal land a subsequent example of various areas
2011 movie with the same name that is based on this book. They tell the true story of how the where analytics now is
Oakland Athletics baseball team achieved great success, despite having one of the smallest budgets applied.
in the major leagues, by using various kinds of nontraditional data (referred to as saber metrics)
to better evaluate the potential of players available through a trade or the draft. Although these
evaluations often flew in the face of conventional baseball wisdom, both descriptive analytics and
predictive analytics were being used to identify overlooked players who could greatly help the
team. After witnessing the impact of analytics, many major league baseball teams now have hired
analytics professionals. Some other kinds of sports teams, including professional basketball teams
in the NBA (National Basketball Association) also have begun to use analytics. For example, some
months after they won the 2015 NBA championship, the Golden State Warriors won the “Best
Analytics Organization” award at the MIT Sloan Sports Analytics Conference in March 2016. Business schools now are
The top management of numerous business organizations now understand the impact that this responding to the great
approach can have on the bottom line and they are interested in increasing the role of their analyt- need to thoroughly train
ics group in their organization. This will require many more people trained in analytics and man- much larger numbers
agement science. A recent study by the McKinsey Global Institute estimated that the United States of people in business analytics.
could face a shortage by 2018 of 140,000 to 180,000 people with deep analytical skills. The study
also estimated that employers will need an additional 1.5 million managers and analysts with the
experience and expertise to use the analysis of big data to make effective and efficient decisions.
Universities now are responding to this great need. There now are hundreds of business
schools in the United States or abroad that have, or have committed to launch, curriculum
at the undergraduate and graduate levels with degrees or certificates in business analytics.
Courses that cover the material in this book would be a key component of these programs,
along with courses that emphasize other areas of analytics (e.g., statistics and data mining).
This creates an outstanding opportunity for students with a STEM focus. In the words of the
thought leader Thomas H. Davenport (who was introduced in the first paragraph of this sec-
tion), the job of an analytics professional promises to be the “sexiest job in the 21st century.”
In 2016, the job site Glassdoor also named data scientist as the best job in America. Along
these same lines, U.S. News annually publishes a list of the best jobs in the United States,
based on a variety of factors such as salary, job satisfaction, etc. In their issue of January
27, 2016, U.S. News published that year’s list that placed the operations research profession
(i.e., the management science profession) as number 2 on the list of the best business jobs in
the country. Furthermore, this profession ranks very high in terms of having a high percentage
of women working in the profession, with slightly more women than men in the field. 14 Chapter One Introduction
The momentum of the analytics movement is indeed continuing to grow rapidly. Because Management science is
management science is at the core of advanced analytics, the usage of the powerful techniques at the core of advanced analytics.
of management science introduced in this book also should continue to grow rapidly. How-
ever, without even looking to the future, the impact of management science over past years
also has been impressive, as described in the next section.
1. What are some quantitative decision sciences that are included within analytics? Review Questions
2. What does descriptive analytics involve doing?
3. What does predictive analytics involve doing?
4. What does prescriptive analytics involve doing?
5. In which categories of analytics does management science mainly focus?
6. What is a major emphasis of analytics that draws mainly from certain other quantitative deci-
sion sciences instead of management science?
1.4 THE IMPACT OF MANAGEMENT SCIENCE
Management science (or operations research as it is commonly called by practitioners) has
had an impressive impact on improving the efficiency of numerous organizations around the
world. In the process, management science has made a significant contribution to increasing
the productivity of the economies of various countries. There now are a few dozen mem-
ber countries in the International Federation of Operational Research Societies (IFORS),
with each country having a national operations research society. Both Europe and Asia have
federations of such societies to coordinate holding international conferences and publishing
international journals in those continents. In addition, we described in Section 1.1 how the
Institute for Operations Research and the Management Sciences (INFORMS) is a particu-
larly prominent international society in this area. Among its various journals is one called
Interfaces that regularly publishes articles describing major management science studies and
the impact they had on their organizations. The most important appli-
Management science (MS) has had numerous applications of various types in business and cations of management
industry, sometimes resulting in annual savings of millions, or even hundreds of millions, of science in business and
dollars. As an example, many hundreds of management scientists work on such airline prob- industry have resulted in
lems as how to most effectively assign airplanes and crews to flights and how to develop fare annual savings in the hun- dreds of millions of dollars.
structures that maximize revenue. For decades, financial services firms have used portfolio
selection techniques that were developed by management scientists who won the Nobel Prize
in Economics for their work. Management science models have become a core component of
the marketing discipline. Multinational corporations rely on MS for guiding the management
of their supply chains. There are numerous other examples of MS applications that are having
a dramatic impact on the companies involved.
Management science also is widely used outside business and industry. For example, it
is having an increasing impact in the health care area, with applications involving improved Management science also
management of health care delivery and operations, disease modeling, clinical diagnosis and has had a major impact
decision making, radiation therapy, and so on. Applications of MS also abound at various in the health care area, in
levels of government, ranging from dealing with national security issues at the federal level to guiding key governmental
managing the delivery of emergency services at the municipal level. Other key governmental policies, and in military applications.
applications involve the use of MS modeling to help guide energy, environmental, and global
warming policies. Some of the earliest MS applications were military applications, including
logistical planning and war gaming, and these continue today.
These are just a sampling of the numerous applications of management science that are
having a major impact on the organizations involved. The list goes on and on.
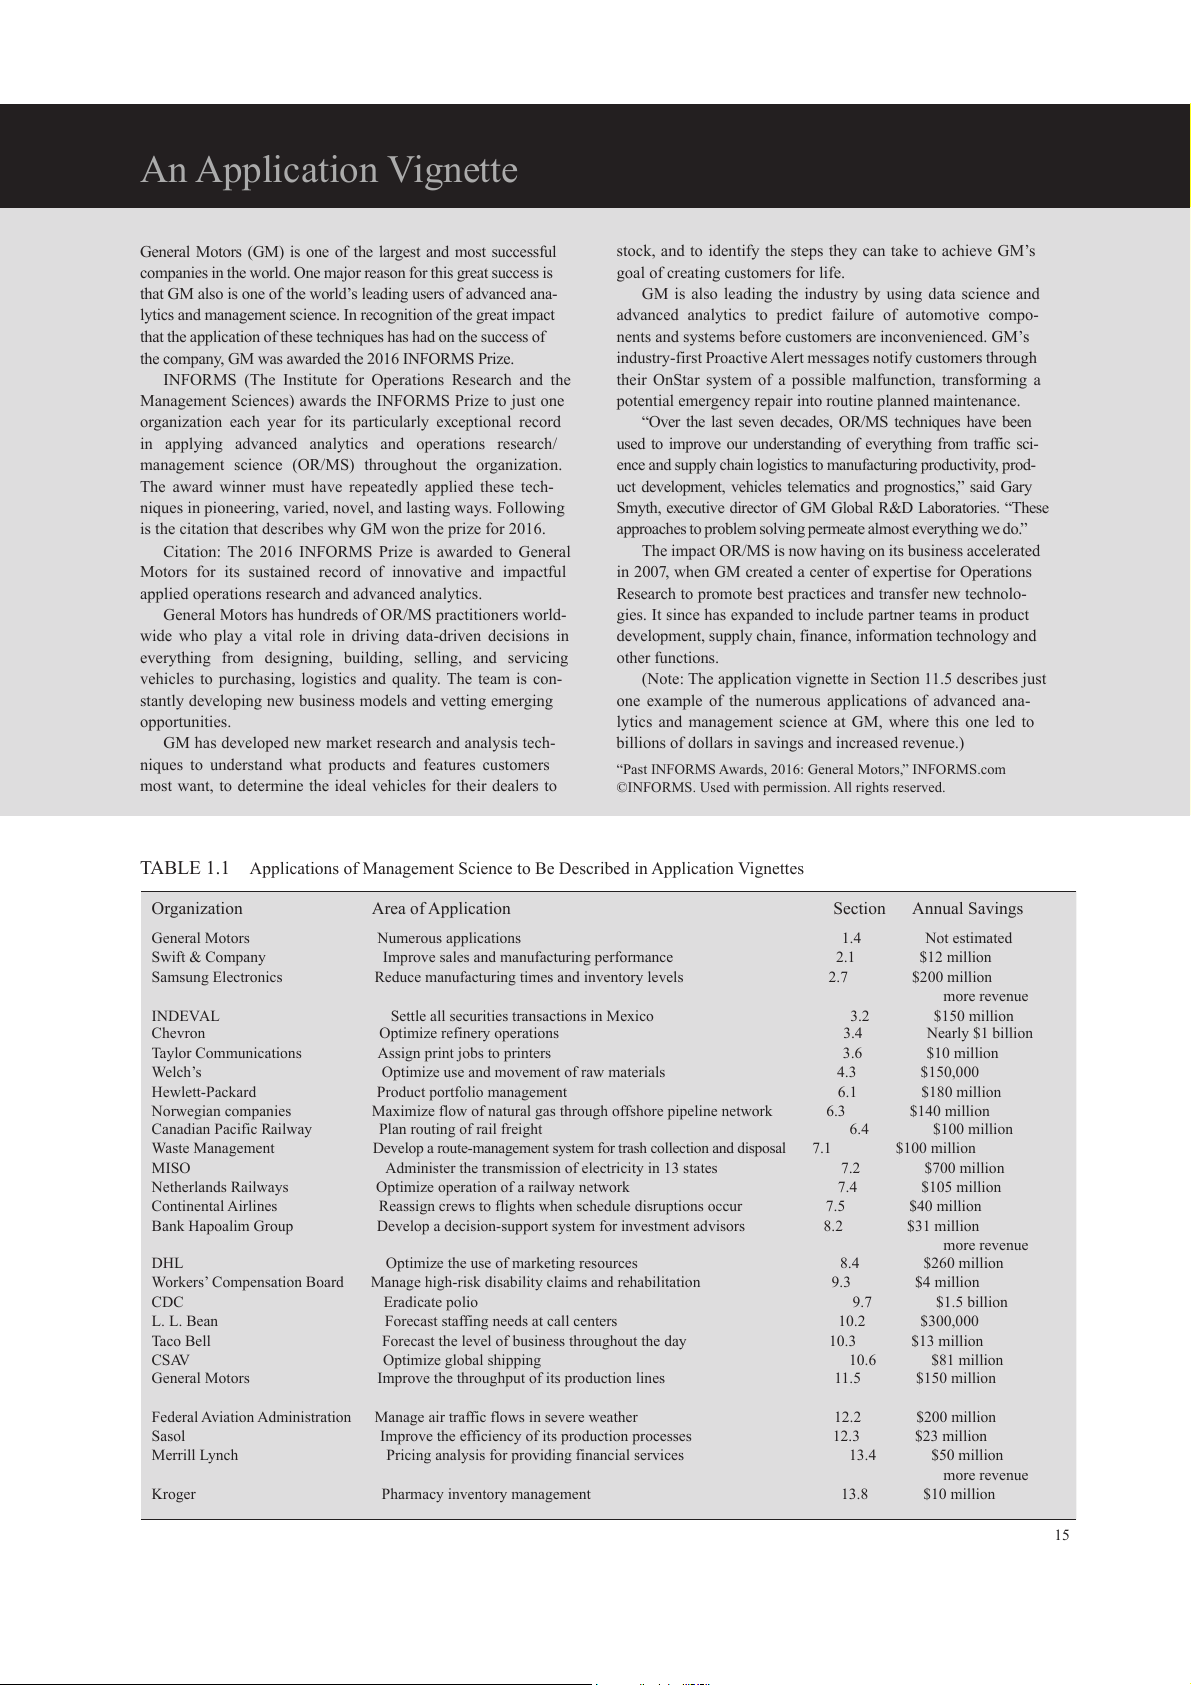
To give you a better notion of the wide applicability of management science, we list some
actual applications in Table 1.1. Note the diversity of organizations and applications in the first An Application Vignette
General Motors (GM) is one of the largest and most successful
stock, and to identify the steps they can take to achieve GM’s
companies in the world. One major reason for this great success is
goal of creating customers for life.
that GM also is one of the world’s leading users of advanced ana-
GM is also leading the industry by using data science and
lytics and management science. In recognition of the great impact
advanced analytics to predict failure of automotive compo-
that the application of these techniques has had on the success of
nents and systems before customers are inconvenienced. GM’s
the company, GM was awarded the 2016 INFORMS Prize.
industry-first Proactive Alert messages notify customers through
INFORMS (The Institute for Operations Research and the
their OnStar system of a possible malfunction, transforming a
Management Sciences) awards the INFORMS Prize to just one
potential emergency repair into routine planned maintenance.
organization each year for its particularly exceptional record
“Over the last seven decades, OR/MS techniques have been
in applying advanced analytics and operations research/
used to improve our understanding of everything from traffic sci-
management science (OR/MS) throughout the organization.
ence and supply chain logistics to manufacturing productivity, prod-
The award winner must have repeatedly applied these tech-
uct development, vehicles telematics and prognostics,” said Gary
niques in pioneering, varied, novel, and lasting ways. Following
Smyth, executive director of GM Global R&D Laboratories. “These
is the citation that describes why GM won the prize for 2016.
approaches to problem solving permeate almost everything we do.”
Citation: The 2016 INFORMS Prize is awarded to General
The impact OR/MS is now having on its business accelerated
Motors for its sustained record of innovative and impactful
in 2007, when GM created a center of expertise for Operations
applied operations research and advanced analytics.
Research to promote best practices and transfer new technolo-
General Motors has hundreds of OR/MS practitioners world-
gies. It since has expanded to include partner teams in product
wide who play a vital role in driving data-driven decisions in
development, supply chain, finance, information technology and
everything from designing, building, selling, and servicing other functions.
vehicles to purchasing, logistics and quality. The team is con-
(Note: The application vignette in Section 11.5 describes just
stantly developing new business models and vetting emerging
one example of the numerous applications of advanced ana- opportunities.
lytics and management science at GM, where this one led to
GM has developed new market research and analysis tech-
billions of dollars in savings and increased revenue.)
niques to understand what products and features customers
“Past INFORMS Awards, 2016: General Motors,” INFORMS.com
most want, to determine the ideal vehicles for their dealers to
©INFORMS. Used with permission. All rights reserved.
TABLE 1.1 Applications of Management Science to Be Described in Application Vignettes Organization Area of Application Section Annual Savings General Motors Numerous applications 1.4 Not estimated Swift & Company
Improve sales and manufacturing performance 2.1 $12 million Samsung Electronics
Reduce manufacturing times and inventory levels 2.7 $200 million more revenue INDEVAL
Settle all securities transactions in Mexico 3.2 $150 million Chevron Optimize refinery operations 3.4 Nearly $1 billion Taylor Communications Assign print jobs to printers 3.6 $10 million Welch’s
Optimize use and movement of raw materials 4.3 $150,000 Hewlett-Packard Product portfolio management 6.1 $180 million Norwegian companies
Maximize flow of natural gas through offshore pipeline network 6.3 $140 million Canadian Pacific Railway Plan routing of rail freight 6.4 $100 million Waste Management
Develop a route-management system for trash collection and disposal 7.1 $100 million MISO
Administer the transmission of electricity in 13 states 7.2 $700 million Netherlands Railways
Optimize operation of a railway network 7.4 $105 million Continental Airlines
Reassign crews to flights when schedule disruptions occur 7.5 $40 million Bank Hapoalim Group
Develop a decision-support system for investment advisors 8.2 $31 million more revenue DHL
Optimize the use of marketing resources 8.4 $260 million Workers’ Compensation Board
Manage high-risk disability claims and rehabilitation 9.3 $4 million CDC Eradicate polio 9.7 $1.5 billion L. L. Bean
Forecast staffing needs at call centers 10.2 $300,000 Taco Bell
Forecast the level of business throughout the day 10.3 $13 million CSAV Optimize global shipping 10.6 $81 million General Motors
Improve the throughput of its production lines 11.5 $150 million
Federal Aviation Administration
Manage air traffic flows in severe weather 12.2 $200 million Sasol
Improve the efficiency of its production processes 12.3 $23 million Merrill Lynch
Pricing analysis for providing financial services 13.4 $50 million more revenue Kroger Pharmacy inventory management 13.8 $10 million 15 16 Chapter One Introduction
two columns. The third column identifies the section where an “application vignette” devotes
several paragraphs to describing the application and also references an article that provides full
details. (This section includes the first of these application vignettes, where this one mentions a
wide variety of important applications.) The last column indicates that these applications typi-
cally resulted in annual savings in the many millions of dollars. Furthermore, additional bene-
fits not recorded in the table (e.g., improved service to customers and better managerial control)
sometimes were considered to be even more important than these financial benefits. (You will
have an opportunity to investigate these less tangible benefits further in Problems 1.9 and 1.10.) A link to the articles in
Interfaces that describe these applications in detail is provided at
www.mhhe.com/Hillier6e. We are grateful to INFORMS for our special partnership to make
these articles available to you through this link. We think you will find these articles interest-
ing and enlightening in illustrating the dramatic impact that management science sometimes
can have on the success of a variety of organizations.
You also will see a great variety of applications of management science throughout the
book in the form of case studies, examples, and end-of-chapter cases. Some of the applica-
tions are similar to ones described in application vignettes, but many others are quite differ-
ent. However, they all generally fall into one of three broad categories, namely, applications
in the areas of operations management, finance, and marketing. Tables 1.2, 1.3, and 1.4 list TABLE 1.2 Location Type of Application Case Studies and Sec. 2.1 onward
A case study: What is the most profitable mix of products? Examples in the Area of Case 2-1
Which mix of car models should be produced? Operations Management Case 2-2
Which mix of ingredients should go into the casserole in a university cafeteria? Case 2-3
Which mix of customer–service agents should be hired to staff a call center? Sec. 3.3
Personnel scheduling of customer–service agents Sec. 3.5
Minimize the cost of shipping a product from factories to customers Sec. 3.6
Optimize the assignment of personnel to tasks Case 3-1
How should a product be shipped to market? Case 3-3
Which mix of women’s clothing should be produced for next season? Cases 3-5, 5-4, 7-3
Develop a plan for assigning students to schools so as to minimize busing costs Case 3-6
Which mixes of solid waste materials should be amalgamated into different grades of a salable product? Case 3-7
How should qualified managers be assigned to new R&D projects? Case 5-2
Develop and analyze a steel company’s plan for pollution abatement Case 5-3
Plan the mix of livestock and crops on a farm with unpredictable weather Sec. 6.1
Minimize the cost of operating a distribution network Secs. 6.2, 6.3
A case study: Maximize the flow of goods through a distribution network Sec. 6.4
Find the shortest path from an origin to a destination Case 6-1
Logistical planning for a military campaign Case 6-3
Develop the most profitable flight schedules for an airline Cases 6-4 , 7-4
Operate and expand a private computer network Sec. 7.2
Choose the best combination of R&D projects to pursue Sec. 7.3
Select the best sites for emergency services facilities Sec. 7.4 Airline crew scheduling Sec. 7.5
Production planning when setup costs are involved Case 7-2
Make inventory decisions for a retailer’s warehouse Sec. 8.3
Production planning when overtime is needed Sec. 8.5
Find the shortest route to visit all the American League ballparks Sec. 11.2
Many examples of commercial service systems, internal service systems, and
transportation service systems that can be analyzed with queueing models Sec. 11.4 onward
A case study: An analysis of competing proposals for more quickly providing
maintenance services to customers Cases 11-2, 12-2
Analysis of proposals for reducing in-process inventory Sec. 12.1
Comparison of whether corrective maintenance or preventive maintenance is better Secs. 12.2, 12.3
A case study: Would it be profitable for the owner of a small business to add an associate? Case 12-1
Analysis of proposals for relieving a production bottleneck Sec. 13.1
A case study: How much of a perishable product should be added to a retailer’s inventory? Sec. 13.3
Plan a complex project to ensure a strong likelihood of meeting the project deadline
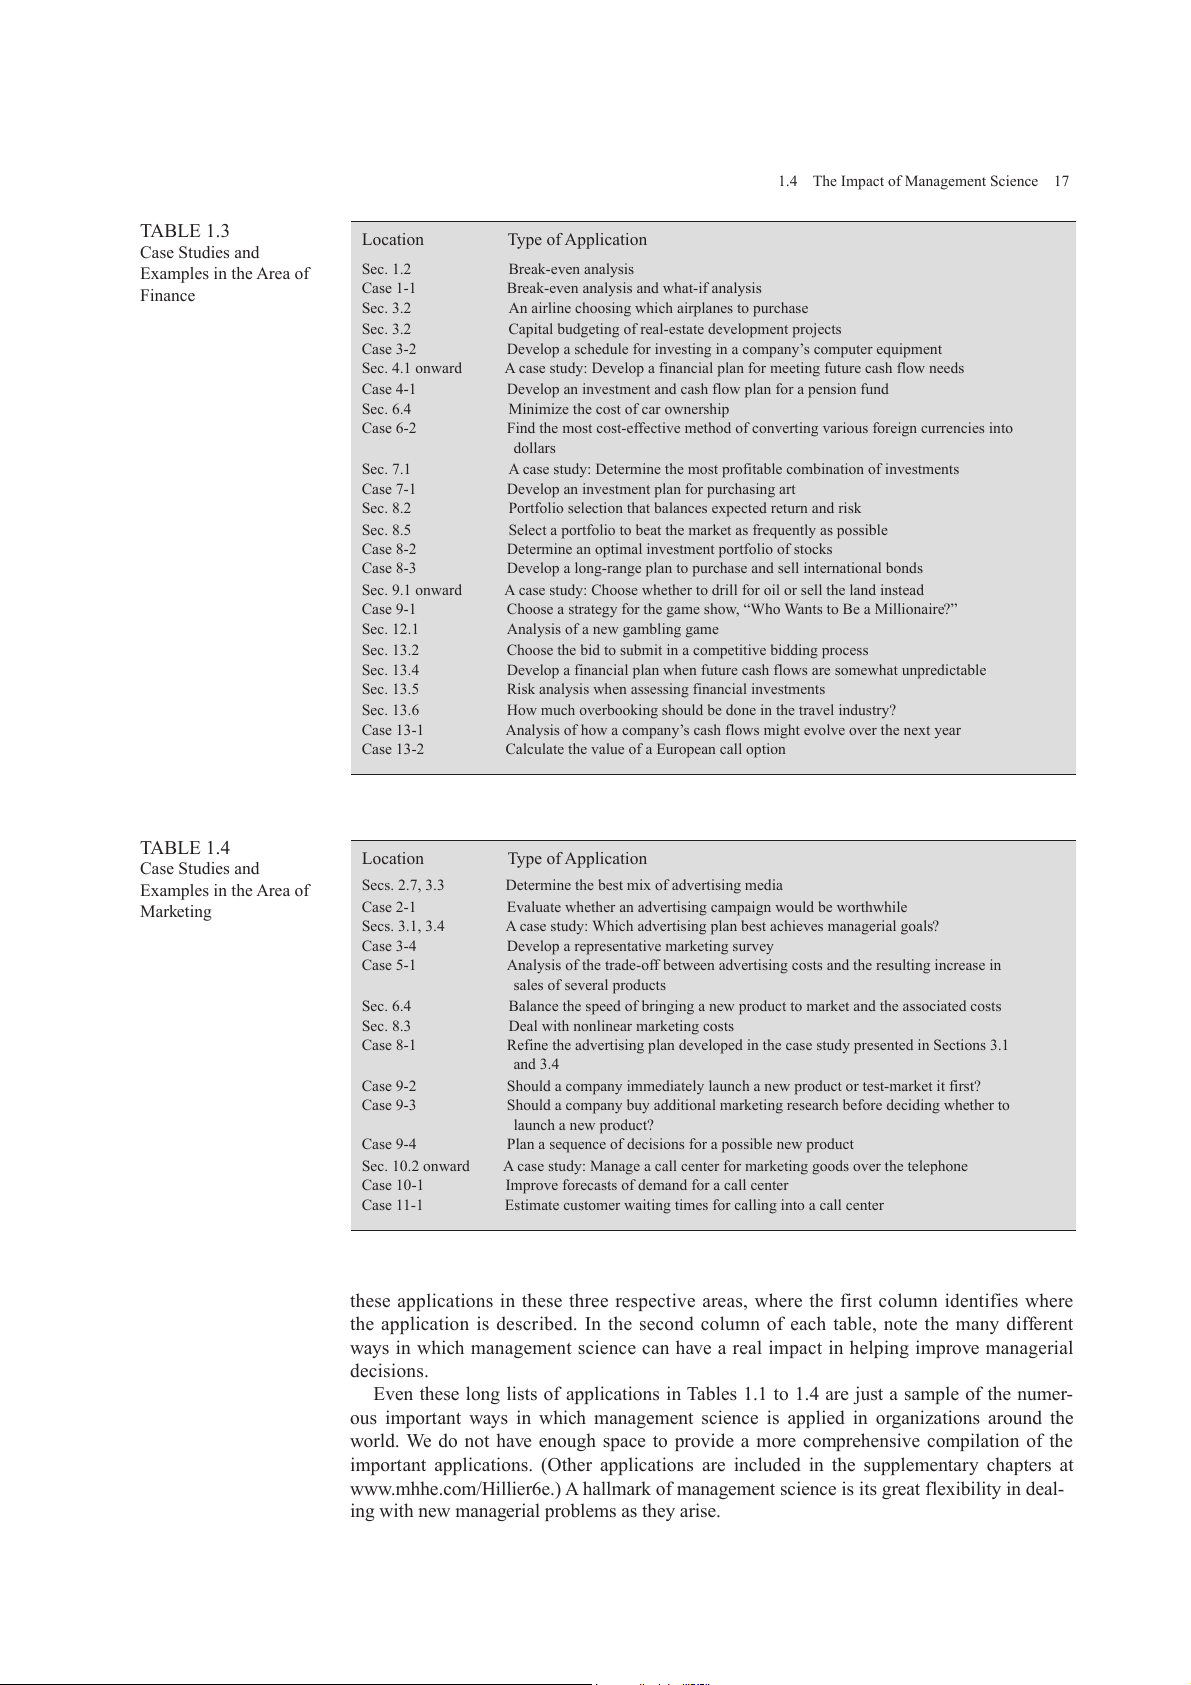
1.4 The Impact of Management Science 17 TABLE 1.3 Location Type of Application Case Studies and Sec. 1.2 Break-even analysis Examples in the Area of Case 1-1
Break-even analysis and what-if analysis Finance Sec. 3.2
An airline choosing which airplanes to purchase Sec. 3.2
Capital budgeting of real-estate development projects Case 3-2
Develop a schedule for investing in a company’s computer equipment Sec. 4.1 onward
A case study: Develop a financial plan for meeting future cash flow needs Case 4-1
Develop an investment and cash flow plan for a pension fund Sec. 6.4
Minimize the cost of car ownership Case 6-2
Find the most cost-effective method of converting various foreign currencies into dollars Sec. 7.1
A case study: Determine the most profitable combination of investments Case 7-1
Develop an investment plan for purchasing art Sec. 8.2
Portfolio selection that balances expected return and risk Sec. 8.5
Select a portfolio to beat the market as frequently as possible Case 8-2
Determine an optimal investment portfolio of stocks Case 8-3
Develop a long-range plan to purchase and sell international bonds Sec. 9.1 onward
A case study: Choose whether to drill for oil or sell the land instead Case 9-1
Choose a strategy for the game show, “Who Wants to Be a Millionaire?” Sec. 12.1
Analysis of a new gambling game Sec. 13.2
Choose the bid to submit in a competitive bidding process Sec. 13.4
Develop a financial plan when future cash flows are somewhat unpredictable Sec. 13.5
Risk analysis when assessing financial investments Sec. 13.6
How much overbooking should be done in the travel industry? Case 13-1
Analysis of how a company’s cash flows might evolve over the next year Case 13-2
Calculate the value of a European call option TABLE 1.4 Location Type of Application Case Studies and Secs. 2.7, 3.3
Determine the best mix of advertising media Examples in the Area of Case 2-1
Evaluate whether an advertising campaign would be worthwhile Marketing Secs. 3.1, 3.4
A case study: Which advertising plan best achieves managerial goals? Case 3-4
Develop a representative marketing survey Case 5-1
Analysis of the trade-off between advertising costs and the resulting increase in sales of several products Sec. 6.4
Balance the speed of bringing a new product to market and the associated costs Sec. 8.3
Deal with nonlinear marketing costs Case 8-1
Refine the advertising plan developed in the case study presented in Sections 3.1 and 3.4 Case 9-2
Should a company immediately launch a new product or test-market it first? Case 9-3
Should a company buy additional marketing research before deciding whether to launch a new product? Case 9-4
Plan a sequence of decisions for a possible new product Sec. 10.2 onward
A case study: Manage a call center for marketing goods over the telephone Case 10-1
Improve forecasts of demand for a call center Case 11-1
Estimate customer waiting times for calling into a call center
these applications in these three respective areas, where the first column identifies where
the application is described. In the second column of each table, note the many different
ways in which management science can have a real impact in helping improve managerial decisions.
Even these long lists of applications in Tables 1.1 to 1.4 are just a sample of the numer-
ous important ways in which management science is applied in organizations around the
world. We do not have enough space to provide a more comprehensive compilation of the
important applications. (Other applications are included in the supplementary chapters at
www.mhhe.com/Hillier6e.) A hallmark of management science is its great flexibility in deal-
ing with new managerial problems as they arise. 18 Chapter One Introduction
1.5 SOME SPECIAL FEATURES OF THIS BOOK
The focus of this book is on teaching what an enlightened future manager needs to learn from
a management science course. It is not on trying to train technical analysts. This focus has led
us to include a number of special features that we hope you enjoy.
One special feature is that the entire book revolves around modeling as an aid to manage-
rial decision making. This is what is particularly relevant to a manager. Although they may
not use this term, all managers often engage in at least informal modeling (abstracting the
essence of a problem to better analyze it), so learning more about the art of modeling is
important. Since managers instigate larger management science studies done by others, they
also need to be able to recognize the kinds of managerial problems where such a study might
be helpful. Thus, a future manager should acquire the ability both to recognize when a man-
agement science model might be applicable and to properly interpret the results from analyz-
ing the model. Therefore, rather than spending substantial time in this book on mathematical
theory, the mechanics of solution procedures, or the manipulation of spreadsheets, the focus is
on the art of model formulation, the role of a model, and the analysis of model results. A wide
range of model types is considered.
Another special feature is a heavy emphasis on case studies to better convey these ideas in
an interesting way in the context of applications. Every subsequent chapter includes at least
one case study that introduces and illustrates the application of that chapter’s techniques in a
realistic setting. In a few instances, the entire chapter revolves around a case study. Although
considerably smaller and simpler than most real studies (to maintain clarity), these case stud-
ies are patterned after actual applications requiring a major management science study. Con-
sequently, they convey the whole process of such a study, some of the pitfalls involved, and
the complementary roles of the management science team and the manager responsible for the decisions to be made.
To complement these case studies, every chapter also includes major cases at the end.
These realistic cases can be used for individual assignments, team projects, or case studies in
class. In addition, the University of Western Ontario Ivey School of Business (the second larg-
est producer of teaching cases in the world) also has specially selected cases from its case col-
lection that match the chapters in this textbook. These cases are available on the Ivey Website,
www.cases.ivey.uwo.ca/cases, in the segment of the CaseMate area designated for this book.
The book also places heavy emphasis on conveying the impressive impact that management
science is having on improving the efficiency of numerous organizations around the world.
Therefore, you will see many examples of actual applications throughout the book in the form of
boxed application vignettes. You then will have the opportunity to learn more about these actual
applications by reading the articles fully describing them through using the links provided in
www.mhhe.com/Hillier6e. As indicated in Table 1.1, these applications sometimes resulted in
annual savings of millions, tens of millions, or even hundreds of millions of dollars.
In addition, we try to provide you with a broad perspective about the nature of the real
world of management science in practice. It is easy to lose sight of this world when cranking
through textbook exercises to master the mechanics of a series of techniques. Therefore, we
shift some emphasis from mastering these mechanics to seeing the big picture. The case stud-
ies, cases, and descriptions of actual applications are part of this effort.
A new feature with this edition is the inclusion of a McGraw-Hill web-based learning
tool called Connect. In addition to providing various instructor resources, Connect includes
a powerful tool called SmartBook that provides personalized instruction to help students
better learn the material. Many students might benefit by using SmartBook. This tool can be accessed at
connect.mheducation.com. The preface provides more information about both Connect and SmartBook.
Another feature is the inclusion of one or more solved problems for each chapter to help
you get started on your homework for that chapter. The statement of each solved problem is
given just above the Problems section of the chapter, and then you can find the complete solu-
tions at www.mhhe.com/Hillier6e.
As described further in the preface, this same website provides a full range of resources
of interest to students, including access to supplementary text material (both supplements to
1.5 Some Special Features of this Book 19
book chapters and additional chapters) and much more. For example, this website includes
numerous spreadsheet files for every chapter in this book. Each time a spreadsheet example
is presented in the book, a live spreadsheet that shows the formulation and solution for the
example also is provided. This gives a convenient reference, or even useful templates, when
you set up spreadsheets to solve similar problems. Also, for many models in the book, tem-
plate spreadsheet files are provided that already include all the equations necessary to solve
the model. You simply enter the data for the model and the solution is immediately calculated.
The last, but certainly not the least, of the special features of this book is the accompany-
ing software. We will describe and illustrate how to use today’s premier spreadsheet package,
Microsoft Excel, to formulate many management science models in a spreadsheet format. Many
of the models considered in this book can be solved using standard Excel. Some Excel add-ins
also are available to solve other models. Appendix A provides a primer on the use of Excel.
Included with standard Excel is an add-in, called Solver, which is used to solve most of
the optimization models considered in the first half of this book. Also included with this
edition of the textbook is a very powerful software package from Frontline Systems, Inc.,
called Analytic Solver® for Education (hereafter referred to as Analytic Solver). Instructions
for downloading this software are available at www.mhhe.com/Hillier6e. Some special fea-
tures of Analytic Solver are a significantly enhanced version of the basic Solver included with
Excel, the ability to build decision trees within Excel, as covered in Chapter 9, forecasting
tools, as covered in Chapter 10, and tools to build computer simulation models within Excel,
as covered in Chapter 13. In addition to the Analytic Solver add-in for Excel, you also have
access to AnalyticSolver.com. This is cloud-based software accessed through a browser. It has
the same look and essentially all the features of Analytic Solver in Excel, but can be used by
any computer with access to the Internet without downloading additional software.
Most of the software used in this book is compatible with both Excel for Windows PCs
and Excel for Macintosh computers (Macs). Analytic Solver is no tdirectly compatible with
Macs, although it works well on any recent Mac with Boot Camp or virtualization software.
AnalyticSolver.com works through a browser, so can be used with both Windows and Macs
(or even other operating systems). For the most up-to-date information on software compat-
ibility and relevant differences between Windows PC versions and Mac versions, please refer
to the Software Compatibility link at www.mhhe.com/Hillier6e.
We should point out that Excel is not designed for dealing with the really large manage-
ment science models that occasionally arise in practice. More powerful software packages
that are not based on spreadsheets generally are used to solve such models instead. How-
ever, management science teams, not managers, primarily use these sophisticated packages
(including using modeling languages to help input the large models). Since this book is aimed
mainly at future managers rather than future management scientists, we will not have you use these packages.
To alert you to relevant learning aids available, the end of each chapter has a list entitled
“Learning Aids for This Chapter.”
Management science is a discipline area that attempts to aid managerial decision making by applying a 1.6 Summary
scientific approach to managerial problems that involve quantitative factors. The rapid development of
this discipline began in the 1940s and 1950s. The onslaught of the computer revolution has since con-
tinued to give great impetus to its growth. Further impetus now is being provided by the widespread use
of spreadsheet software, which greatly facilitates the application of management science by managers and others.
A major management science study involves conducting a systematic investigation that includes care-
ful data gathering, developing and testing hypotheses about the problem (typically in the form of a math-
ematical model), and applying sound logic in the subsequent analysis. The management science team
then presents its recommendations to the managers who must make the decisions about how to resolve
the problem. Smaller studies might be done by managers themselves with the aid of spreadsheets.
A major part of a typical management science study involves incorporating the quantitative factors
into a mathematical model (perhaps incorporated into a spreadsheet) and then applying mathematical
Tài liệu liên quan:
-

Ôn tập chương 1-4: Đáp án & Giải thích chi tiết | Kinh tế vĩ mô | Trường Đại học kinh tế Thành Phố Hồ Chí Minh
24 12 -
Bài tập: Phân tích cung cầu và ảnh hưởng đến giá cả | Kinh tế vĩ mô | Trường Đại học kinh tế Thành Phố Hồ Chí Minh
29 15 -

Bài tiểu luận ôn tập | Kinh tế vĩ mô | Trường Đại học kinh tế Thành Phố Hồ Chí Minh
29 15 -

Tiểu luận vĩ mô: Phân Tích Lạm Phát ở Mỹ & Giải Pháp Kiềm Chế (Kinh tế) | Kinh tế vĩ mô | Trường Đại học kinh tế Thành Phố Hồ Chí Minh
23 12 -

Management Environment Analysis Report - LocknLock & Vinfast Insights | Kinh tế vĩ mô | Trường Đại học kinh tế Thành Phố Hồ Chí Minh
22 11