Microeconomics Notes - Key Principles and Market Forces môn Kinh tế vi mô | Trường Đại học Kinh Tế Quốc Dân
Scarcity: limited nature of society’s resources.- Economics - how society manages its scarce resources. - Economists study .Tài liệu giúp bạn tham khảo, ôn tập và đạt kết quả cao. Mời đọc đón xem!
Môn: Kinh tế vi mô ( NEU ) 762 tài liệu
Trường: Trường Đại học Kinh Tế Quốc Dân 7.6 K tài liệu
Tác giả:


Preview text:
Chapter 1: 10 Principles Of Economics -
Scarcity: limited nature of society’s resources. -
Economics - how society manages its scarce resources. - Economists study: +
people: buy, work, save, spend. +
firms: produce, workers - hire. +
society: divide resources - national defense, consumer goods, protect environment, other needs. - 10 principles: + p1 - pp face trade-offs
*get smt that we like <-> give up smt else that we also like.
*society face trade-offs [e.g. more national defense (gun) <-> less consumer
goods - raise standard of living] *efficiency *equality
*tradeoff: greater equality → destroy efficiency (<=>) +
p2 - the cost of smt is what you give up to get it
*compare costs with benefits of alternatives (include opportunity costs)
*opportunity cost: whatever must be given up to obtain some item, best
alternative forgone - only cost relevant to decision making
*sunk cost >< opportunity cost [e.g. tuition fee/ uniform/.. >< accommodation/ food/..] +
p3 - rational pp think at the margin
*rational pp - systematically and purposefully do the best → achieve
objectives, given available opportunities; make decisions by
evaluating costs and benefits of marginal changes.
*marginal benefit (MB) - increase in total benefit from one extra unit of the
good → MB = total benefit/ quantity.
*marginal cost (MC) - increase in total cost from from one extra unit of
the good → (tương tự MB nhưng là TC) *optimal point ← MB = MC + p4 - pp respond to incentives
*incentive: smt that induces a person to act [e.g. gas prices rise →
more hybrid cars + fewer gas guzzling SUVs; cigarette taxes
increase → teen smoking falls]
ex. A. MB = 7.500 MC = 900 → MB > MC
B. MB = 800 MC = 900 → MB < MC +
p5 - trade can make everyone better off
*pp benefit from trade: pp can buy a greater variety of goods and services at lower cost
*countries benefit from trade and specialization: get a better price
abroad for goods they produce; buy other goods more cheaply from
abroad than could be produces at home [VN - rice & US - electronic
equipment → exchange → work better]
*comparative advantage (relative advantage): the ability of a person to
perform an activity or produce a good or service at a lower opportunity cost
than someone else [Liz & Joe]
*absolute advantage: is a situation in which one person is more productive
than another person in several or even all activities. Liz is three times as
productive as Joe - Liz can produce 15 smt and 15 salads an hour and Joe
can produce only 5 smt and 5 salads an hour]
*barter trade: exchange directly + no currency
*terms of trade: [1 smt = 2 salads & 1 salads = 0.5 smt] +
p6 - market are usually a good way to organize economic activity
*market: a group of buyers and sellers (need not be in a single location)
*”organize economic activity” means determining: what goods and
services to produce; how much of each to produce; how do you
produce; who produced and consumed these → 3 ways: centrally
planned economy government; market economy (not government but market); mixed economy (both)
*a market economy allocates resources: decentralized
*prices: determined - interaction of buyers and sellers; reflect the good’s value
to buyers; reflect the cost od producing the good
*invisible hand: prices guild self-interested households and firms to make
decisions that maximize society’s economic well-being +
p7 - governments can sometimes improve market outcomes
*government - enforce property rights: enforce rules and maintain institutions
that are key ro a market economy [pp are less inclined to work, produce,
invest, or purchase if large risk of their property being stolen]
*government - promote efficiency: avoid market failures [market left on its own
fails to allocate resources efficiency]; externality - source of market failure
[production or consumption of a good affects bystanders (e.g. pollution);
market power - source of market failure [a single buyer or seller has
substantial influence on market price (e.g.monopoly)
*government - promote equality: avoid disparities in economic well-being; use
tax or welfare policies to chage how the economic “pie” is divided +
p8 - country’s standard of living depends on its ability to produce goods and services
*huge variation in living standards: across countries and over time; average
income in rich countries; the US standard of living today *poor country - < 800 USD
*middle income country (low - 80~600 USD & high - 600~1200 USD) *rich country - > 1200 USD
*productivity - most important determinant of living standards (quantity of
goods and services produced from each unit of labor input; depends on the
equipment, skills, and technology available to workers [other factors like labor
unions and competition from abroad have far less impact on living standards]) +
p9 - prices rise when the government prints too much money
*inflation: an increase in the overall level of prices in the economy
*in the long run: inflation is almost always caused by excessive growth in the
quantity of money, which causes the value of money to fall; the faster the
government creates money, the greater the inflation rate +
p10 - society faces a short-run trade-of between inflation and unemployment
*short-run trade-off between unemployment and inflation: over a period of a
year or two, many economic policies push inflation and unemployment in
opposite directions; other factors can make this tradeoff more or less
favorable, but the tradeoff is always present
Chapter 2: Thinking Like An Economist The PPF: What we know so far -
Points on the PPF (like A-E): possible
Efficient: all resources are fully utilized -
Points under the PPF (like F): possible
Not efficient: some resources are underutilized (e.g. workers unemployed, factories idle) -
Point above the PPF (like G): not possible - Moving along a PPF
Involving shifting resources from the production of one good to the other - Society faces a tradeoff
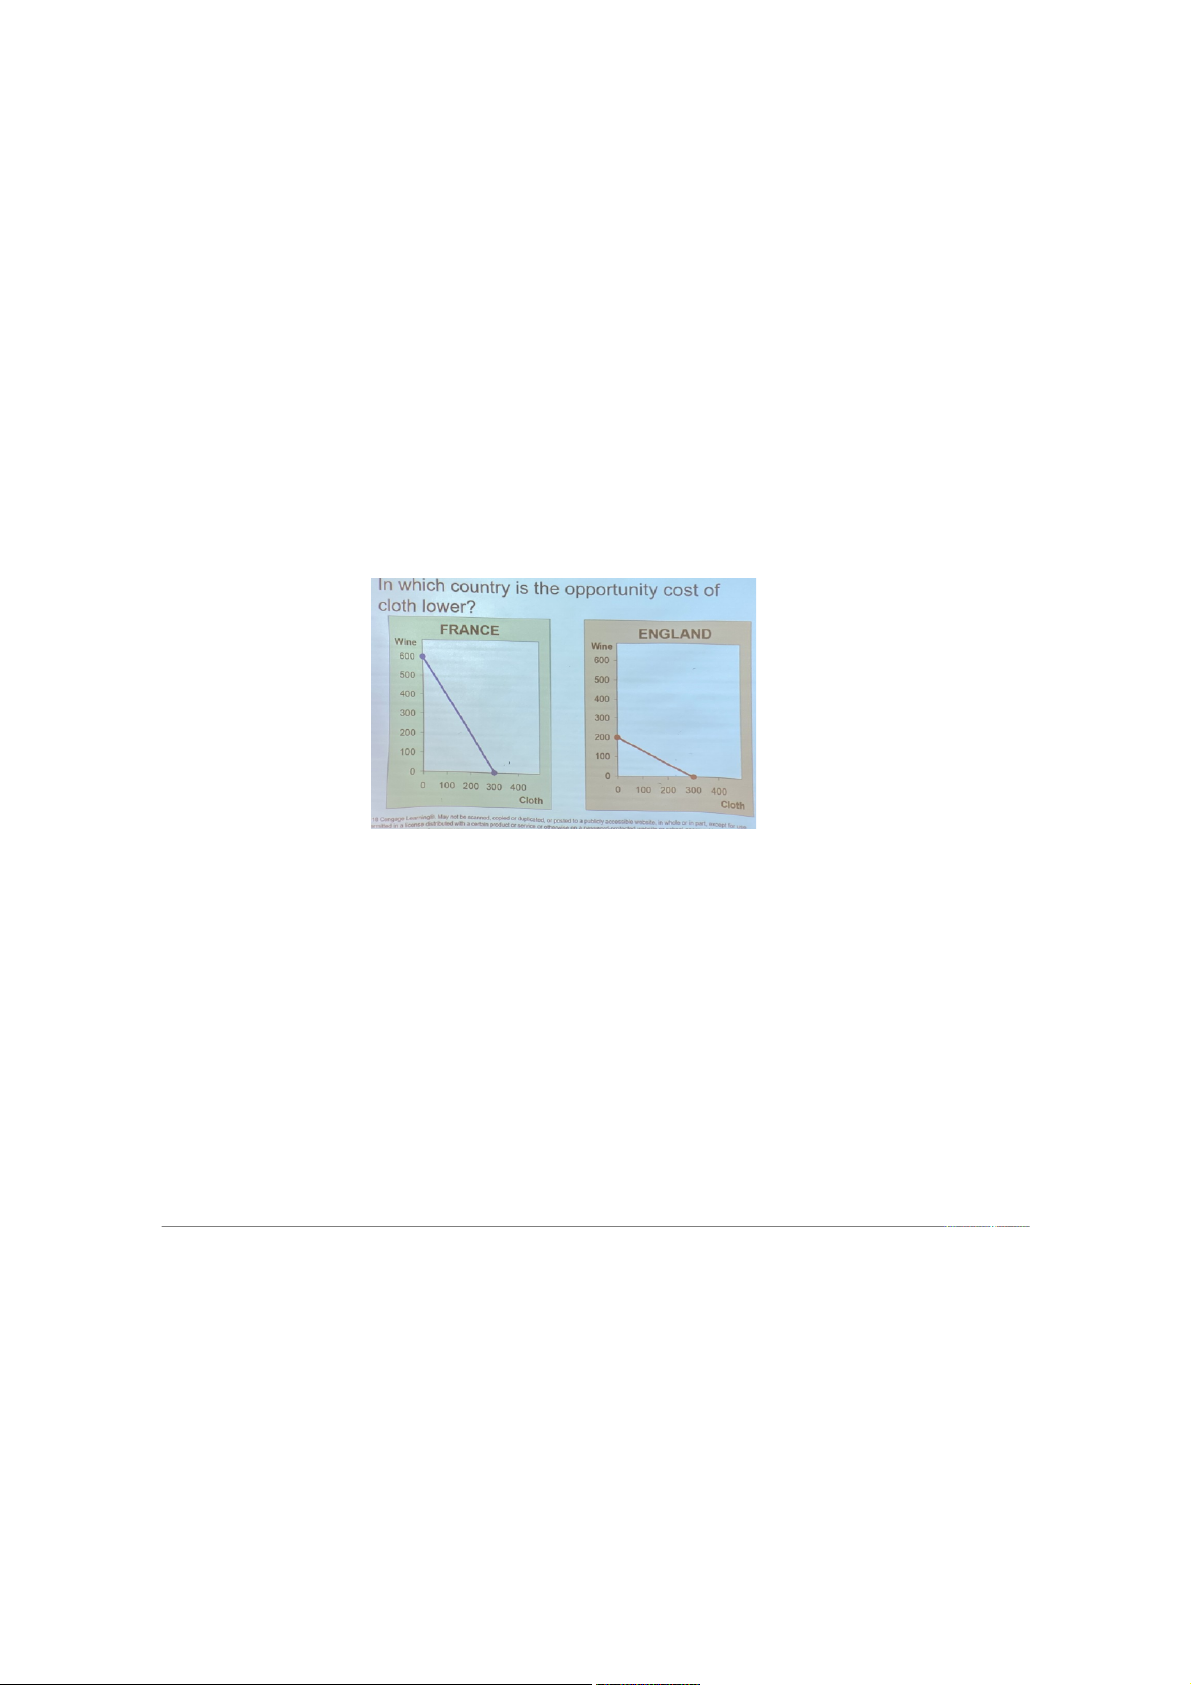
Getting more of one good requires sacrificing some of the other - The slope of the PPF
The opportunity cost of one good in terms of the other *Cloth
France: OC = 2 of wines (slop = -2)
England: OC = ⅔ of wines (slop = - ⅔) *Wine France: OC = ½ of cloth England: OC = 3/2 of cloth
*If France and England unite, what is the OC and draw the graph -
With additional resources (labor/ capital/ natural resources → expanding
horizontally) or an improvement in technology (productivity → improving the
quality of growth), the economy can produce more computers, more wheat,
or any combination in between → economic growth shifts the PPF outward - The shape of the PPF +
Straight line: constant opportunity cost +
Bowed outward: increasing opportunity cost, when: ●
Different workers have dif skilss ●
Dif opportunity costs of producing one good in terms of the other ●
There is some other resource, or mix of resources with varying opportunity costs
E.g. dif types of land suited for dif uses - Classify micro and macro +
Micro: the study of how households and firms make decisions and how they interact in markets +
Macro: the study of economy-wide phenomena, including inflation
unemployment, and economic growth -
Positive statements: descriptive +
Attemp to describe the world as it is +
Confirm or refute by examining evidence: “minimum-wage laws cause unemployment” -
Normative statements: prescriptive
Attempt to prescribe how the world should be: “the government should raise the minimum wage”
→ will become positive if there are more evidence to support -
Economists often give conflicting policy advice +
Can disagree about the validity of alternative positive theories about the world +
May have dif values and, therefore, dif normative views about what policy should try to accomplish -
Yet, there are many propositions about which most economist agree
Chapter 3: Independence and the Gains from Trade (self-reading)
Chapter 4: The Market Forces of Supply and Demand - Market: +
A group of buyers and sellers of a particular good or service + Buyers as a group
Determine the demand for the product + Sellers as a group
Determine the supply of the product - Competitive market
Many buyers and many sellers, each has a negligible on market price -
Perfectly competitive market/ Perfect competition + All goods are exactly the same +
Buyers and sellers are no numerous that no one can affect the market price, “Price takers” - Quantity demanded (QD¿
Amount of a good that buyers are willing and able to purchase - Law of demand (-) + Suppose other things equal
+When the price (P) of a good rises → the quantity demanded of the good falls
+When the price falls → the quantity demanded rises [Vertical → for price] - Three type of demand: + Demand schedule + Demand curve + Demand function - Market demand +
Sum of all individual demands for a good or service +
Market demand curve: sum the individual demand curves horizontally
To find the total quantity demanded at any price, we add the individual quantities - The demand curve
Show how price affects quantity demanded, other things being equal -
These “other things” are non-price determinants of demand
Things that determine buyers’ demand for a good, other than the good’s price -
Changes in them shift the D curve… -
Demand curve shifters: [Demand increase/ decrease ≠ QD increase decrease) + Number of buyers ● Increase in # of buyers
Increases quantity demanded at each price Shifts D curve to the right ● Decrease in # of buyers
Decreases quantity demanded at each price Shifts D curve to the left + Expectations about the future ●
Expect an increase in income, increase in current demand ●
Expect higher prices, increase in current demand ●
Example: If pp expect their incomes to rise, their D for meals at
expensive restaurants may increase now + Tastes (preferences) ●
Anything that causes a shift in tastes toward a good will increase
demand for that good and shift its D curve to the right ●
Example: The Atkins diet became popular in the 90s, caused an
increase in demand for eggs, shifted the egg demand curve to the right +
Prices of related goods, complements ● Two goods are complements if
An increase in the price of one leads to a decrease in the demand for the other ●
Example: computers and software
If price of computers rises, pp buy fewer computers, and therefore
less software; Software demand curve shifts left ●
Other examples: College tuition and textbooks, bagels and cream cheese, eggs and bacon +
Price of related goods, substitutes ● Two goods are substitutes if
An increase in the price of one leads to an increase in the demand for the other ● Exmaple: pizza and hamburgers
An increase in the price of pizza increases demand for hamburgers,
shifting hamburger demand curve to the right ●
Other examples: Coke and Pepsi, laptops and tablets, music CDs and music downloads + Income ●
Normal good, other things constant
An increase in income leads ot an increase in demand: shifts D curve to the right
*necessity good (medicine/ food/ gas) → safer
*luxury good (house/ car) → business with this is risker ●
Inferior good, others things constant
An increase in income leads to a decrease in demandL shifts D curve to the left
⇒ Summary: Variables that influence buyers Variable A change in this variable Price of the good itself
Represents a movement along the demand curve Income Shifts the demand curve Prices of related goods Shifts the demand curve Tastes Shifts the demand curve Expectation Shifts the demand curve Number of buyers Shifts the demand curve - Quantity supplied (QS ) + Amount of a good +
Sellers are willing and able to sell - Law of supply (+) + Other things equal +
When the price of a good rises, the quantity supplied of the good rises +
When the price falls, the quantity supplied falls - Three type of supply: + Supply schedule + Supply curve + Supply function - Market supply +
Sum of the supplies of all sellers of a goof or service +
Market supply curve: sum of individual supply curves horizontally
To find the total quantity supplied at any price, we add the individual quantities - The supply curve
Shows how price affects quantity supplied, other things being equal. - These “other things”
Are non-price determinants of supply. -
Changes in them shift the S curve. - Supply curve shifters + Input prices ●
Supply is negatively related to prices of inputs ●
Example of input prices: wages, prices of raw materials ●
A fall in input prices makes production more profitable at each output price
Firms supply a larger quantity at each price
The S curve shifts to the right + Technology ●
Determines how much inputs are required to produce a unit of output ●
A cost-saving technological improvement has the same effect as a fall
in input prices, shifts S curve to the right + Number of sellers ●
An increase in the number of sellers
Increases the quantity supplied at each price Shifts S curve to the right +
Expectations about future (very strong) ●
Example: Events in the Middle East lead to expectations of higher oil prices.
Owners of Texas oilfields reduce supply now, save some inventory to
sell later at the higher price. S curve shifts left. ●
Sellers may adjust supply** when their expectations of future prices
change (**if good not perishable)
[+ Government policy (raising taxes)]
⇒ Summary: Variables that influence sellers Variable A change in this variable Price of the good itself
Represents a movement along the supply curve Input prices Shifts the supply curve Technology Shifts the supply curve Expectations Shifts the supply curve Number of sellers Shifts the supply curve -
What is ‘tax return preparation software’?
+graduate → income → personal income tax (PIT) +
many source of income (deposit, land, stock,..)
⇒ in the end of each year - have to do tax claims → buy /ask someone to do the
tax return preparation software -
Equilibrium point (not static/ stable): price has reached the level where quantity
supplied equals quantity demanded -
Equilibrium price (PE ): price where Q supplied = Q demanded -
Equilibrium quantity (QE ): Q supplied and demanded at the equilibrium price. - Markets not in equilibrium
+Surplus (excess supply): quantity supplied is greater than quantity
demanded → continues to decrease, until there are nothing to decrease +
Shortage (excess demand): quantity demanded is greater than quantity supplied
→ continue to increase until market reaches equilibrium point [bieu do - anh] -
Three steps to analyzing changes in equilibrium +
Decide whether the events shifts the supply curve, the demand curve, or, in some cases, both curves (1) +
Decide whether the curve shifts to the right or to the left (2) +
Use the supply-and-demand diagram (3) ●
Compare the initial and the new equilibrium ●
Effects on equilibrium price and quantity - Shift vs Movement along curve + Change in supply ● A shift in the S curve ●
Occurs when a non-price determinant of supply changes (like technology or costs) +
Change in the quantity supplied ●
A movement along a fixed S curve ● Occurs when P changes + Change in demand ● A shift in the D curve ●
Occurs when a non-price determinant of demand changes (like income or # of buyers) +
Change in the quantity demanded ●
A movement along affixed D curve ● Occurs when P changes - How prices allocate resources +
“Markets are usually a good way to organize economic activity” + In market economies ●
Prices adjust to balance supply and demand + These equilibrium prices ●
Are the signalas that giuld economic decisions and thereby allocate scarce resources.
Chapter 5: Elasticity and Its Application - Product life cycle (PLC): + Introduction + Growth + Saturation + Recession -
Elasticity: measure of the responsiveness of Qd or QS
To a change in one of its determinants ¿ E X% ❑ (< 0) Y% ●
E❑ = 5 →Y rise by 1% →X rise by 5% → X is very sensitive to changes in Y ●
E❑ = -0.5 → Y rise by 1% →X drop by 0.5% → X is very insensitive to changes in Y -
Price elasticity of demand (denoted: EDp ): How much the quantity demanded of a
good responds to a change in the price of that good
Loosely speaking, it measures the price-sensitivity of buyers’ demand ¿ΔQ E D% Dp (< 0) Δ P% ●
EDp = -5 → buyers are very sensitive ●
EDp = -0.1 → buyers and very insensitive -
Midpoint method: the midpoint is the number halfway between the start and end values ● The average of those values
percentage change=endvalue −startvalue midpointx100%
Priceelasticityof demand =(Q2−Q1)/[(Q2+Q1)/2] ¿¿ - Point elasticity [anh] -
Determinants of price elasticity of demand
We look at a series of examples comparing two common goods. - In each example: ●
Suppose prices of both goods rise by 20% ●
Which good has the highest price elasticity of demand? Why? ●
What lesson we learn abt the determinants of price elasticity of demand? -
Ex 1. Breakfast cereal vs Sunscreen ●
Prices of both of these goods rise by 20%. For which good does Qd drop the most? Why?
→ Breakfast cereal has close substitutes, so buyers can easily switch if the price rises.
→ Sunscreen has no close cubstitutes, so a price increase would not affect demand very much.
⇒ Price elasticity is higher when close substitutes are available. - Ex 2. Blue jeans vs Clothing ●
Prices of both of these goods rise by 20%. For which good does Qd drop the most? Why?
→ For a narrowly defined good, blue jeans, there are many
substitutes available for broadly defined goods (clothing)
⇒ Price elasticity is higher for narrowly defined goods than for broadly defined ones. - Ex 3. Insulin vs Yatchs ●
Prices of both of these goods rise by 20%. For which good does Qd drop the most? Why?
→ Insulin is a necesity to diabetics. A rise in price would cause litter of no decrease in demand.
→ A yacht is a luxury. If the price rises, some people will forego it.
⇒ Price elasticity is high for luxuries than for necessities. -
Ex 4. Gasoline in the short run vs Gasoline in the long run ●
The price of gasoline rises by 20%. For which good does Qd drop the most? Why?
→ There’s not much people can do in the short run, other than ride the bus or carpool.
→ In the long run, people can buy smaller cars or live closer to work.
⇒ Price elasticity is higher in the long run. - Variety of demand curves: +
Demand is elastic: EDp>1 .
P increases by 1% → Qd decreases by more than 1% ⇒ Buyers are sensitive. +
Demand is inelastic: EDp<1 .
P increases by 1% → Qd decreases by lower than 1% ⇒ Buyers are insensitive. +
Demand has unit elasticity: EDp=1 .
P increases by 1% → Qd decreases by 1%
+Special: Perfectly inelastic - EDp=0 .
→ Buyers have no reaction with the change
+Special: Perfectly elastic - EDp=∞ .
→ Buyers have strong reaction (?) even without any change - Total Revenue (TR) = P x Q -
A price increase has 2 effects on revenue: +
Higher revenue: bc of the higher P +
Lower revenue: you sell fewer units (lower Q) -
Which of these 2 effects is bigger?
→ It depends on the price elasticity of demand. -
For a price increase, if demand is elastic +
E > 1: % change in Q > % change in P +
TR decreases: the fall in revenue from lower Q > the increase in revenue from higher P. -
For a price increase, if demand is inelastic +
E < 1: % change in Q < % change in P +
TR increases: the fall in revenue from lower Q < the increase in revenue from higher P. - Price elasticity of supply +
How much the quantity supplied of a good responds to a change in the price of that good. +
Percentage change in quantity supplied. ●
Divided by the percentage change in price. +
Loosely speaking, it measures sellers’ price-sensitivity. - Variety of supply curves: +
Supply is unit elastic: ES=1 +
Supply is elastic: ES>1 +
Supply is inelastic: ES<1
+Special: Supply is perfectly inelastic - ES=0 ● Supply curve is vertical.
+Special: Supply is perfectly elastic - ES=∞ ● Supply curve is horizontal. - The flatter the supply curve
The greater the price elasticity of supply. -
Greater price elasticity of supply +
The more easily sellers can change the quantity they produce.
Supply of beachfront property - harder to vary and thus less elastic than supply of new cars. -
Price elasticity of supply is greater in the long run than in the short run +
In the long run: firms can build newfactories, or new firms may be able to enter the market.
** Other Elasticities of Demand - Income elasticity of demand +
How much the quantity demanded of a good responds toa change in consumers’ income. +
Percentage change in quantity demanded ●
Divided by the percentage in income. +
Normal goods: income elasticity > 0. +
Inferior goods: income elasticity < 0. -
Cross-price elasticity of demand +
How much the Qd of one good responds to a change in the price of another good. +
Percentage change in Qd of the first good ●
Divided by the percentage change in price of the second good. +
Substitutes: cross-price elasticity > 0 +
Complements: cross-price elasticity < 0
Chapter 6: Supply, Demand, and Government Policies - Price controls: +
Price ceiling: legal maximum on the price at which good can be sold. ● Rent-control laws. +
Price floor: legal minimum on the price at which a good can be sold. ● Minimum wage laws. -
Taxes/ Subsidy: government can make buyers or sellers pay a specific amount on each unit. - Because of shortage:
Sellers must ration the goods among buyers. - Some rationing mechanisms: + Long lines +
Discrimination according to sellers’ biases.
Are often unfair and inefficient ●
The goods do not necessarily go to the buyers who value them most highly. - Shortage: + Rationing + Low quality + (may create) Black market
+Smuggling (gasoline market: gas in cambodia is free → gap between
price in vn and cambodia → buy gas in vn and sell in cambodia → Sumggling) -
How price ceilings affect market outcomes +
A price ceiling above the equilibrium price is not binding - has no effect on the market outcome. +
The equilibrium price ($800) is above the ceiling and therefore illegal. The
price ceiling is binding, causes a shortage. -
How price floors affect market outcomes +
A price floor below the equilibrium price is not binding - has no effect on the market outcome. +
The equilibrium wage ($6) is below the floor and therefore illegal. The price
floor is binding, causes a surplus (e.g.unemployment) -
Governments can sometimes improve market outcomes + Want to use price controls ●
Because of unfair market outcome ● Aimed at helping the poor +
Often hurt those they are trying to help +
Other ways of helping those in need ● Rent subsidies ●
Wage subsidies (earned income tax credit) ** Taxes - Government uses taxes +
To raise revenue for public projects: Roads, schools, and national defense. - Tax incidence +
Manner in which the burden of a tax is shared among participants in a market:
The government can make the seller or buyer to pay the tax. -
Ps : Price received by the sellers. -
PB : Price paid by the buyers.
Chapter 7: Consumers, Producers, and the Efficiency of Markets - Wellfare economics: +
Allocation of resources refers to ●
How much of each good is produced. ●
Which producers produce it: anyone who willing to sell product at *P ● Which consumers consume it. + Welfare economics ●
Studies how the allocation of resources affects economic well-being. - Willingness to pay (WTP)
A buyer’s willingness to pay for a good ●
Maximum amount the buyers will pay for that good ●
How much the buyer values the good - Consumer surplus (CS)
Amount a buyer is willing to pay minus the amount the buyer actually pays (CS = WTP - P) **Producer surplus -
Cost: Value of everything a seller must give up to produce a good ●
Measure of willingness to sell: produce and sell the good/service only if the price > cost. -
Derive the supply schedule from the cost data. -
Marginal seller: the seller who would leave the market were any longer. -
Producer surplus (PS = P - Cost): +
amount a seller is paid for a good minus the seller’s cost of providing it. +
price received minus willingnes to sell. ** Market efficiency -
Total surplus (TS) = CS + PS = Value to buyers - Cost to sellers +
Consumer surplus = Value to buyers - Amount paid by buyers ●
Buyers’ gains from participating in the market. +
Producer surplus = Amount received by sellers - Cost to sellers ●
Sellers’ gains from participating in the market.
**Market’s allocation of resources -
Allocation of resources - desirable? +
Decentralized (in a market economy) ●
Determined by interactions of many self-interested buyers and sellers. +
Total surplus - measure of society’s well-being ●
To consider whether the market’s allocation is efficient. -
Efficient allocation of resources maximizes total surplus +
(1) The goods are consumed by the buyers who value them most highly. +
(2) The goods are produced by the producers with the lowest costs. +
(3) Raising or lowering the quantity of a good would not increase total surplus. **Market efficiency - Adam Smith’s invisible hand +
Takes all the information about buyers and sellers into account. +
Guides everyone in the market to the best outcome. + Economic efficiency. - Free markets:
Best way to organize economic activity.
**Market efficiency & market failure - Forces of supply and demand
Allocate resources efficiently. -
Assumptions about how markets work +
(1) Markets are perfectly competitive +
(2) Outcome in a market matters only to the buyers and sellers in that market. -
When these assumptions do not hold
“Market equilibrium is efficient” may no longer be true. - Market failures +
Market power: a single buyer or seller (small group) control market prices. ● Markets are inefficient. +
Externalities: decisions of buyers and sellers affect people who are not
participants in the market at all. ●
Inefficient equilibrium - from the standpoint of society as a whole. ⇒ SUMMARY: -
Consumers surplus: buyers’ willingness to pay for a good minus the amount they actually pay +
Measures the benefit buyers get from participating in a market. +
Area below the D curve and above P. -
Producer surplus: amount sellers receive for their goods minus their costs of production +
Measures the benefit sellers get from participating in a market. +
Area below P and above the S curve. -
An allocation of resources that maximizes total surplus is said to be efficient
Policymakers are concerned with the efficiency, as well as the equality, of economic outcomes. -
Equilibrium of S and D maximizes total surplus
The invisible hand of the market place leads buyers and sellers to allocate resources efficiently. -
Markets do not allocate resources efficiently in the presence of market failures
(market power or externalities)
Chapter 8: Application The Costs of Taxation (self- learning)
Chapter 9: Application International Trade (self- learning) Chapter 10: Externalities **Externalities -
‘Markets are usually a good way to organize economy activity’.
In absence of market failures, the competitive market outcomes is efficient, maximizes total surplus. -
Externality: one type of market failure
The uncompensated impact of one person’s actions on the well-being of a bystander. - Negative externality
Impact on the bystander is adverse. - Positive externality
Impact on the bystander is beneficial. -
Self-intered buyers and sellers +
Neglect the external costs or benefits of their actions. +
So the market outcome is not efficient. -
Government action can sometimes improve upon market outcomes’ +
Why markets sometimes fail to allocate resources efficiently. +
How government policies can potentially improve the market’s allocation. +
What kinds of policies are likely to work best. -
Examples of negative externalities + Air pollution from a factory. + The neighbor’s barking dog. +
Late-night stereo blasting from the dorm room next to yours. +
Noise pollution from construction projects. +
Health risk to others from second-hand smoke. +
Talking on cell phone while driving makes the roads less safe for others. - Internalizing the externality: +
Altering incentives so that people take into account the external effects of their actions. +
In our example, the $1/ gallon tax on sellers makes sellers’ costs = social costs. -
If market participants pay social costs
Market equilibrium = social optimum. -
Examples of positive externalities +
Being vaccinated against contagious diseases protects not only you, but
people who visit the salad bar or produce section after you. +
Research and development creates knowledge others can use. +
People going to college raise the population’s education level, which reduces crime and improves government. - With a positive externality
The social value of a good includes +
Private value - the direct value to buyers +
External benefit - the value of the positive impact on bystanders -
The socially optimal Q maximizes welfare +
At any lower Q, the social value of additional units exceeds their cost. +
At any higher Q, the cost of the last unit exceeds its social value.
**Effects of Externalities: Summary - If negative externality
Market quantity larger than socially desirable - If positive externality
Market quantity smaller than socially desirable -
To remedy the problem, “internalize the externality” +
Tax goods with negative externalities +
Subsidize goods with positive externalities
**Public Policies Toward Externalities - Command-and-control policies Regulate behavior directly +
Limits on quantity of pollution emitted +
Requirements that firms adopt a particular technology to reduce emissions - Market-based policies
Incentives so that private decision makers will choose to solve the problem on their own + Corrective taxes and subsidies + Tradable pollution permits - Corrective taxes and subsidies +
Corrective taxes (Pigovian taxes) +
Induce private decision makers to take account of the social costs that arise from a negative externality +
Places a price on the right to pollute +
Reduce pollution at a lower cost to society +
Raise revenue for the government + Enhance economic efficiency
**Corrective taxes vs. Regulations - Different firms
Have different costs of pollution abatement - Efficient outcome
Firms with the lowest abatement costs reduce pollution the most - A pollution tax is efficient +
Firms with low abatement costs will reduce pollution to reduce their tax burden +
Firms with high abatement costs have greater willingness to pay tax -
Regulation requiring all firms to reduce pollution by a specific amount Is not efficient -
Corrective taxes are better for the environment +
The corrective tax gives firms incentive to continue reducing pollution as long
as the cost of doing so is less than the tax. ●
If a cleaner technology becomes available, the tax gives firms an incentive to adopt it. +
In contrast, firms have no incentive for further reduction beyond the level specified in a regulation. [Slides] Chapter 11: (self-learning) Chapter 12: (self-learning)
Chapter 13: The Costs of Production -
We assume that the firm’s goal is to maximize profit. -
‘The cost of smt is what you give up to get it’ - OC - Explicit costs
Require an outlay of money (e.g. paying wages to workers) - Implicit costs
Do not require a cash outlay (e.g. the opportunity cost of the owner’s time) -
Total cost = Explicit + Implicit costs - Accounting profit (AP)
= total revenue minus total explicit costs - Economic profit (EP)
= total revenue minus total costs (including explicit and implicit costs) -
Accounting profit ignores implicit costs, so it’s higher than economic profit. **Production function - Relationship between +
Quanitty of inputs used to make a good +
And the quantity of output of that good -
Gets flatter as production rises **Marginal product - Marginal produc (MP) +
Increase in output that arises from an additional unit of input Other [slides] +
Slope of the production function - [slides] **Diminishing MPL - Diminishing marginal product +
Marginal product of an input declines as the quantity of the input increases +
Production function gets flatter as more inputs are being used:
The slope of the production function decreases **Why MPL is important? -
Rational people think at the margin’ -
When Farmer Jack hires an extra worker +
His costs rise by the wage he pays the worker + His output rises by MPL +
Comparing them helps Kack decide whether he should hire the worker **Why MPL diminishes? -
Farmer Jack’s output rises by a smaller and smaller amount for each additional worker. Why? + As Jack [slides] + [slides] **Marginal cost - Marginal cost (MC) +
Increase in total cost arising from an extra [slides] + [slides]
Tài liệu liên quan:
-
TOPIC: COSMETICS môn Kinh tế vi mô | Trường Đại học Kinh tế Quốc dân
5 3 -

Sách Bài Tập Vi Mô - Hướng Dẫn và Lời Giải Chi Tiết
11 6 -

Nguyên lý chiến lược kinh doanh - Bài giảng môn Kinh tế vi mô | Trường Đại học Kinh Tế Quốc Dân
13 7 -

Chương 7 các kỹ thuật lựa chọn chiến lược - Bài giảng môn Kinh tế vi mô | Trường Đại học Kinh Tế Quốc Dân
14 7 -
Tổng hợp câu hỏi trắc nghiệm theo chương ôn tập môn Kinh tế vi mô | Trường Đại học Kinh Tế Quốc Dân
18 9