Microeconomics Week 3 Assignment: Housing Market Analysis môn Kinh tế vi mô | Trường Đại học Kinh Tế Quốc Dân
Hurricane Katrina destroyed much of New Orleans’ housing, forcingmany residents to move to Baton Rouge. As the city’s population grew sharply. Tài liệu giúp bạn tham khảo, ôn tập và đạt kết quả cao. Mời đọc đón xem!
Môn: Kinh tế vi mô ( NEU ) 762 tài liệu
Trường: Trường Đại học Kinh Tế Quốc Dân 7.6 K tài liệu
Tác giả:

Preview text:
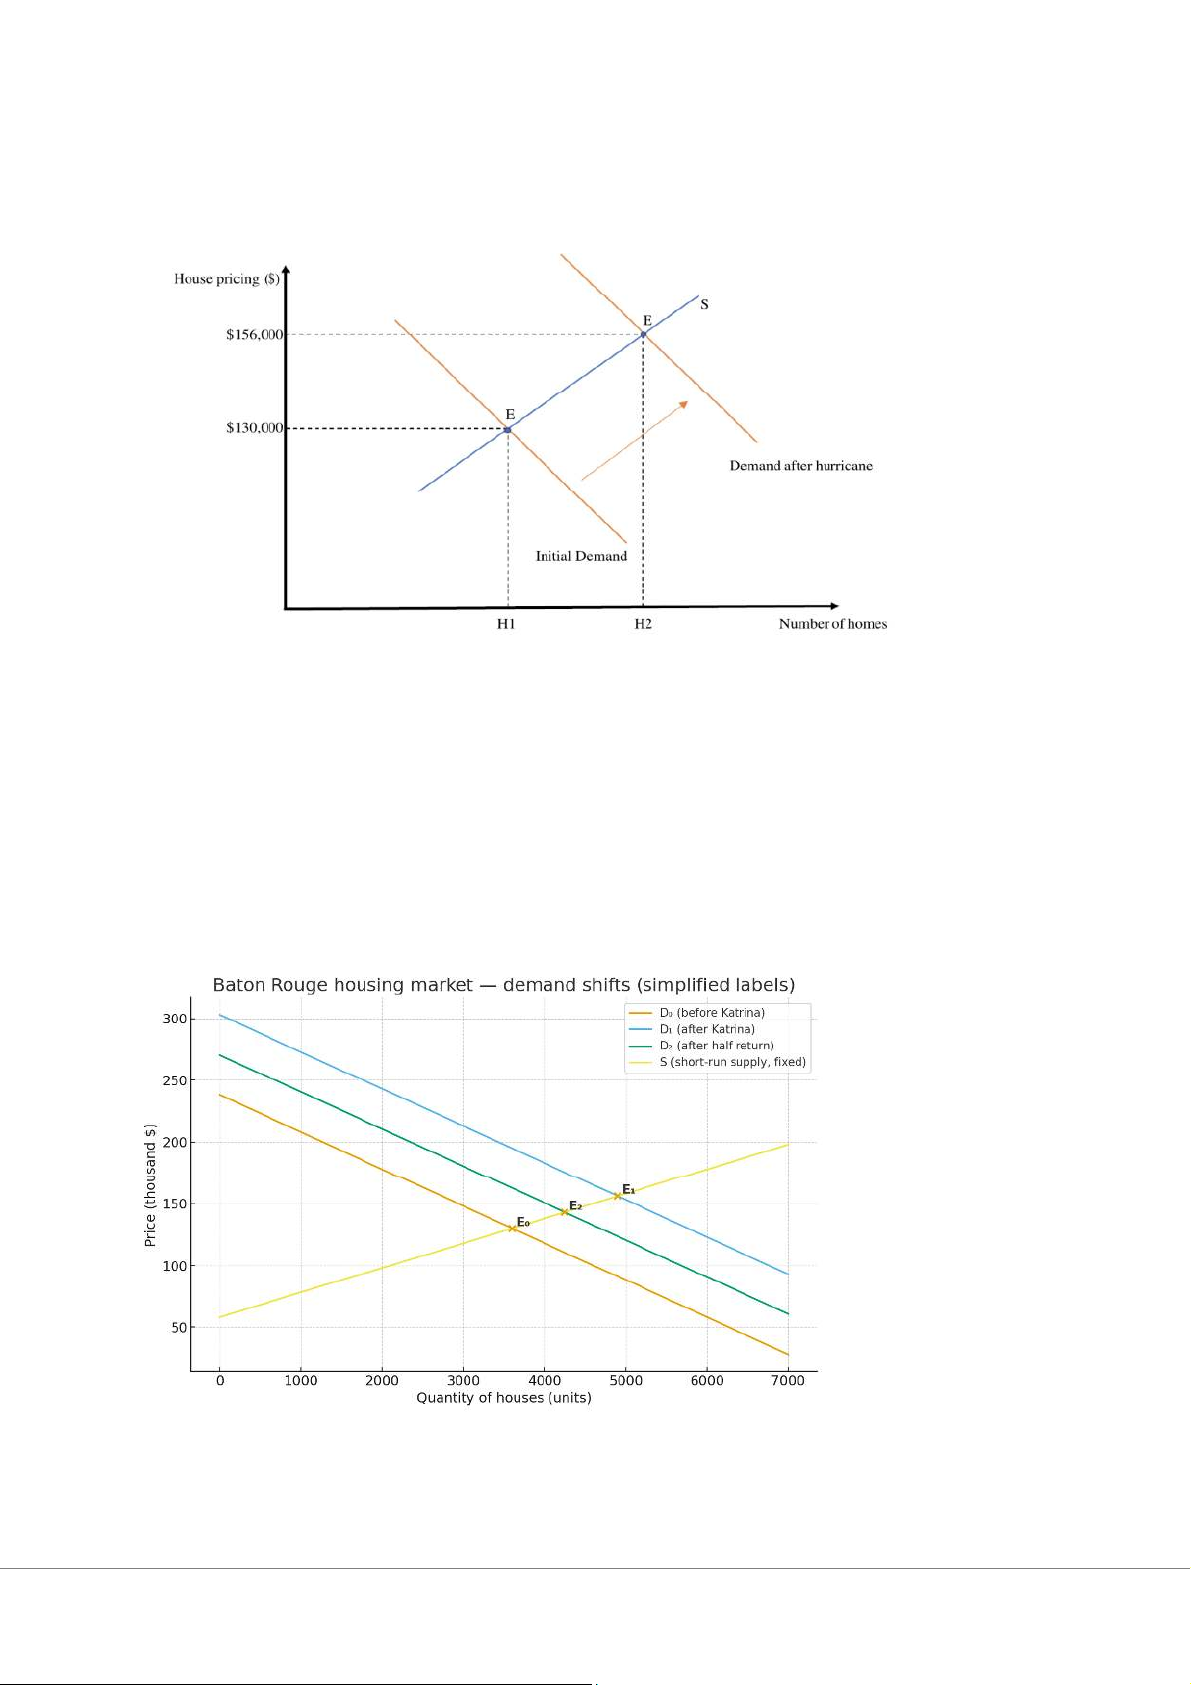
Case 1 1, Graph Explanation
Hurricane Katrina destroyed much of New Orleans’ housing, forcing many residents to move to
Baton Rouge. As the city’s population grew sharply, housing demand increased, shifting the demand
curve to the right. Meanwhile, the number of homes available for sale dropped from 3,600 to just
500, creating a housing shortage. As a result, according to the law of demand and supply, the
average price surged by $26,000 ( from $130,000 to $156,000 within six months). 2, Graph
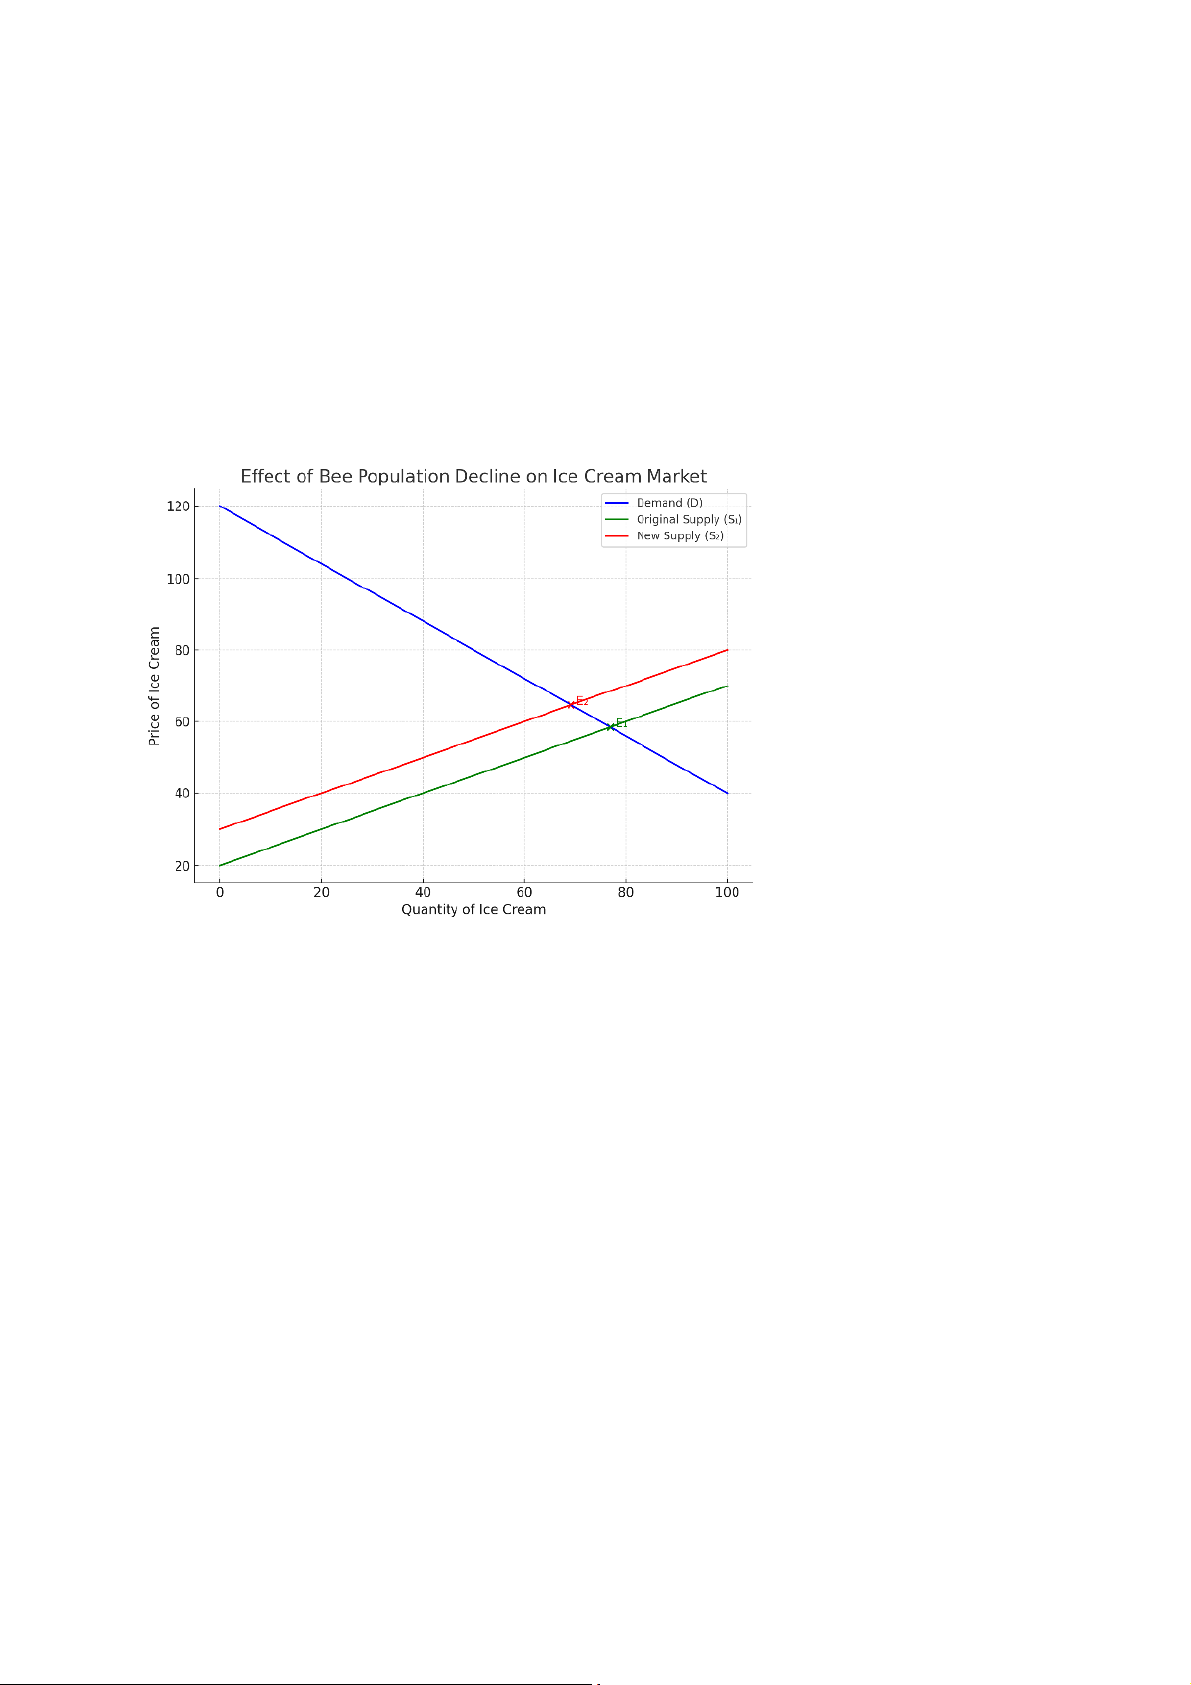
Five years after Hurricane Katrina, when half of the people who moved to Baton Rouge return to
New Orleans, the demand for housing in Baton Rouge decreases. On the graph, the demand curve
shifts left from D₁ to D₂, while the supply curve stays the same. As a result, both the price and the
number of houses sold decrease compared to right after the hurricane. However, the price and
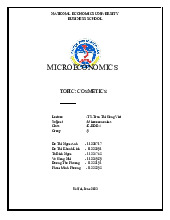
quantity are still higher than before Katrina because many people still live in Baton Rouge. Case 2: Graph Explanation
The decline in the bee population reduces pollination, which decreases the supply of strawberries,
raspberries, and nuts — key ingredients for ice cream. As the supply of these inputs decreases, their
prices increase. This leads to higher production costs for ice cream producers. As a result, the
supply curve for ice cream shifts to the left (decreases). This shift causes the equilibrium price of ice
cream to rise and the equilibrium quantity to fall. Consumers face higher prices, and producers
supply less ice cream in the market.
Tài liệu liên quan:
-
TOPIC: COSMETICS môn Kinh tế vi mô | Trường Đại học Kinh tế Quốc dân
5 3 -

Sách Bài Tập Vi Mô - Hướng Dẫn và Lời Giải Chi Tiết
13 7 -

Nguyên lý chiến lược kinh doanh - Bài giảng môn Kinh tế vi mô | Trường Đại học Kinh Tế Quốc Dân
13 7 -

Chương 7 các kỹ thuật lựa chọn chiến lược - Bài giảng môn Kinh tế vi mô | Trường Đại học Kinh Tế Quốc Dân
14 7 -
Tổng hợp câu hỏi trắc nghiệm theo chương ôn tập môn Kinh tế vi mô | Trường Đại học Kinh Tế Quốc Dân
18 9