Mousetrap Cars Guide for Engineering Students - Tài liệu Nghiên cứu khoa học | Trường Đại học Kinh tế, Đại học Quốc gia Hà Nội
Mousetrap Cars Guide for Engineering Students - Tài liệu Nghiên cứu khoa học | Trường Đại học Kinh tế, Đại học Quốc gia Hà Nội. Tài liệu được sưu tầm giúp bạn tham khảo, ôn tập và đạt kết quả cao. Mời bạn đọc đón xem.
Môn: Nghiên cứu khoa học (UEB) 5 tài liệu
Trường: Trường Đại học Kinh tế, Đại học Quốc gia Hà Nội 491 tài liệu
Tác giả:

Preview text:
What is a Mouse-Trap Car and How does it Work?
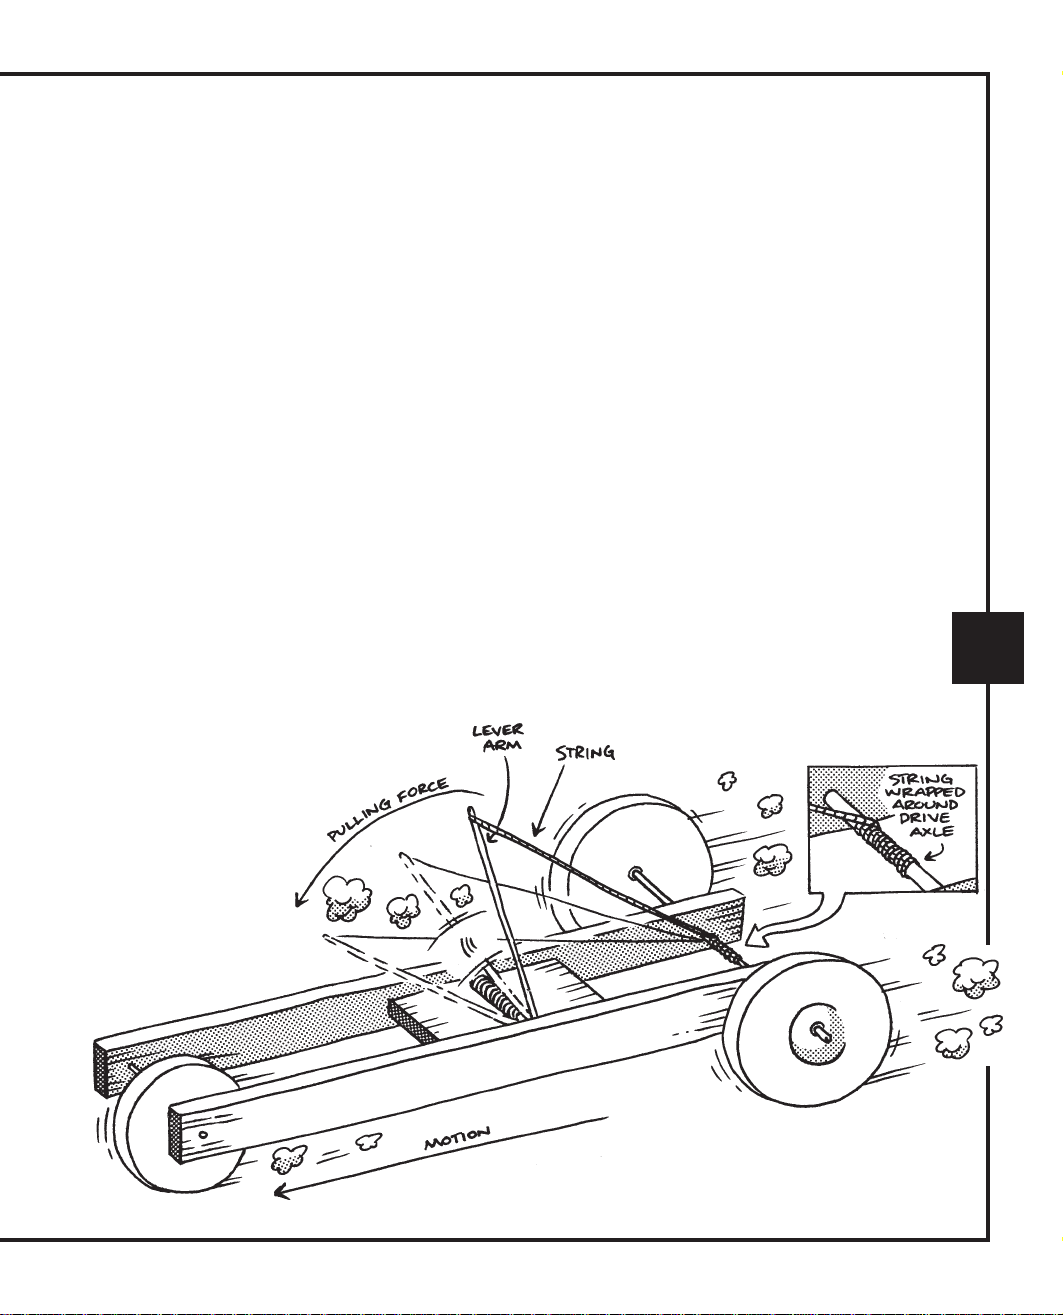
A mouse-trap car is a vehicle that is powered by the energy that can be stored in a
wound up mouse-trap spring. The most basic design is as follows: a string is
attached to a mouse-trap’s lever arm and then the string is wound around a drive
axle causing the mouse-trap’s spring to be under tension. Once the mouse-trap’s
arm is released, the tension of the mouse-trap’s arm pulls the string off the drive
axle causing the drive axle and the wheels to rotate, propelling the vehicle. This
most basic design can propel a vehicle several meters for any first-time builder.
But in order to build vehicles that can travel over 100 meters or extreme
speed cars that can travel 5 meters in less than a second, you
must learn about some of the different variables that affect the performance of a
mouse-trap car. For example, how does friction affect the overall distance that a
vehicle can travel? How does the length of the mouse-trap’s lever arm affect the 1
performance? By reading each section of this book you will learn about many of
the different variables that will affect a vehicle’s performance. Also you will learn how to modify different variable in order to build a top p e r f o r m i n g vehicle. Get Getting Started Started!
Why build a mouse-trap car? Building mouse-trap cars
allows you to experience the process of design and engineering first-hand.
When you build a vehicle, you have to start with an ideas and then turn that
idea into a real-life model that works. Building a mouse-trap car is an
advanced form of problem solving with two main ingredients:
1. You don’t know what the problems are. Many
of the problems in building a mouse-trap car will be discovered and
solved as you go along; each person’s challenges will be different.
2. There is never one right answer!
One last thought before we get started. Throughout the construction of
your car, you will have to deal with tradeoffs. For example, building a car
that accelerates quickly usually means sacrificing fuel efficiency. When
applying any of the ideas and hints in this book to the construction of a 2
mouse-trap car, understand that any extreme exaggeration of just one varible
may have a large negative effect on the performance of your vehicle. It is
best to find a harmonious balance between each varible through
repeated experimentation. Experimentation is essential in order to
achieve maximum performance. Experiment often and early, don’t worry
about making mistakes! Making a mistake is alearning experience. Keep in
mind you will not know many of the problems until you encounter them as
you build your car. Engineering is a process by which ideas are tested and
re-tested in an effort to produce the best working product. A good engineer
knows one way to get something to work and 99 ways it won’t work. Do
not be afraid to try your different ideas; your tested ideas will lead
you to success! Also, by understanding the basic conceptual physics
concepts presented in this book, you will be able to make good decisions
about building the perfect car. Don’t delay, get started! Getting Started
Almost any materials can be used in the construction of a good mouse-trap
car. It is up to the designer to determine the appropriate application of such
materials. Sizes, lengths, diameters, widths, and kinds of materials are more-
or-less left up to the designer. The human imagination is a wonderful gift,
and our own ingenuity allows us to take ordinary objects
with functions different from what were intended and turn them into components of a working machine. For example, a
compact disc is a good device for
storing information and playing it
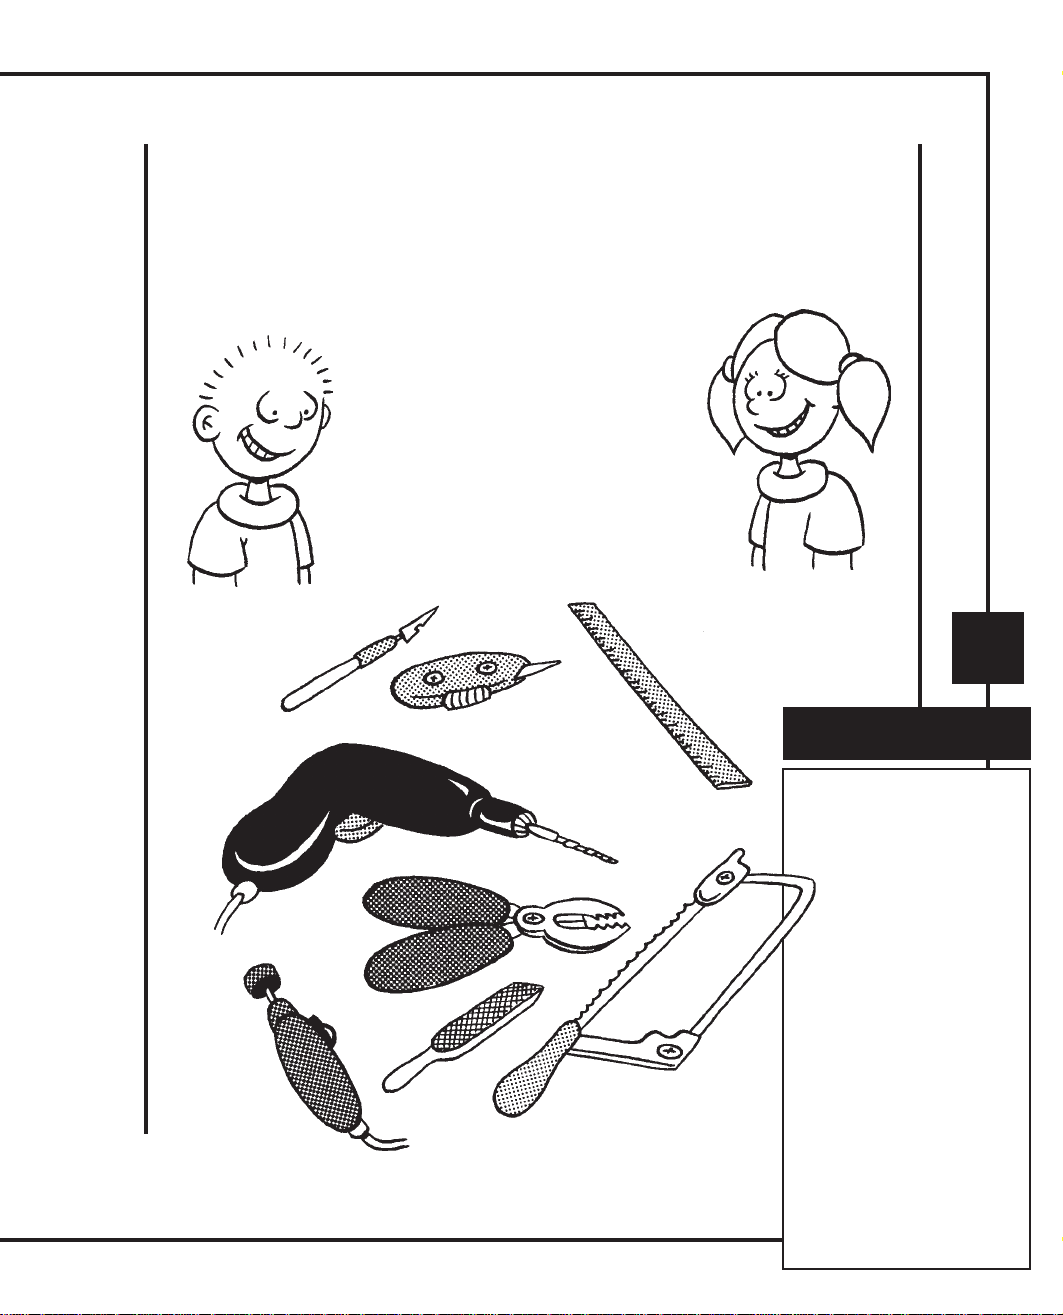
back, but it also makes a great wheel. Good luck! 3 Tools of the Trade • Dremel Tool • Hobby Knife • Files - Round - Square - Knife • Power Drill • Drill Bits • Glue - Super Glue - Wood Glue - Hot Glue - Rubber Cement • Coping Saw or Getting Started Hack Saw • Pliers Motion
Motion occurs all around us yet it is hard to describe and explain. More
than 2000 years ago the Greeks try to describe motion but failed because
they did not understand the concept of rate of change. Today we
describe motion as rates of change or some quantity divided by time.
Speed is the measure of how fast something is traveling or the rate at which
distance is being covered, another way of describing speed is to say that it is
the distance that is being covered per time where the word per means
divided by. In most cases, when you calculate the speed of a mousetrap
racer you get an average speed over some distance, you begin timing
at some predetermined starting point and then you stop timing at some
predetermined ending point. This method does not tell you the
instantaneous speed of your vehicle along any point of its motion
it only tells you the average speed over your timing distance. In
everyday conversations we tend to use the words speed and velocity
interchangeably but it needs to be pointed out the speed and velocity are 4
slightly different. Unlike speed velocity tells you direction; example, to say
an objet is traveling at 55 mi/h is to give the objects speed only, to say an
object is traveling at 55 mi/h due north is to give the object velocity. By
adding the direction of an object motion we change it from speed to velocity.
Why is this small distinction of direction important in the study of motion?
If the velocity of an object is changing then there is another way to describe
the objects motion and it is called acceleration, the rate at which
velocity is changing. Velocity is changing when any of the following
conditions occurs, there is a change in speed, or there is a change
in direction. A car traveling in a circle at a constant speed has a changing
direction so even though its speed is constant its direction is not, so it is
accelerating. Acceleration is something you can feel, when
you step on the gas pedal or break pedal in a car you feel yourself accelerate.
Also, when you turn the steering wheel of a car you change your direction
and you feel acceleration so we say that accelerations are changes in speed and direction. Motion Lab #1 - Chasing the Mouse EXPERIMENT Purpose
To analyze the motion of a mousetrap powered vehicle over 5 meters. Equipment Needed Ticker Timer Ticker Tape Meter Stick Stopwatch Discussion
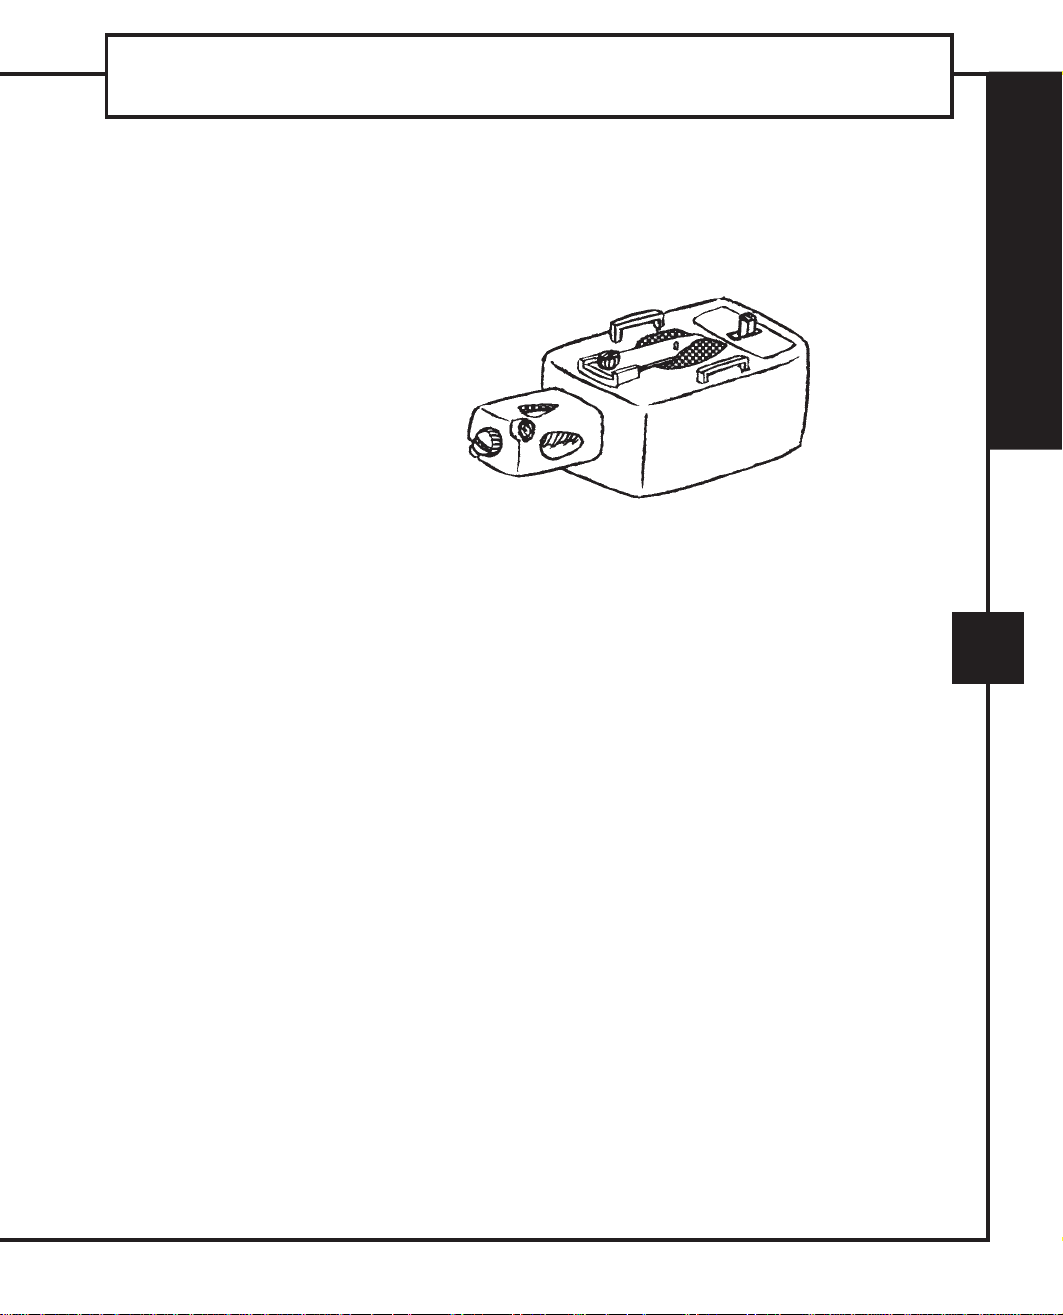
In this experiment you will collect data from your mousetrap car using a
ticker timer. A ticker timer is a device that makes marks on a ticker tape at
equal intervals of time. A long piece of ticker tape will be attached to the
back of your mousetrap vehicle. As your vehicle is in motion the ticker 5
timer will leave a series of marks on the tape that is attached to your vehicle.
Because the time between each mark is the same, a variety of variables can
be measured and calculated from the position of each mark. I recommend
analyzing the motion of your car over a five meter distance. After your
vehicle has made its run, you will be measuring the distance from the first
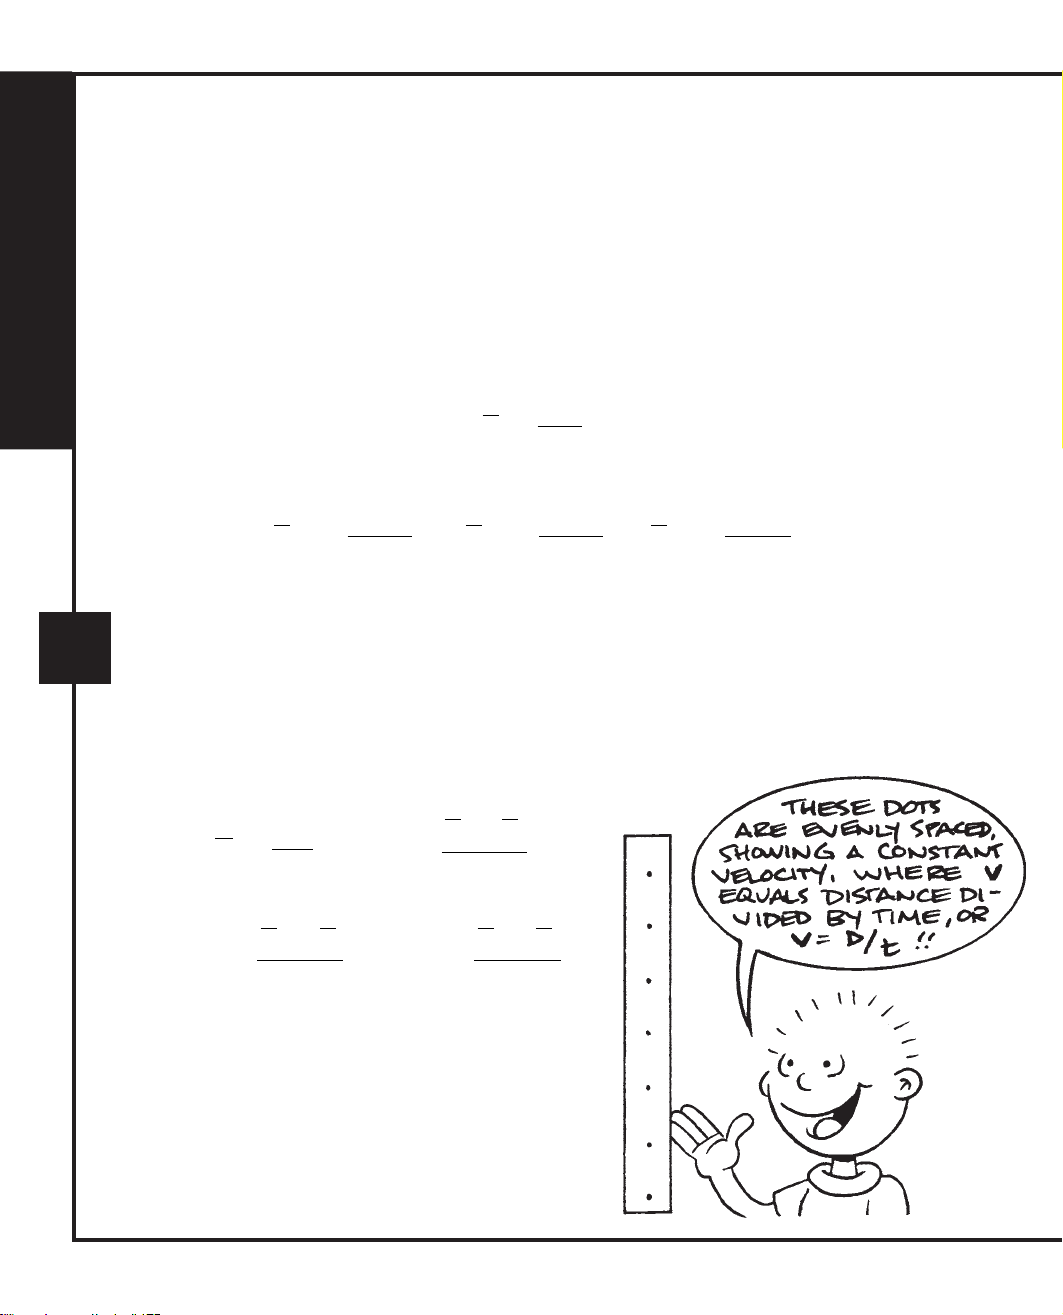
mark to each of the following marks. Velocity is the rate at which your
vehicle is covering distance. The greater the rate, the more distance that is
being covered per time. The average velocity is the travel distance divided
by the travel time. The actual velocity at each mark is calculated from the
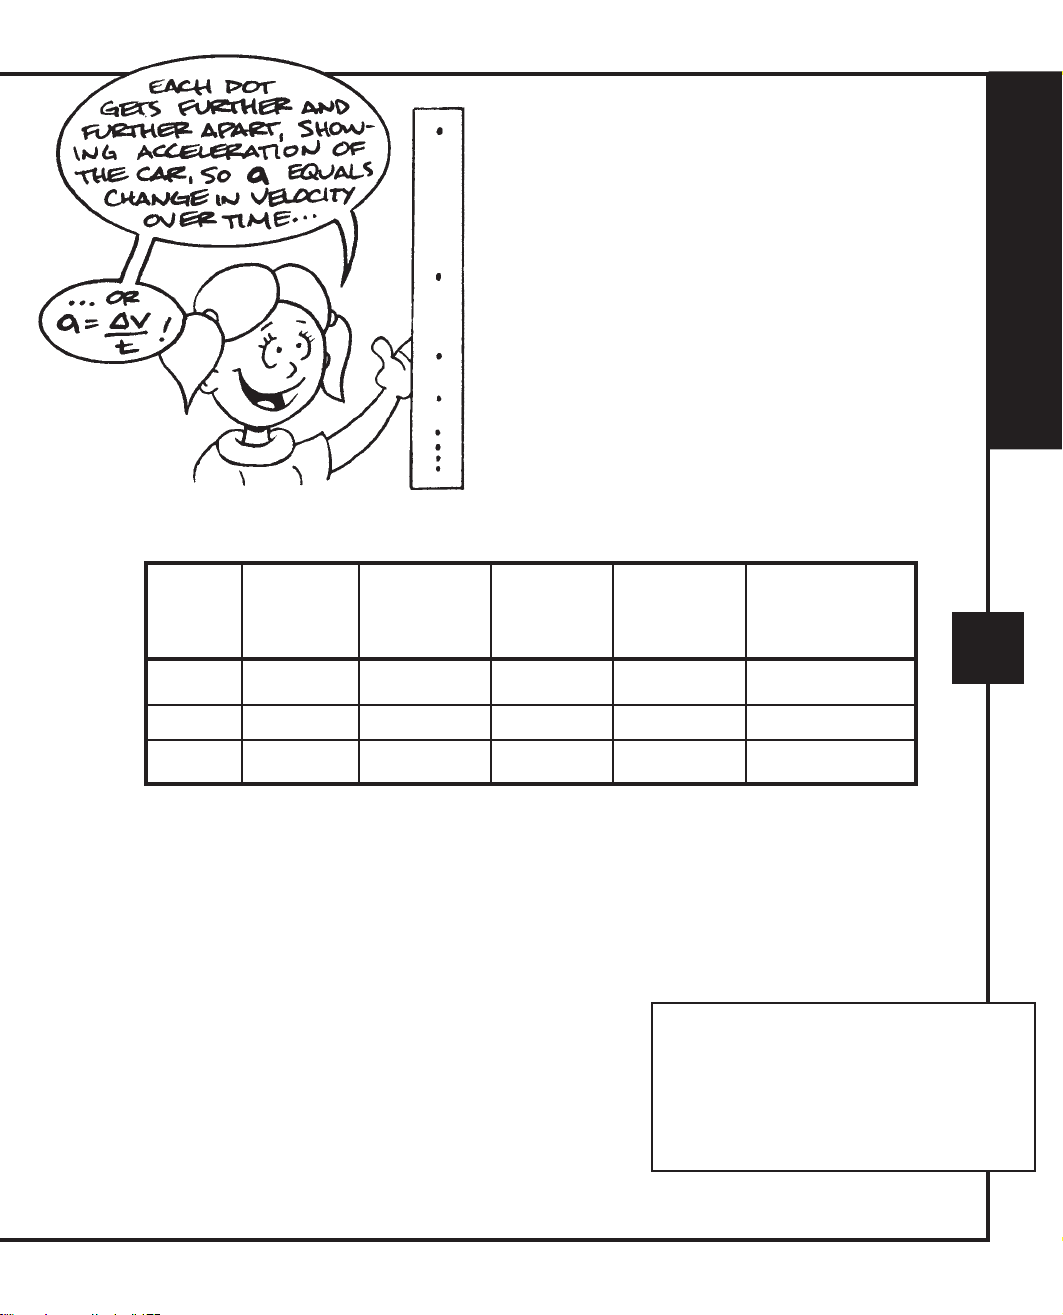
average velocity by using Formula #2 from the list of formulas. Acceleration
is the rate at which your vehicle is changing velocity. In order to find the
acceleration you will have to first find the change in velocity between each
point using Formula #3. By dividing the change in velocity for each interval,
you will calculate the acceleration between each mark (Formula #4). Motion What it All Means d = distance v Formulas = velocity t = time a =acceleration ∆d d − d t t Formula #1: v = v f = 0 ∆t ∆t EXPERIMENT ∆v v − v t f to Formula #2: a = a = ∆t ∆t
Using a Stopwatch: Alternative Approach 6
I suggest timing the vehicle over 5 meters if you plan on
using a ticker timer, but if you have a long-distance
car that travels great distances, you should not use
the ticker timer because the vehicle will become
too heavy by pulling of the long ticker tape. You
can collect data with an alternative approach: Mark
out the floor with masking tape every meter or two
meters, depending on the distance that your car will go.
Using a stopwatch that can handle split times, walk along side your
mousetrap car and call out the time at each mark on the floor. A partner
should be recording the times as you relay them using the split-time
function. Calculations are the same, but realize that in this example
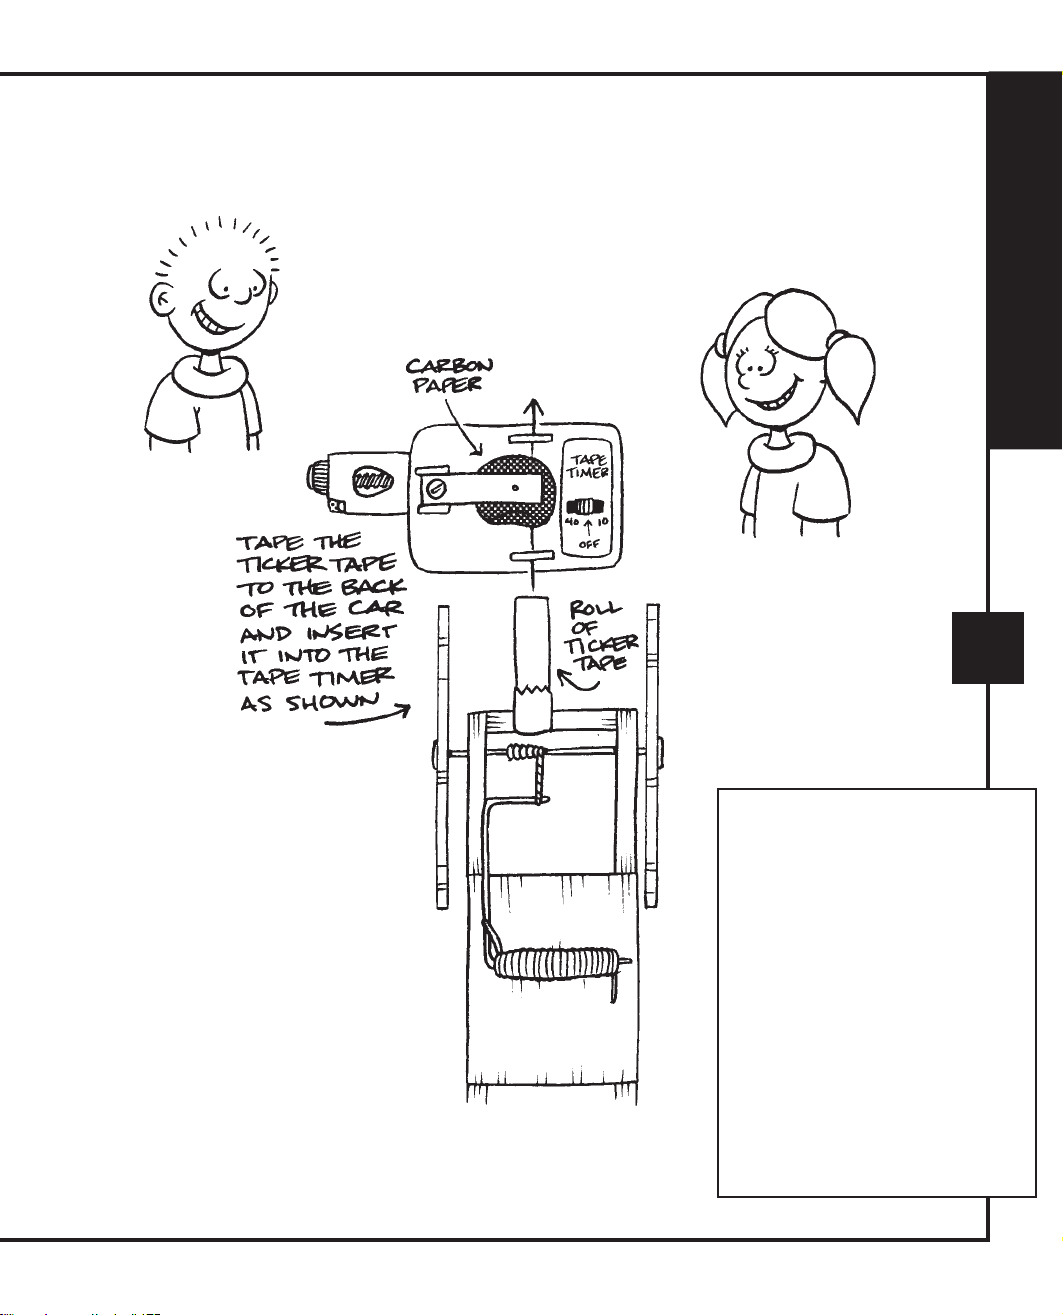
the distance was held constant and not the time. Please take note: It is assumed that the experimenter uses Motion standard S.I. units for all activities. EXPERIMENT The Set-up 7 Label one end of the tape as the front. Thread the ticker tape through the timer and attach the front of the tape to the rear of the car using a small piece of tape. Position the tape such that the tape does not get tangled with your vehicle’s operations during the timing. Motion Ticking Away the Time
Step 1: Determine the distance for which the data will be collected.
Tear off enough ticker tape to cover the distance of the timing.
Step 2: Select or determine the frequency of the ticker timer. The
frequency of the ticker tape determines the time between each mark. If the
frequency is 10Hz, the time between marks is 0.1s. If the frequency is EXPERIMENT
60Hz, the time between marks is 1/60 s. Record this frequency in your data table under “time.”
Step 3: Label one end of the tape as the front. Thread the ticker tape
through the timer and attach the front of the tape to the rear of the car using
a small piece of tape. Position the tape such that the tape does not get
tangled with your vehicle’s operations during the 8 timing.
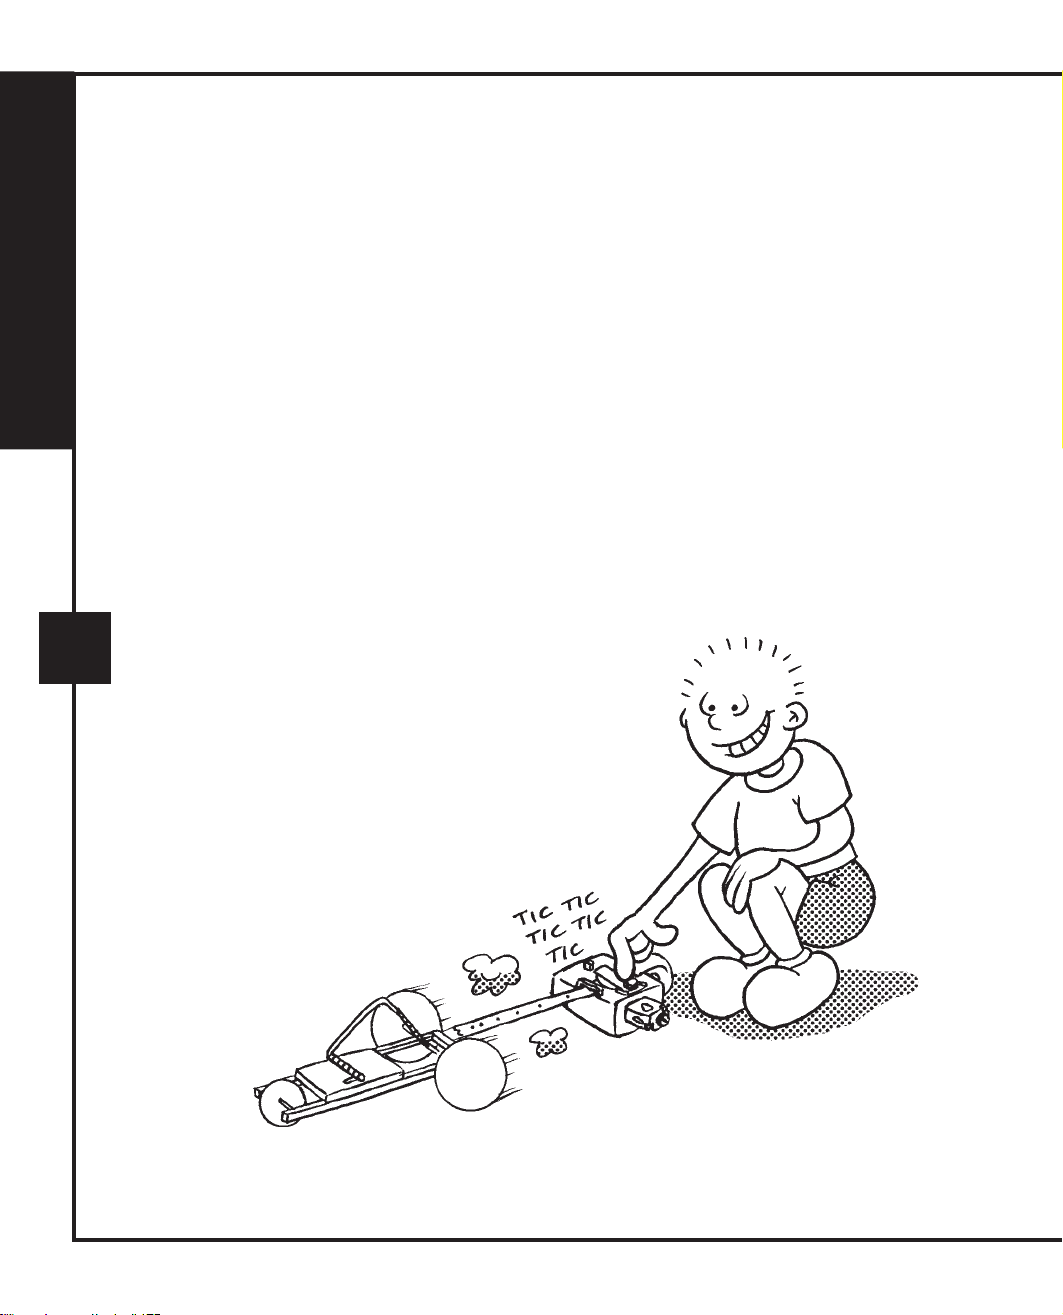
Step 4: Place your vehicle at the start line.
Line up the ticker timer directly behind the
vehicle tape. Straighten the ticker tape
behind the timer so that is passes through
the timer without binding. Turn the
ticker timer on and then release the vehicle. Remove the tape from the vehicle after the run. Motion EXPERIMENT
Step 5: From the front of the ticker
tape, darken each mark and label as
follows: t0, t1, t2, t3, t4, t5, …tn.
Step 6: Design a data table where you
can record the following: total time (t),
distance between marks (∆d), total
distance (d), velocity at mark (vf), change
in speed from previous mark (∆v),
acceleration between marks (a). Data Table #1 Total Change Change in Total Change in Acceleration Time in Time Distance Distance Velocity 9 t1= t0,1= ∆d0,1= d1= vf,1= a0,1= t2= t1,2= ∆d1,2= d2= vf,2= a1,2= t3= t2,3= ∆d2,3= d3= vf,3= a2,3=
Step 7: Measure the distance from the first mark (t0) to the second mark
(t1) and record this as (t0,1) distance between marks (∆ d ). Measure the 0,1
distance from the second point to the third mark and record this as t2 distance
between marks (∆ d ). Measure the distance between each of the following 1,2
marks and record as the distance between marks (∆d2,3, ∆d3,4, ∆d4,5 …∆dn). Step 8: Recommendations
Add the change in distance between d
Try to set-up a spread sheet on
0,1 and record as d1 total distance. Add the change in distance between d
a computer in order to handle 0,1 and d1,2 and
your data more efficiently. Motion
d1,2 and record as d2 total distance. Add the total distance between d1,2 and
d2,3 and record as d3 total distance. Continue this approach until you have
the total distance from each mark to the first point.
Step 9: From equation #1 find the average change in velocity between
each point or mark on your ticker tape using the following equation: EXPERIMENT ∆d v = ∆t ∆d ∆d ∆d v 0 1 , = 1,2 2 ,3 , v = , v = 0 1 , ∆t 1,2 ∆t 2 ,3 ∆t 0 1 , 1,2 2 ,3 10
Record as change in velocity at mark v0,1, v1,2, v2,3, …vn.
Step 10: Calculate the acceleration using formula #2 and record as follows: ∆v v − v a = , a 1 0 = ∆t 01, ∆t0 1, v − v v − v a 2 1 = , a 3 2 = 1,2 ∆t 2 ,3 ∆t 1,2 2 ,3
Record as acceleration between marks as a0,1, a1,2, a2,3, …an. Motion EXPERIMENT Graphing the results
You will now graph your data in order to learn from your results. In each of
the following graphs attempt to draw a “best fit” line. If data is widely
scattered do not attempt to connect each dot but instead draw the best line
you can that represents the shape of the dots. If you have access to a computer
you can use a spread sheet like Microsoft Exel to plot your data.
1. Graph Total Distance on the vertical axis and Total Time on the horizontal.
2. Graph Velocity Final at each point on the vertical axis and Total Time on the horizontal.
3. Graph Acceleration on the vertical axis and Total Time on the horizontal. Analysis
1. Identify the time intervals where your vehicle had the maximum positive 11
and negative acceleration. Where did your vehicle have the most constant acceleration?
2. What was the vehicle’s maximum speed over the timing distance and at what point did this occur?
3. How far was your vehicle pulled by the string? From the graph is it
possible to determine when the string was no longer pulling the vehicle? Explain.
4. Compare your performance to the performance of other vehicles in the
class and discuss how yours relates. Motion Surface Friction
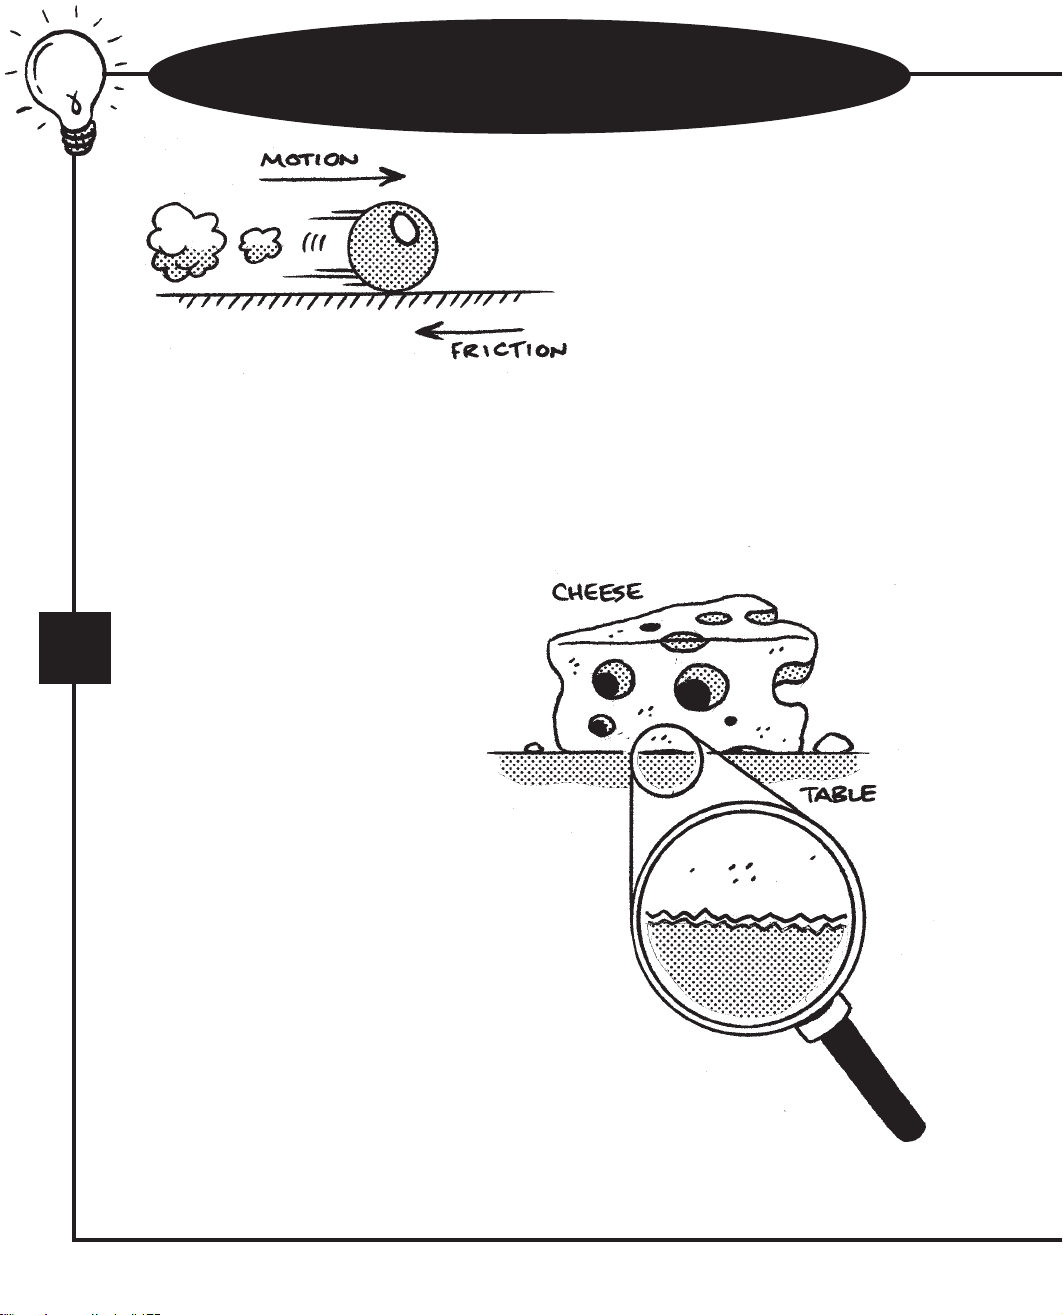
A ball rolling across the floor will eventually
slows to a stop. The reason the ball slows to a
stop is because of friction.
Friction is a force that always
opposes motion in a direction that
is opposite to the motion of the
object. An object that slides to the right experiences friction towards the left. If it
was not for friction, the ball would roll forever, as long as there was nothing—like
a wall—to stop its motion. Your mouse-trap car is affected by friction in the same
way as the rolling ball, friction will slow it to a stop. Friction will occur anytime
two surfaces slip, slide, or move against one another. There are two basic types of
friction—surface friction and
fluid friction. In some situations 12
fluid friction is called air resistance. A
ball falling through the air is
affected by fluid friction and a
block sliding on a table is mainly
affected by surface friction as well
as a little air resistance. The
greater the amount of friction between two
surfaces, the larger the force that will be
required to keep an object moving. In order
to overcome friction, a constant force is needed.
In order to maintain a constant force, there must
be a supply of energy. A ball which is given an
initial push will roll until all its energy is consumed by
friction, at which point it will roll to a stop. The smaller the forces Friction
of friction acting against a moving object (like a ball or mouse-trap car), the
farther it will travel on its available energy supply. Eliminating
all forms of friction is the key to success
no matter what type of vehicle you are building.
Surface friction occurs between
any two surfaces that touch or rub against one
another. The cause of surface friction is mutual
contact of irregularities between the touching surfaces. The irregularities act as
obstructions to motion. Even surfaces that appear to be very smooth are irregular
when viewed microscopically. Luckily, during motion surface friction is
unaffected by the relative speed of an object; even though the speed of an
object may increase, the force of surface friction will remain constant. This means 13
that the same force is required to slide an object at a slow or fast rate of speed on
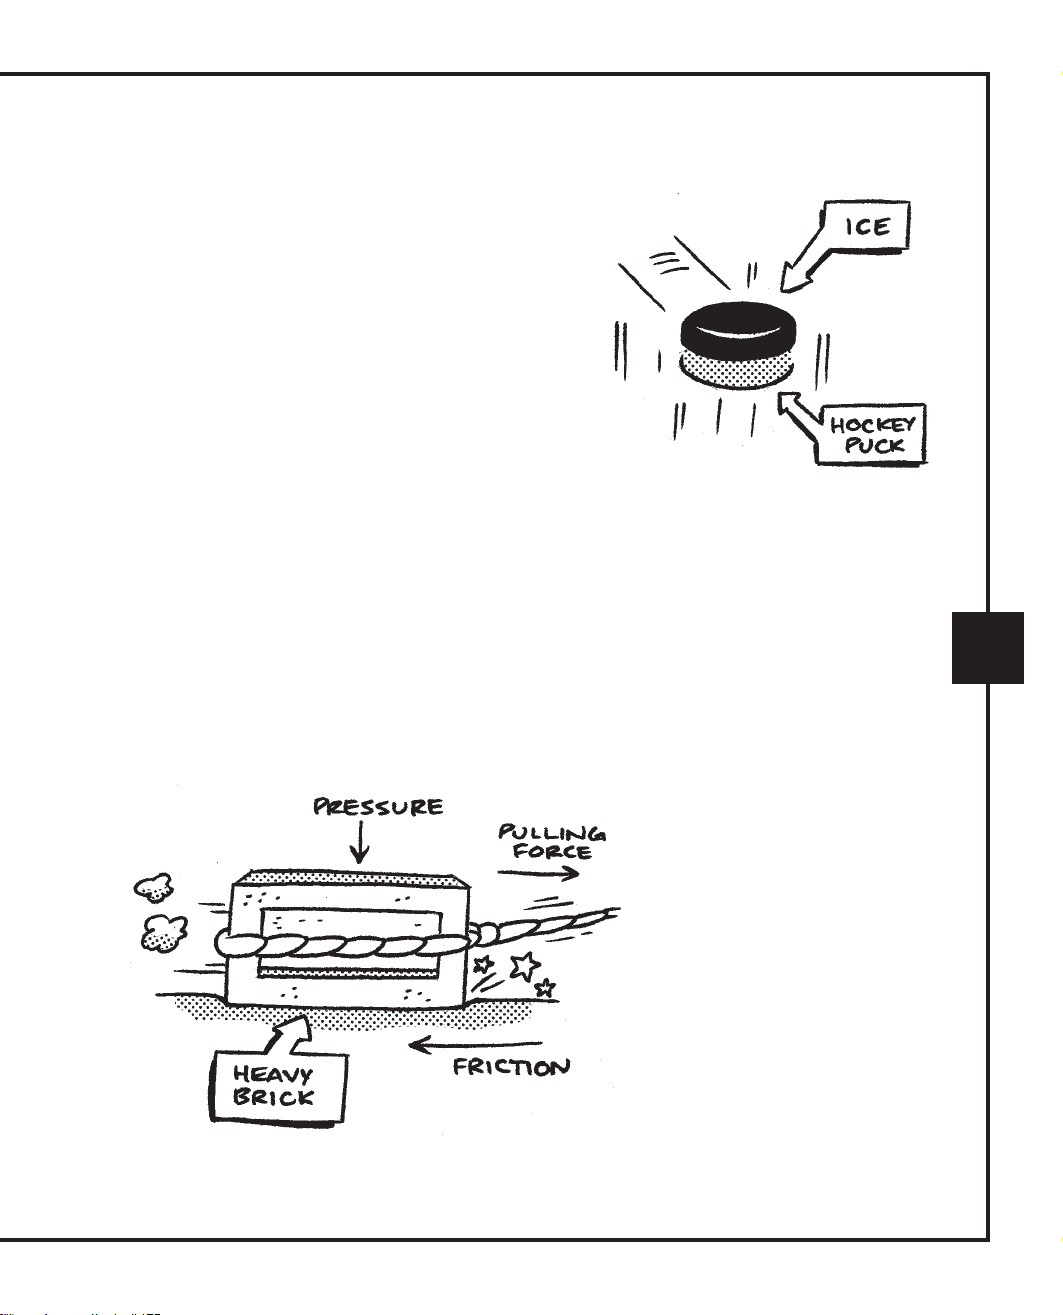
a given surface. The amount of friction acting between two surfaces depends
on the kinds of material from which the two surfaces are made and how
hard the surfaces are pressed together. Ice is more slippery than concrete;
therefore, ice has less friction
or less resistance to slippage. A heavier brick is harder to
push and has more friction than a lighter brick only because the heavier brick pushes into the
ground with more force or weight. Friction
Minimizing surface friction on a
mouse-trap car allows its wheels to spin
with less resistance, resulting in a car that
travels faster, farther and wastes less
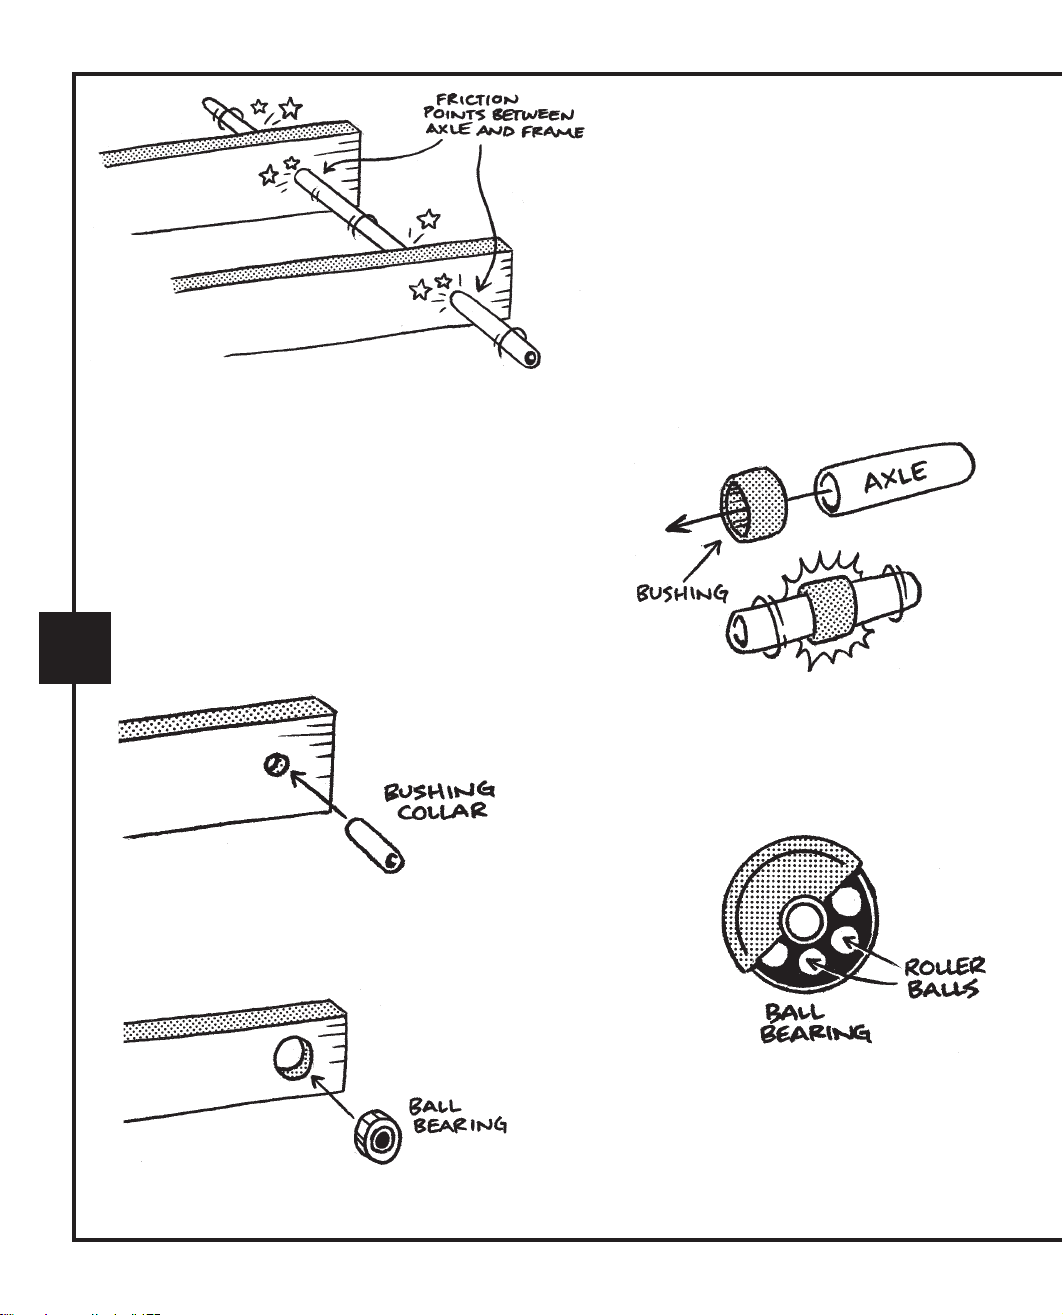
energy. The most common area
where surface friction will occur is
between the axle and the chassis.
The interface between the axle and the chassis is called the bearing.
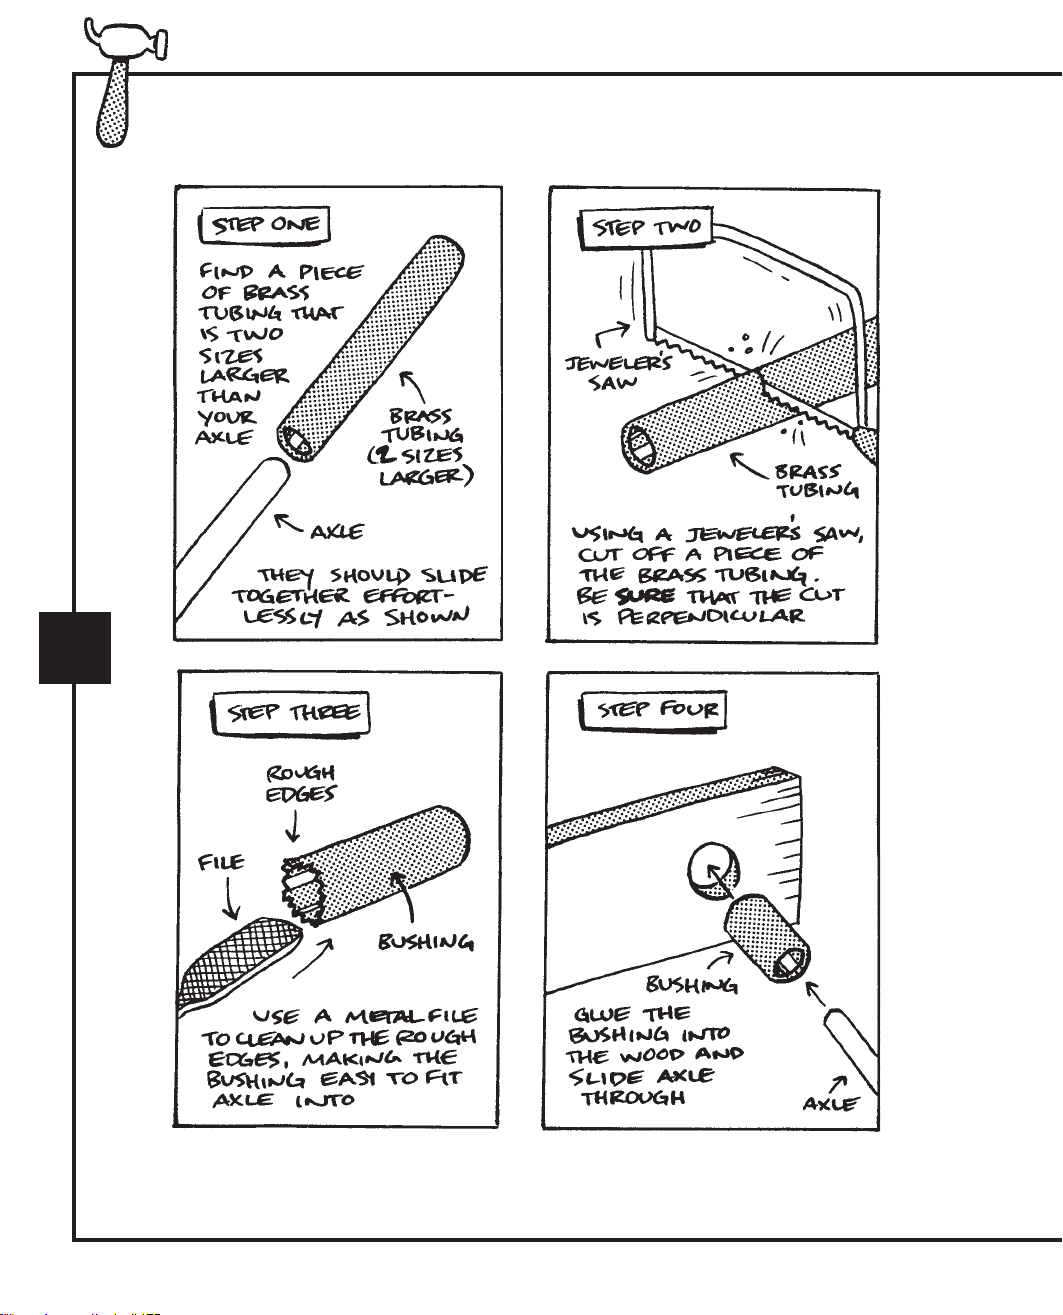
A plain bearing can be as simple as an axle
turning in a drilled hole. A bushing is a smooth
sleeve placed in a hole that gives the axle a smother
rubbing surface, which means less surface friction.
Some combinations of material should not be used
14 because they do not help the cause; for example,
avoid using aluminum as the axle or a bearing sleeve.
A ball bearing is a set of balls in the hole which
is arranged so that the axle rolls on the balls
instead of sliding in a sleeve. A r o l l i n g ball has very little friction; therefore, ball bearings usually provide the
best performance. Ball bearings have the least friction, but
they are the most expensive, so you must evaluate your budget
when thinking about ball bearings.
You can buy small ball bearings at
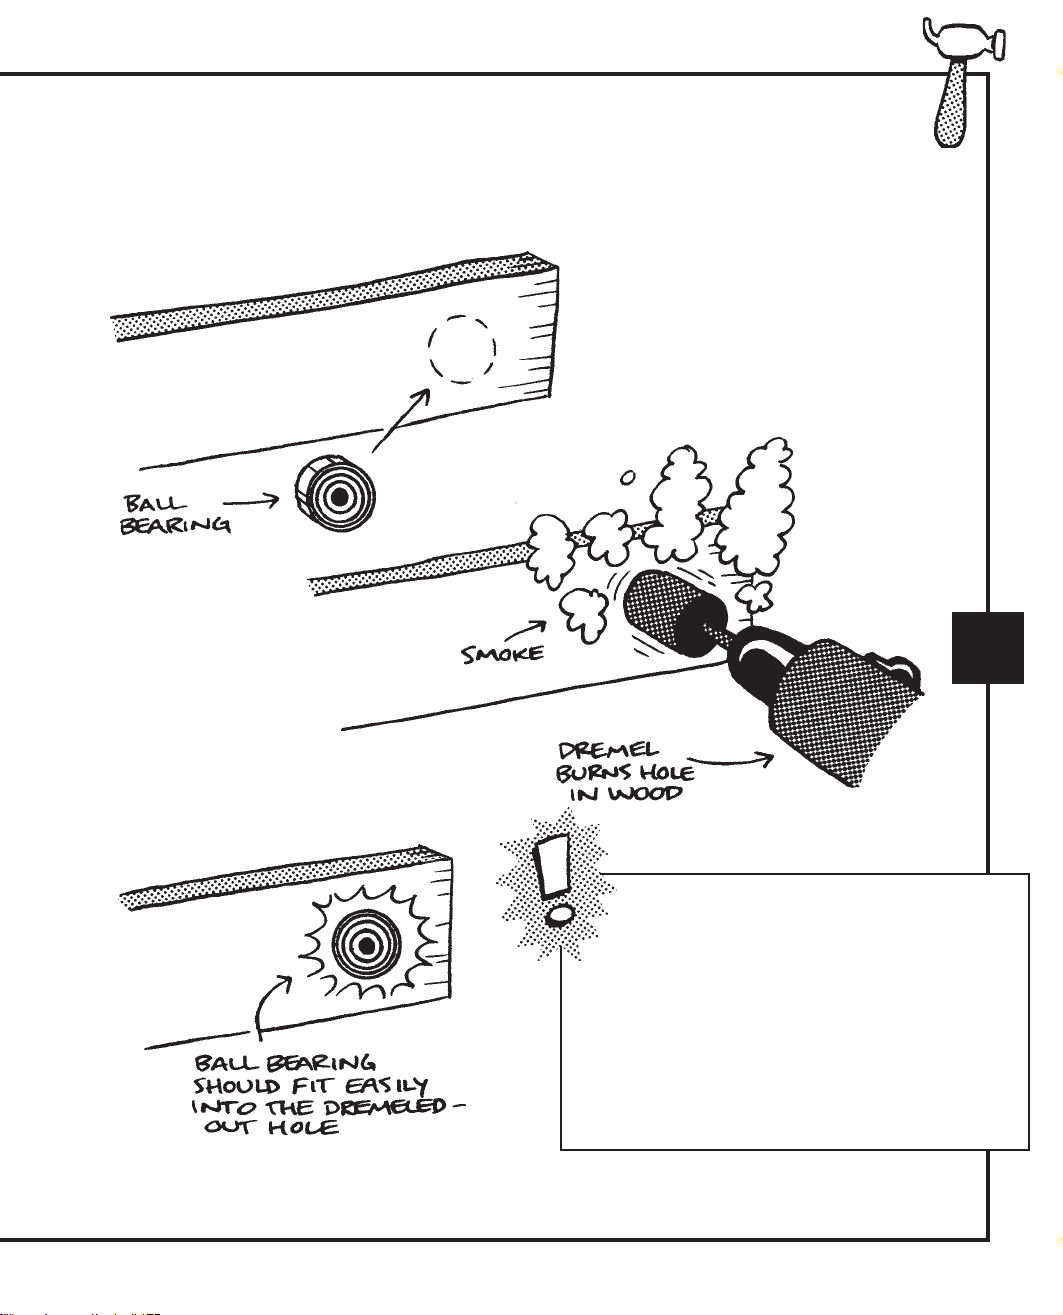
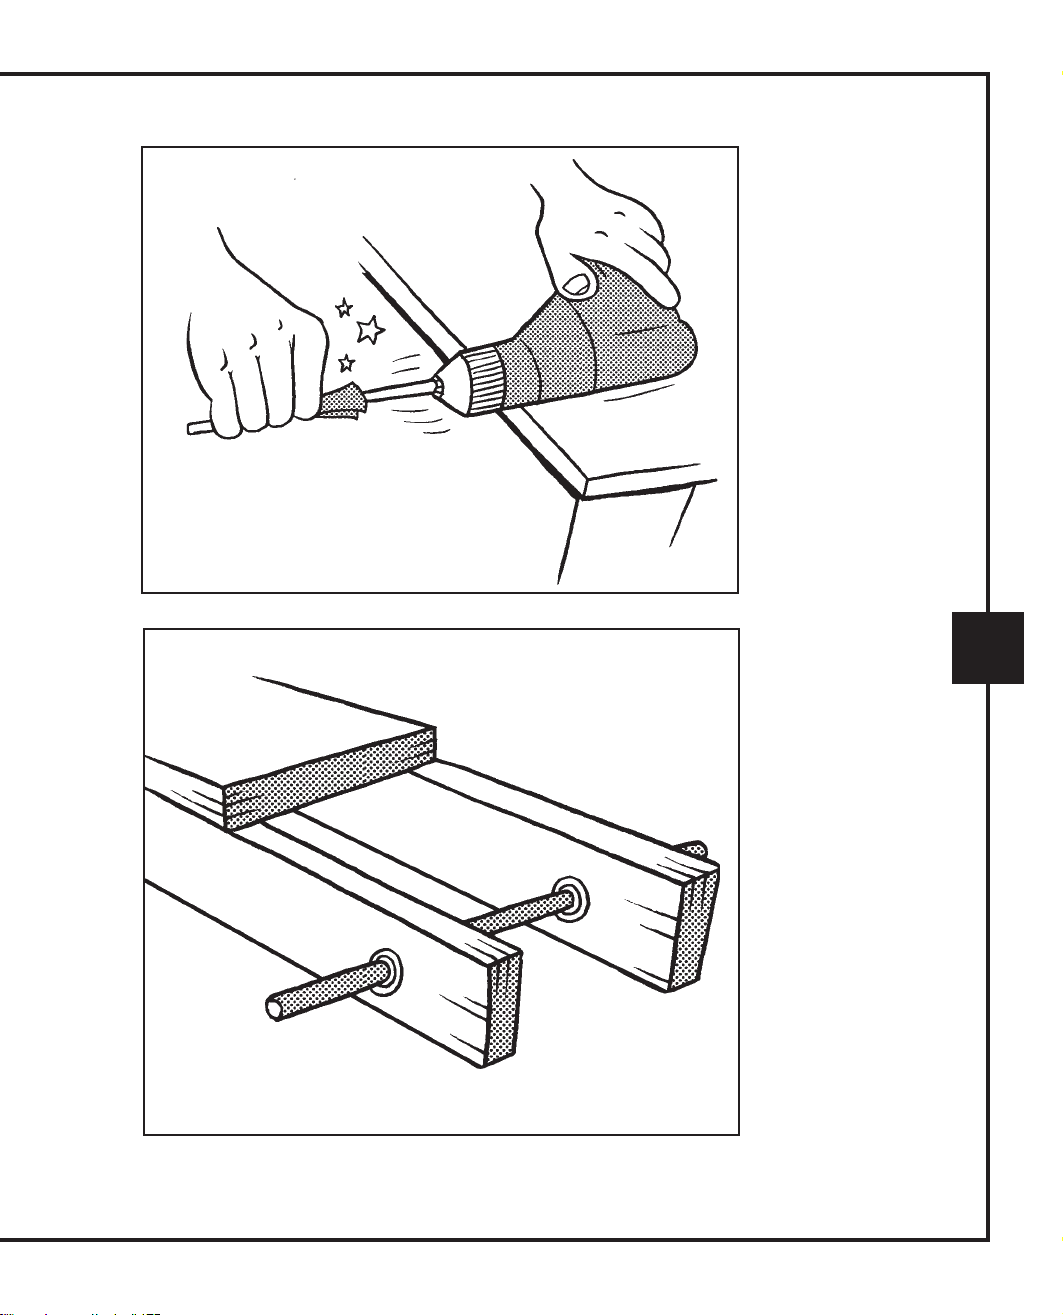
a local hobby store that deals with remote- controlled vehicles. Friction Construction Tip Mounting a Ball Bearing 15
If you do not have a dremel tool, you can
use a drill bit that matches the size of
the bearing. Be carful since large drill bits
can tear up the wooden causing the wood to
splinter. Wrap a piece of tape around the
area to be drilled in order to help protect the
wood from splintering. Try drilling a small
pilot hole with a smaller drill bit first. Friction Construction Tip
Fixing an Axle and Bearing Mismatch
Ball Bearings are designed to reduce friction between the axle and the
frame where they are in contact with one another (friction points).
Bearings reduce energy loss. By adding bearings your car will travel
further and faster depending on the type of car you are building.
Ball bearings are manufactured too much higher standers than the axles;
therefore, a bearing may fit one 3/16 inch brass tube may not another
of same diameter. Sometimes you may have to “turn” your brass tube
so that it will fit with a bearing. DO NOT FORCE BEARINGS ONTO
AN AXLE, this can wreck the bearing.
The best method for correcting small size differences between axles
and bearings is to place your axle in a drill. Using 32-400 grit WET
sand paper, turn the drill on and apply light pressure to the axle with
the sand paper and sand away a layer of the axle. As the drill rotates 16
hold the sandpaper around the axle and moving it along the length of
the tubing. Stop often and test-fit the bearing onto the axle, once the
bearing slides down the length of the axle you no longer need to turn
the axle down. The sandpaper will become HOT so do not put to much
pressure in one spot or you may burn your fingers. Adding Ball Bearings Friction Changing an Axle Size 17 Friction Construction Tip Making A Bushing 18 Friction Construction Tip Mounting a Bearing to a Frame 19 Friction Axle Size and Friction
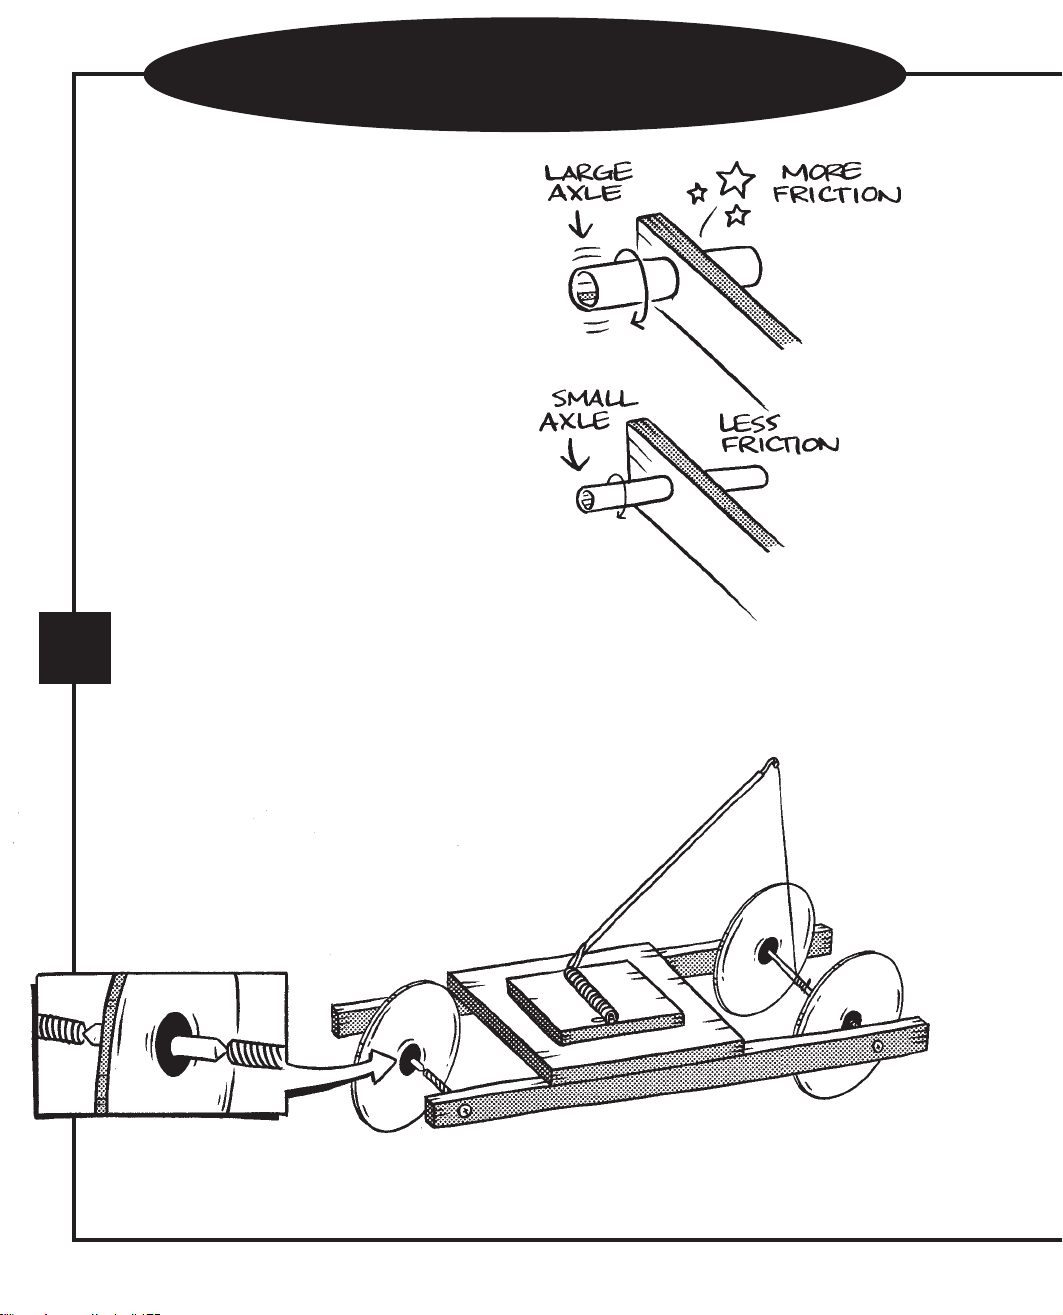
For an object spinning against another
object, like an axle turning inside the
frame of a mouse-trap car, the surface
friction is complicated by torque,
which will be discussed in another part
of this book. A thicker diameter axle or
bearing will stop turning sooner than a
comparable thinner axle or smaller
bearing. The reason is as follows: The
force of friction is the same around the
surface of a large and small diameter axle
but the location of where the force of
friction is being applied from the center of
the rotating axle is not the same. With a larger
diameter axle, the frictional force is applied further from
20 the center of rotation than with the smaller diameter axle. Torque is a combination
of an applied force and the location of that force from the point of rotation. The
further from the point of rotation, the greater the torque becomes for the same size
force. Smaller diameter axles and bearings translate into
less stopping torque and better performance. A pressure
bearing or even a magnetic bearing where only
the sharpened tip of the axle touches the
bearing is the best solution to beating friction. Friction
Tài liệu liên quan:
-
Impact of online flow on brand experience and loyalty môn Nghiên cứu khoa học | Trường Đại học Kinh tế, Đại học Quốc gia Hà Nội
34 17 -
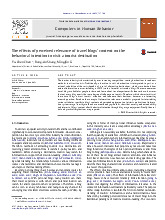
The effects of perceived relevance of travel blogs’ content on the behavioral intention to visit a tourist destination môn Nghiên cứu khoa học | Trường Đại học Kinh tế, Đại học Quốc gia Hà Nội
31 16 -
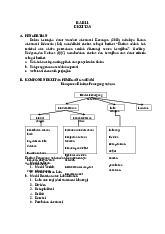
BAB 11 Ekuitas - Nghiên cứu khoa học | Trường Đại học Kinh tế, Đại học Quốc gia Hà Nội
201 101 -
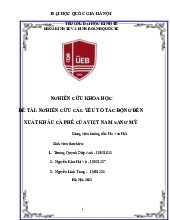
Nghiên cứu các yếu tố ảnh hưởng đến xuất khẩu cà phê của Việt Nam sang Mỹ giai đoạn 2002 - 2020 | Bài tiểu luận học phần Nghiên cứu khoa học | Trường Đại học Kinh tế, Đại học Quốc gia Hà Nội
849 425