Phân tích xử lý ảnh cho khoa học dữ liệu - Khoa học dữ liệu | Trường Đại học Khoa học Tự nhiên, Đại học Quốc gia Thành phố Hồ Chí Minh
In [6]: import numpy as np
import pandas as pd
import cv2
from matplotlib import pyplot as plt
from pylab import imread
from skimage.color import rgb2gray
Tài liệu được sưu tầm giúp bạn tham khảo, ôn tập và đạt kết quả cao trong kì thi sắp tới. Mời bạn đọc đón xem !
Môn: Khoa học dữ liệu (HCMUS) 11 tài liệu
Trường: Trường Đại học Khoa học tự nhiên, Đại học Quốc gia Thành phố Hồ Chí Minh 1.1 K tài liệu
Tác giả:


Preview text:
lOMoARcPSD|46342985 lOMoARcPSD|46342985 27/9/2019
Lab01-Image Processing and Analysis
Lab01-Image Processing and Analysis
In [6]: import numpy as np import pandas as pd import cv2
from matplotlib import pyplot as plt
from pylab import imread
from skimage.color import rgb2gray 1/23 lOMoARcPSD|46342985 27/9/2019
Lab01-Image Processing and Analysis
In [7]: def imshows(ImageData, LabelData, rows, cols, gridType = False):
# Convert ImageData and LabelData to
List from matplotlib import pyplot as
plt ImageArray = list(ImageData) LabelArray =
list(LabelData) if(rows == 1 & cols == 1): fig = plt.figure(figsize=(20,20)) else:
fig = plt.figure(figsize=(cols*8,rows*5))
for i in range(1, cols * rows + 1): fig.add_subplot(rows, cols, i) image = ImageArray[i - 1]
# If the channel number is less than 3, we display as grayscale image
# otherwise, we display as color image
if (len(image.shape) < 3): plt.imshow(image, plt.cm.gray) plt.grid(gridType) else: plt.imshow(image) plt.grid(gridType) plt.title(LabelArray[i - 1]) plt.show()
def ShowThreeImages(IM1, IM2, IM3):
imshows([IM1, IM2, IM3], ["Image 1","Image 2", "Image 3"], 1, 3)
def ShowTwoImages(IM1, IM2):
imshows([IM1, IM2], ["Image 1","Image 2"], 1, 2) def ShowOneImage(IM): imshows([IM], ["Image"], 1, 1)
def ShowListImages(listImage, row, col): listCaption = []
for i in range(len(listImage)): listCaption.append(str(i))
imshows(listImage,listCaption,row,col) 2/23 lOMoARcPSD|46342985 27/9/2019
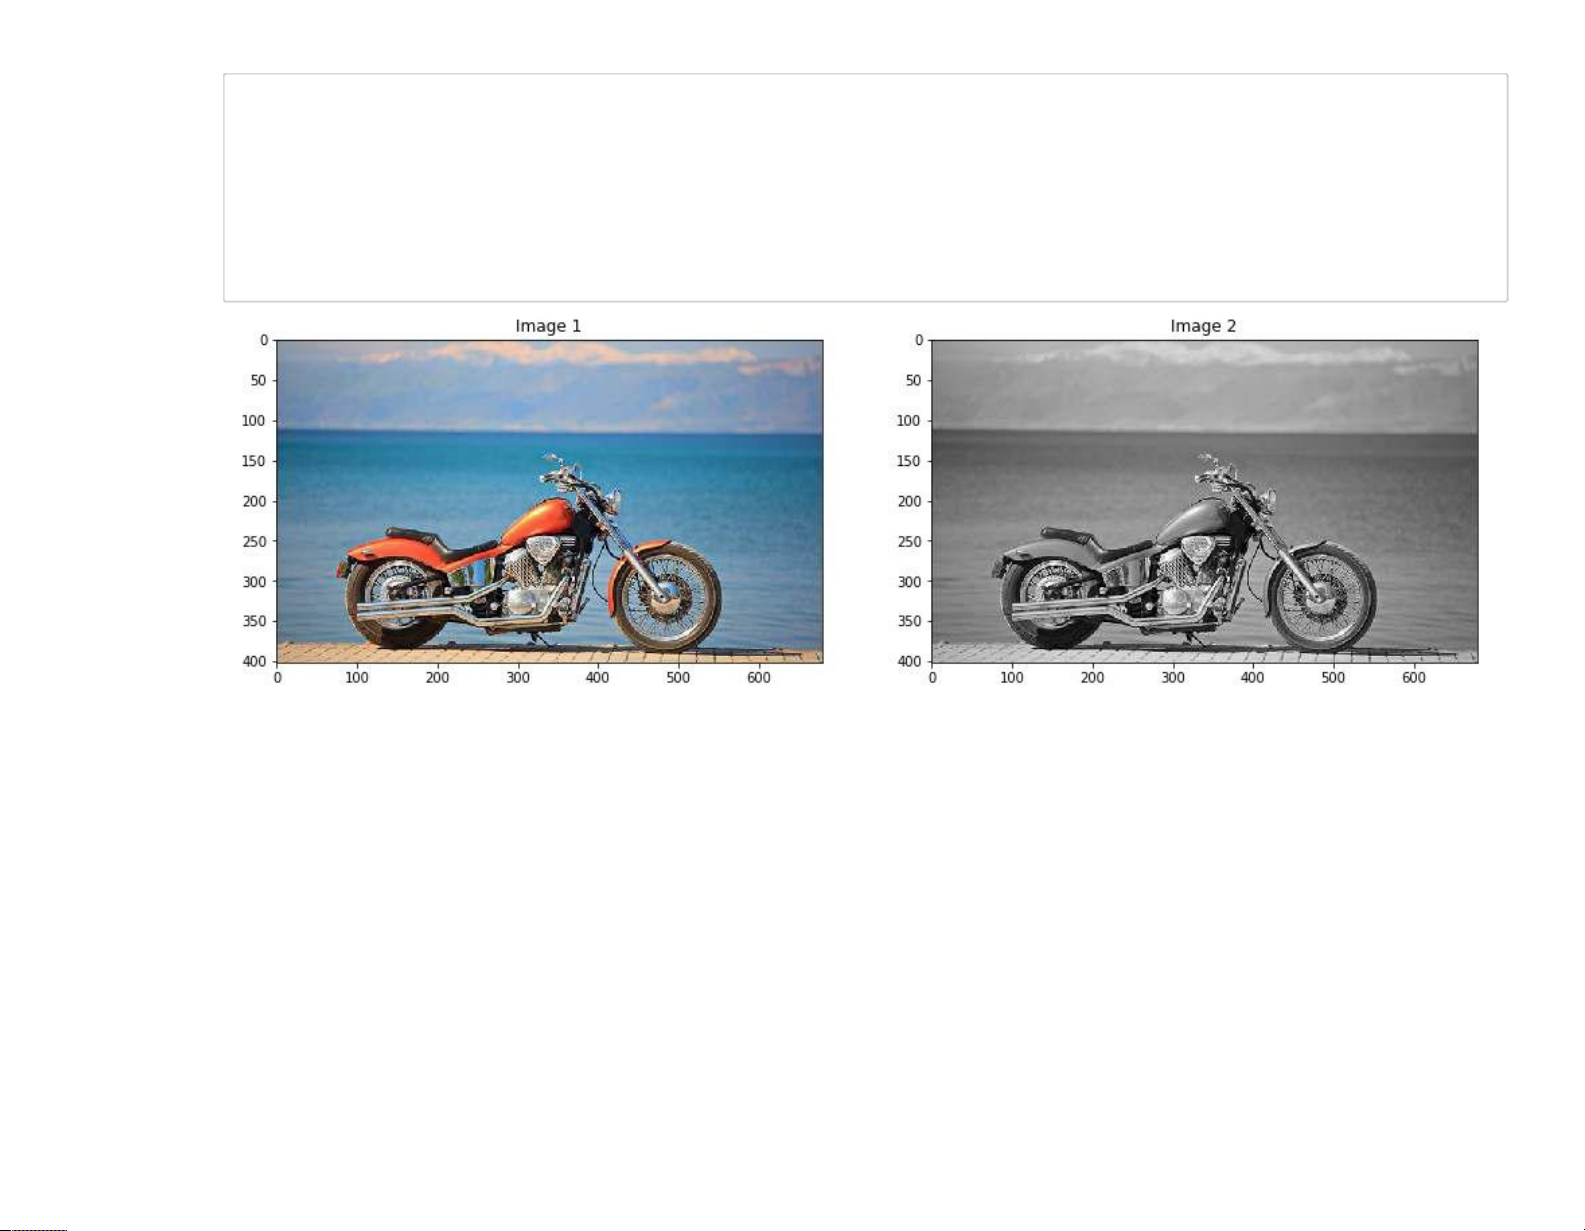
Lab01-Image Processing and Analysis In [8]: # Read Image
image_color = imread("Sample01/motocycle.jpg") # Convert Image into Gray
image_gray = cv2.cvtColor(image_color, cv2.COLOR_RGB2GRAY) # Display Image
ShowTwoImages(image_color, image_gray) 3/23 lOMoARcPSD|46342985 27/9/2019
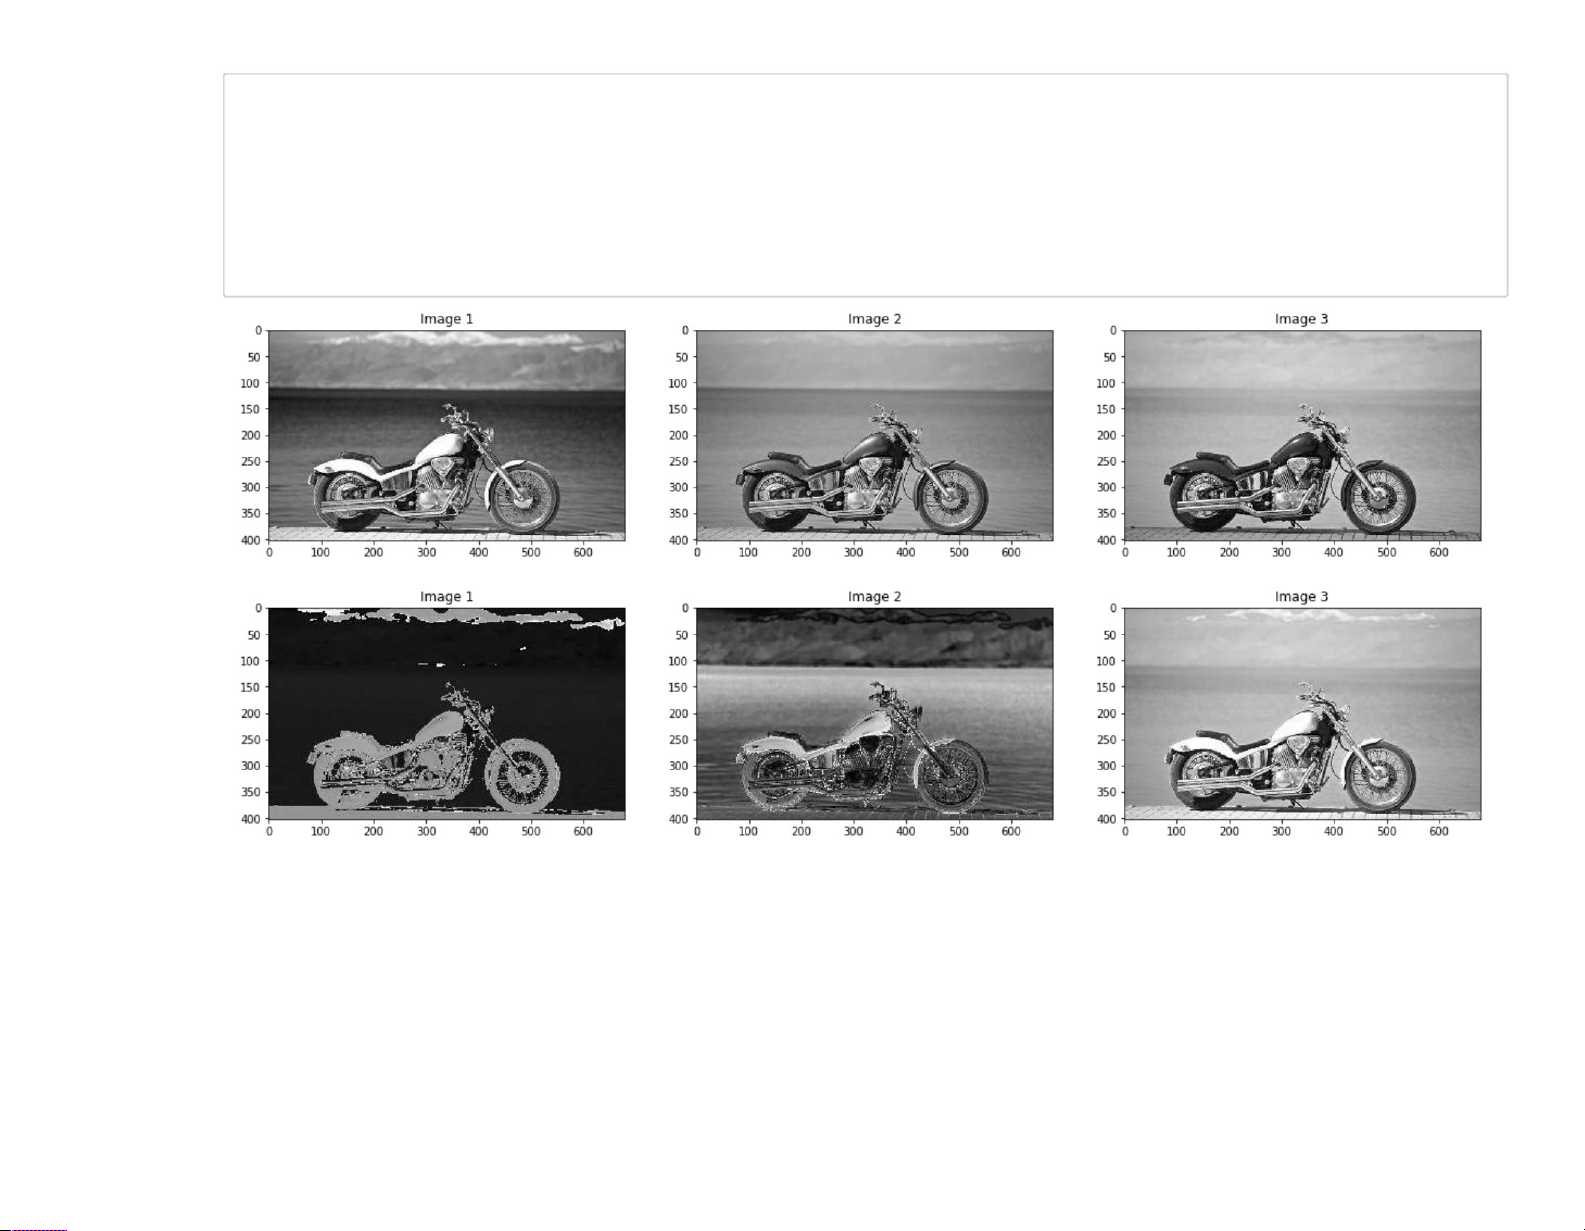
Lab01-Image Processing and Analysis In [9]: #
Convert Image into HSV color spaces
image_hsv = cv2.cvtColor(image_color, cv2.COLOR_BGR2HSV)
# Show each channel R, G, and B
ShowThreeImages(image_color[:,:,0],image_color[:,:,1],image_color[:,:,2])
# Show each channel H , S and V
ShowThreeImages(image_hsv[:,:,0],image_hsv[:,:,1],image_hsv[:,:,2])
file:///C:/Users/Admin/Desktop/Lab01-Image Processing and Analysis.html 4/23 lOMoARcPSD|46342985 27/9/2019
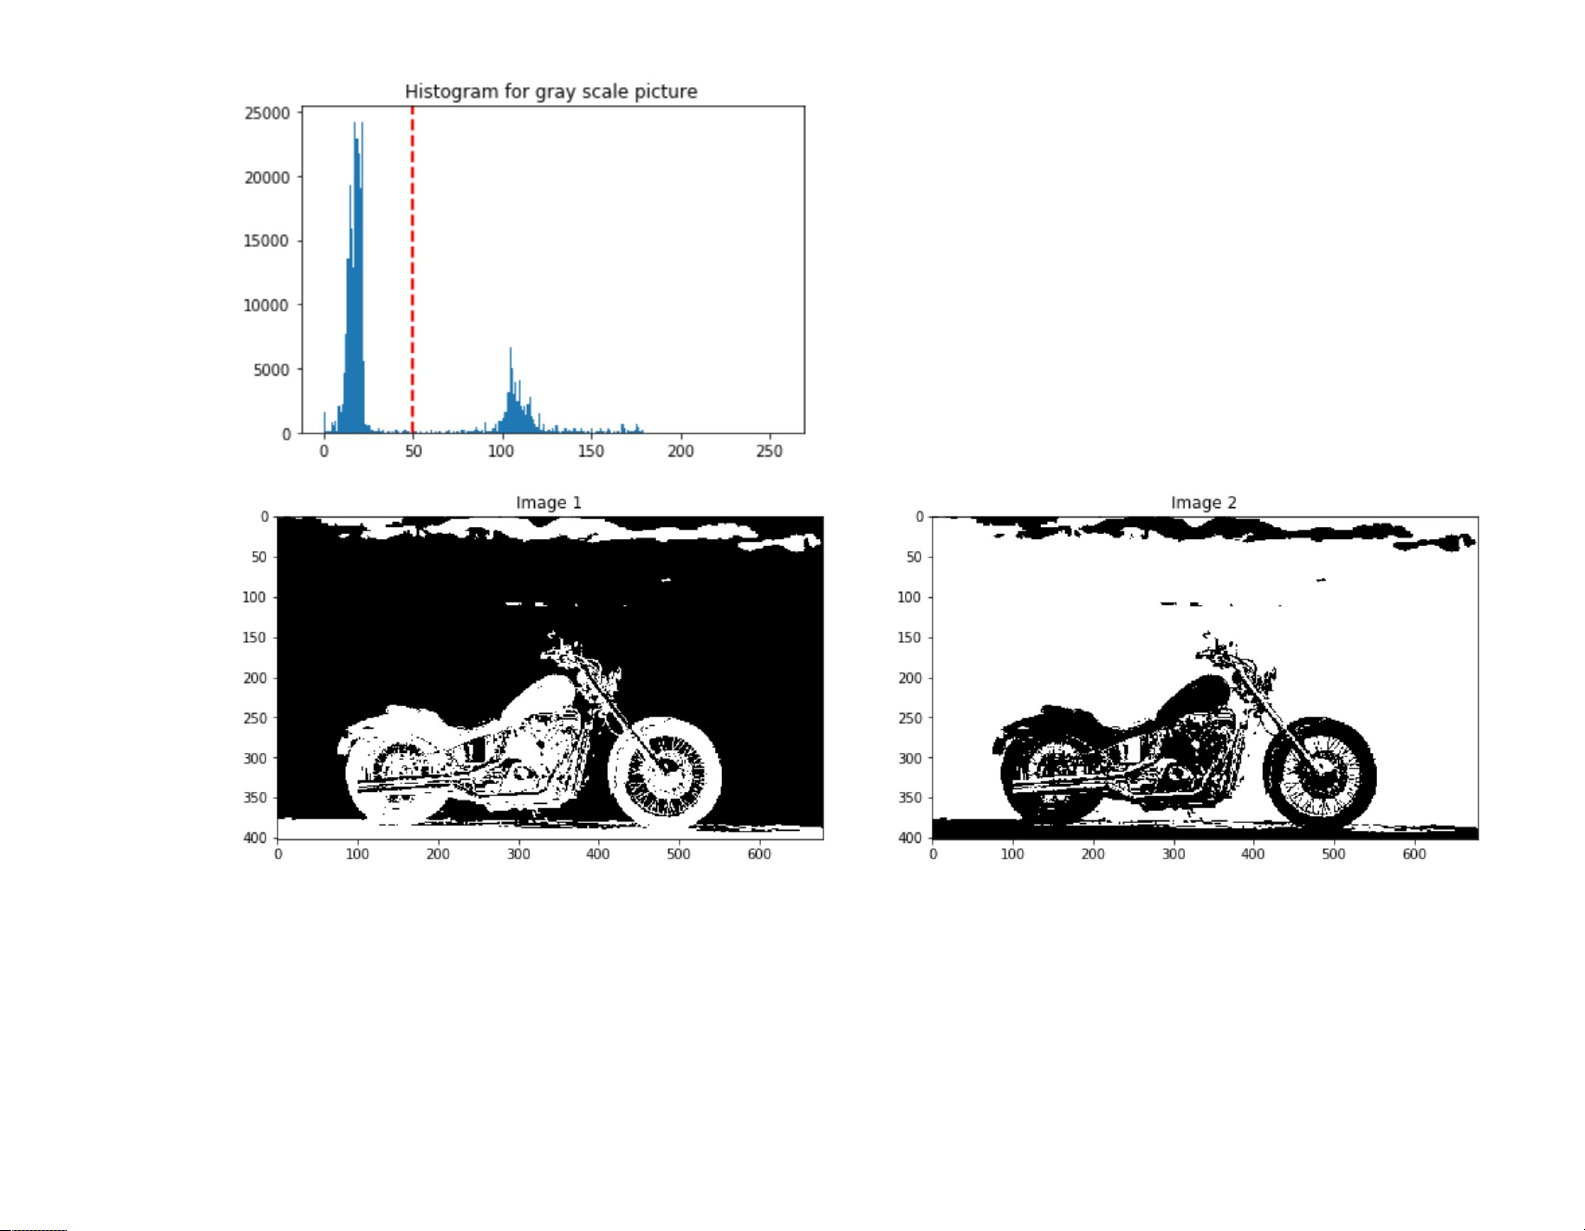
Lab01-Image Processing and Analysis In hue_img = image_hsv[:,:,0] [10]: hue_threshold = 50
# Show Histogram of Hue Channel
hist = cv2.calcHist([hue_img],[0],None,[256],[0,256])
plt.hist(hue_img.ravel(),256,[0,256])
plt.axvline(x=hue_threshold, color='r', linestyle='dashed', linewidth=2)
plt.title('Histogram for gray scale picture') plt.show()
# Use threshold to segment object by histogram
hue_binary01 = hue_img > hue_threshold
hue_binary02 = 1 - hue_binary01
ShowTwoImages(hue_binary01, hue_binary02)
file:///C:/Users/Admin/Desktop/Lab01-Image Processing and Analysis.html 5/23 lOMoARcPSD|46342985 27/9/2019
Lab01-Image Processing and Analysis
file:///C:/Users/Admin/Desktop/Lab01-Image Processing and Analysis.html 6/23 lOMoARcPSD|46342985 27/9/2019
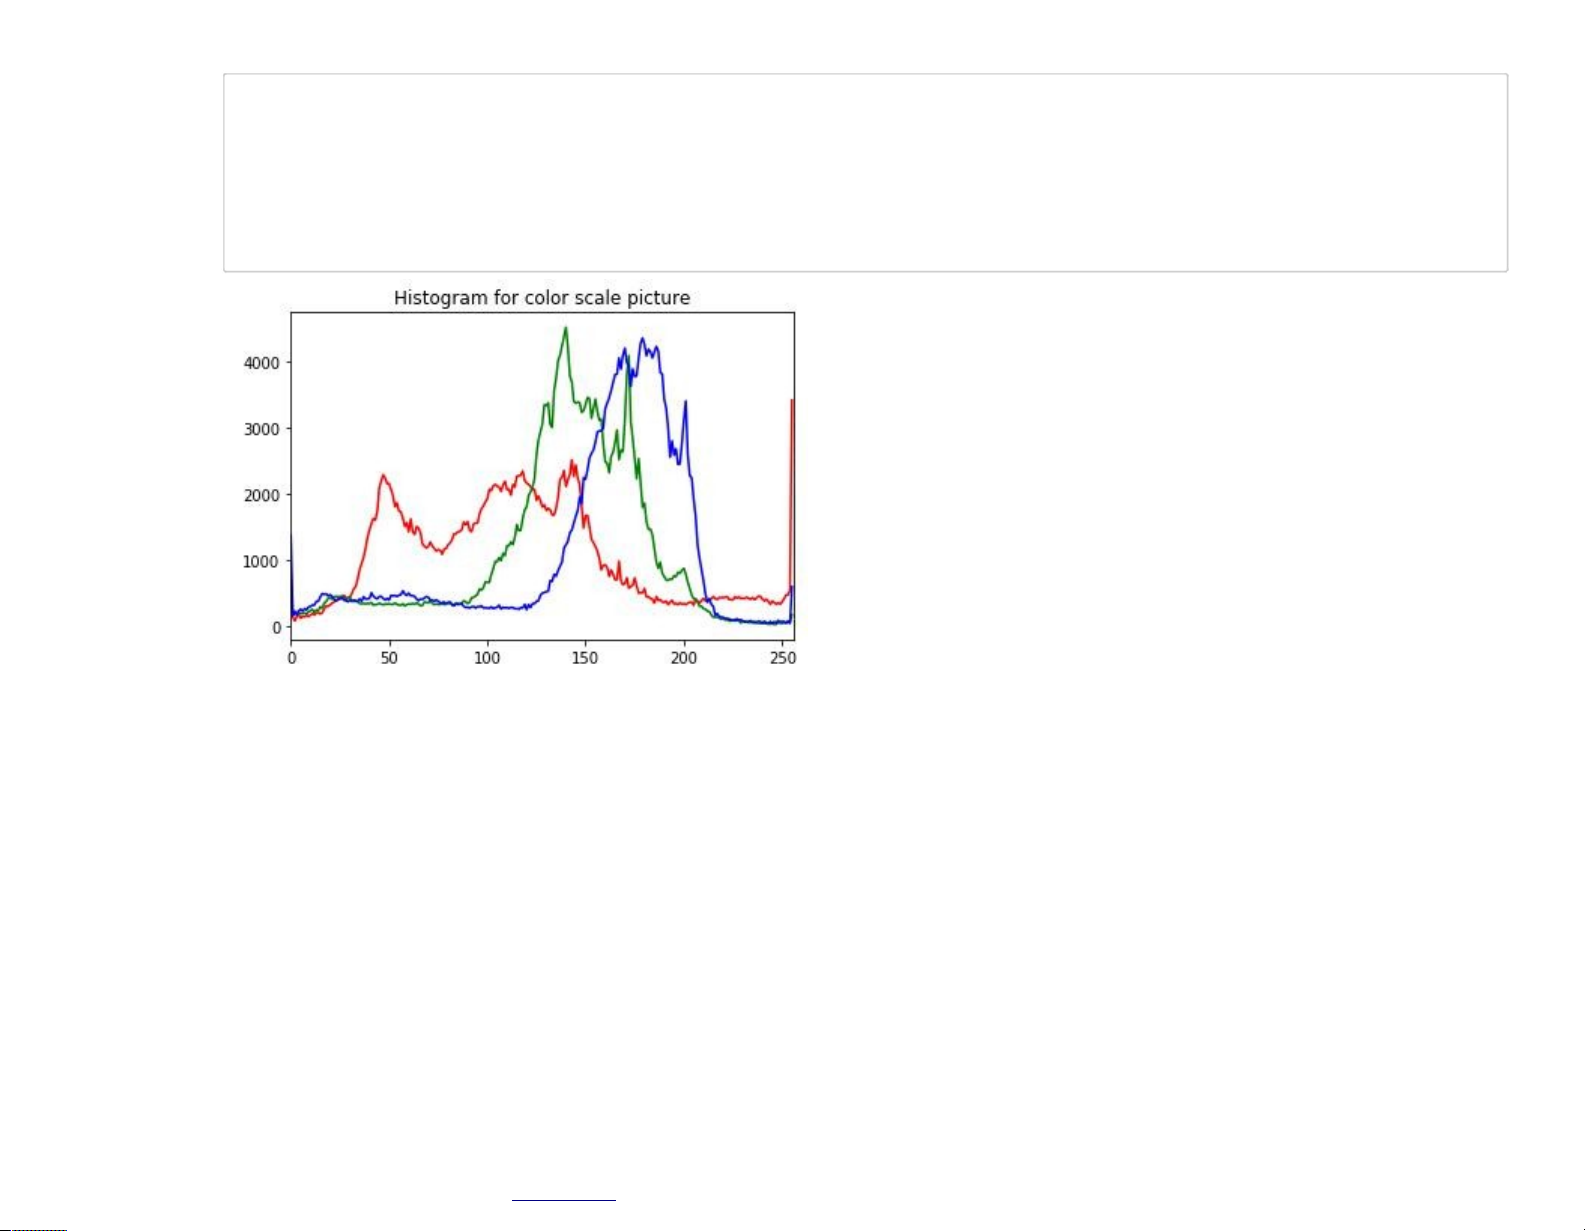
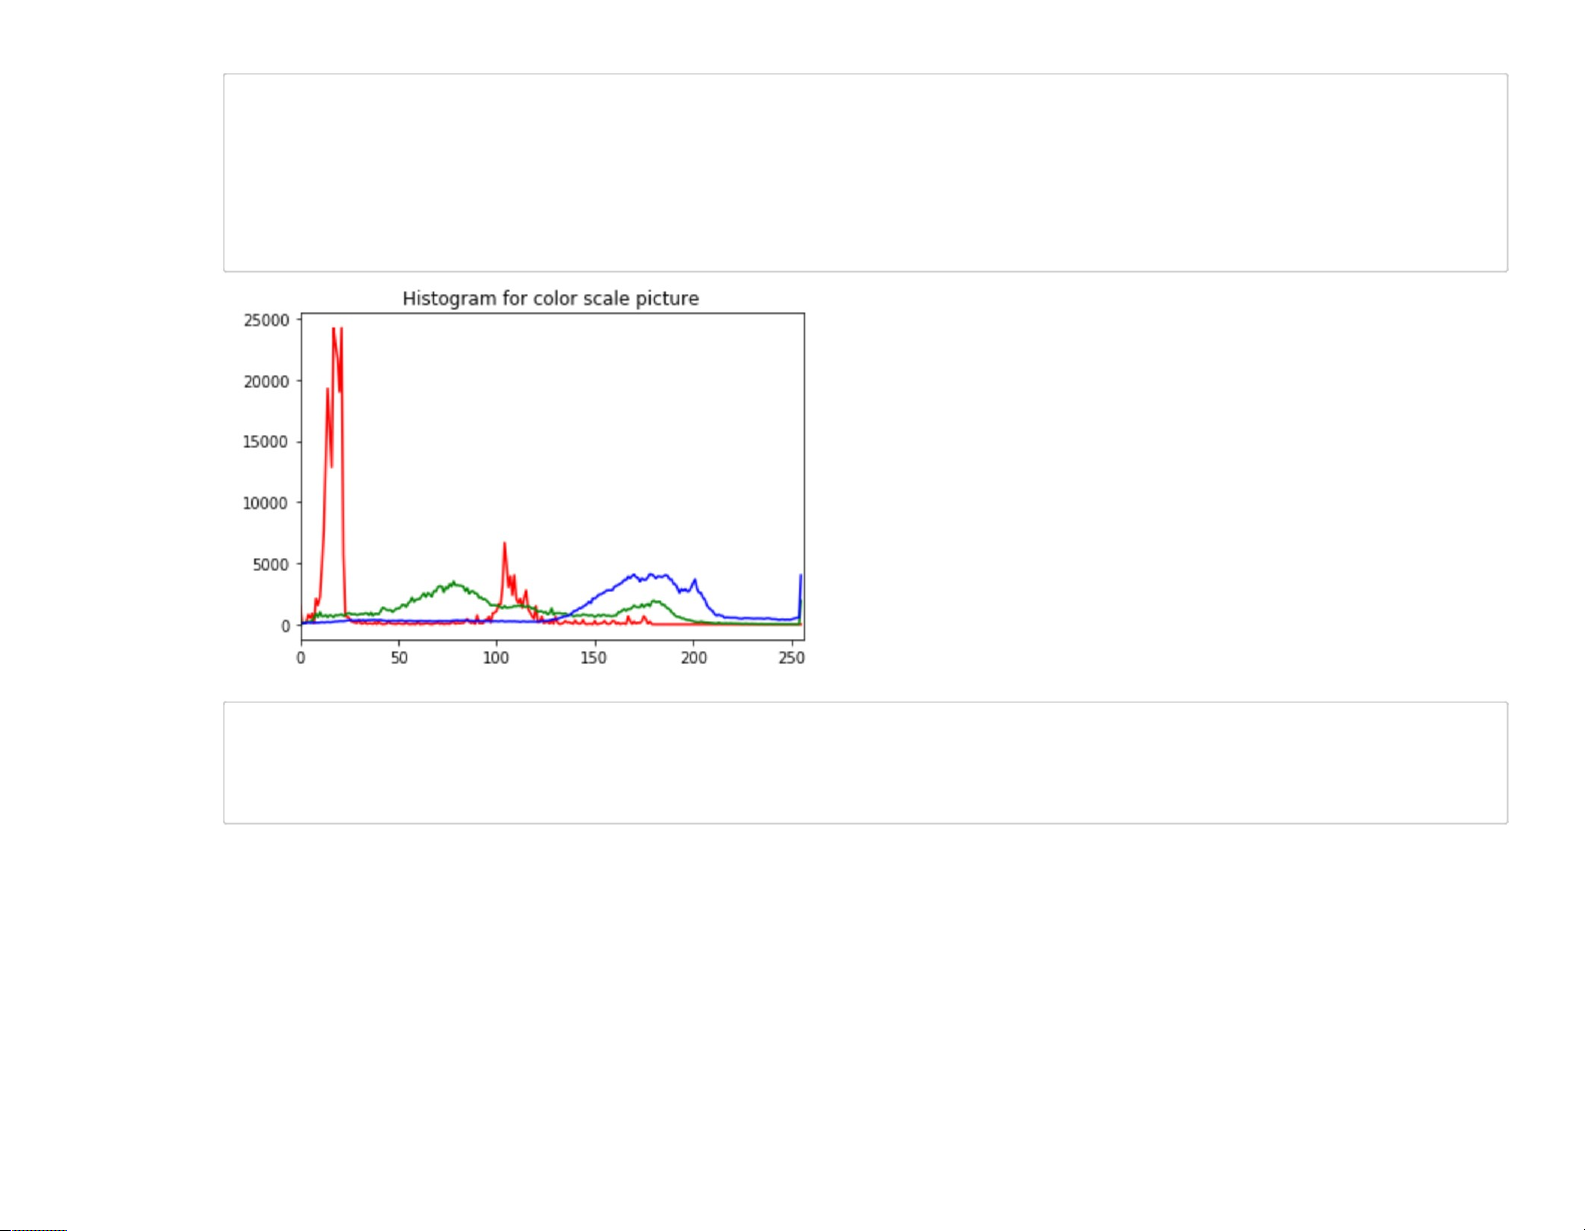
Lab01-Image Processing and Analysis In color = ('r', 'g', 'b') [11]:
for channel,col in enumerate(color):
histr = cv2.calcHist([image_color],[channel],None,[256],[0,256]) plt.plot(histr,color = col) plt.xlim([0,256])
plt.title('Histogram for color scale picture') plt.show()
file:///C:/Users/Admin/Desktop/Lab01-Image Processing and Analysis.html 7/23 lOMoARcPSD|46342985 27/9/2019
Lab01-Image Processing and Analysis In color = ('r', 'g', 'b') [12]:
for channel,col in enumerate(color):
histr = cv2.calcHist([image_hsv],[channel],None,[256],[0,256]) plt.plot(histr,color = col) plt.xlim([0,256])
plt.title('Histogram for color scale picture') plt.show()
In [13]: def SegmentColorImageByMask(IM, Mask): Mask = Mask.astype(np.uint8)
result = cv2.bitwise_and(IM, IM, mask = Mask) return result
file:///C:/Users/Admin/Desktop/Lab01-Image Processing and Analysis.html 8/23 lOMoARcPSD|46342985 27/9/2019
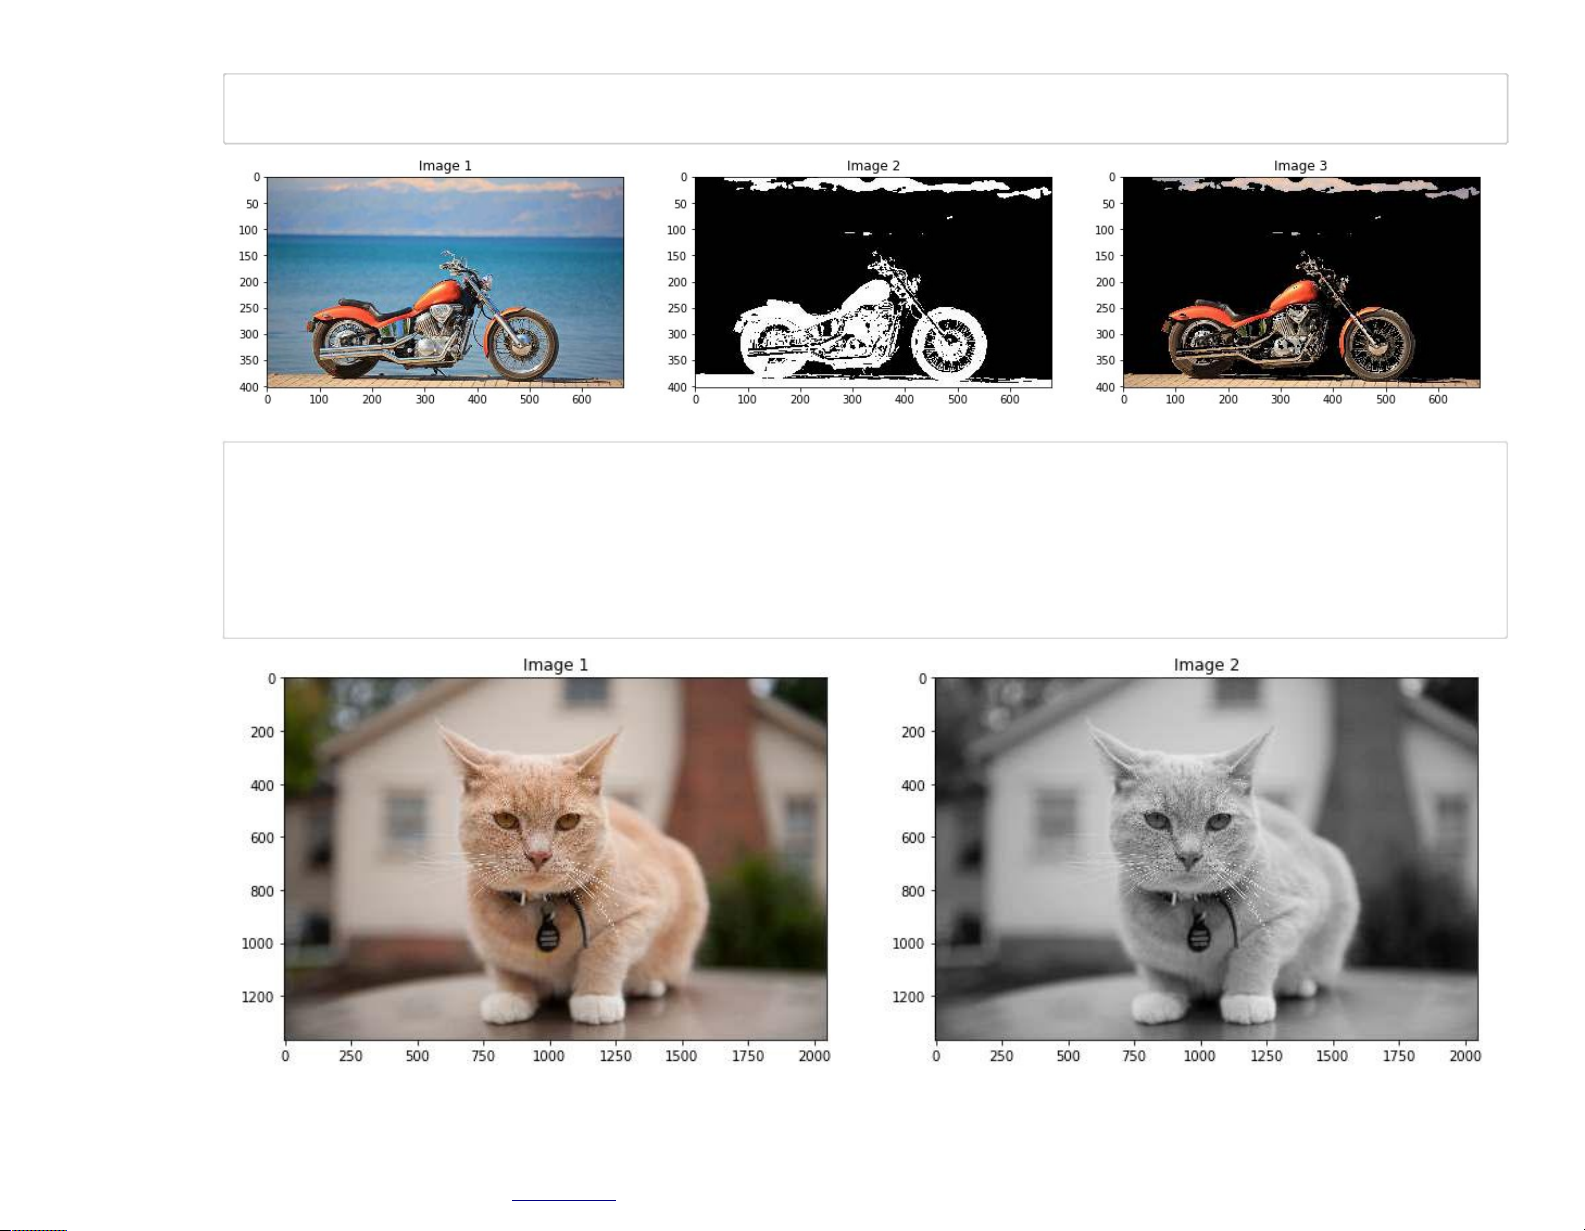
Lab01-Image Processing and Analysis In
hue_binary01_rgb = SegmentColorImageByMask(image_color, hue_binary01) [14]:
ShowThreeImages(image_color, hue_binary01, hue_binary01_rgb) In [15]: # Read Image
image_color = imread("Sample01/cat.jpg") # Convert Image into Gray
image_gray = cv2.cvtColor(image_color, cv2.COLOR_RGB2GRAY) # Display Image
ShowTwoImages(image_color, image_gray)
file:///C:/Users/Admin/Desktop/Lab01-Image Processing and Analysis.html 9/23 lOMoARcPSD|46342985 27/9/2019
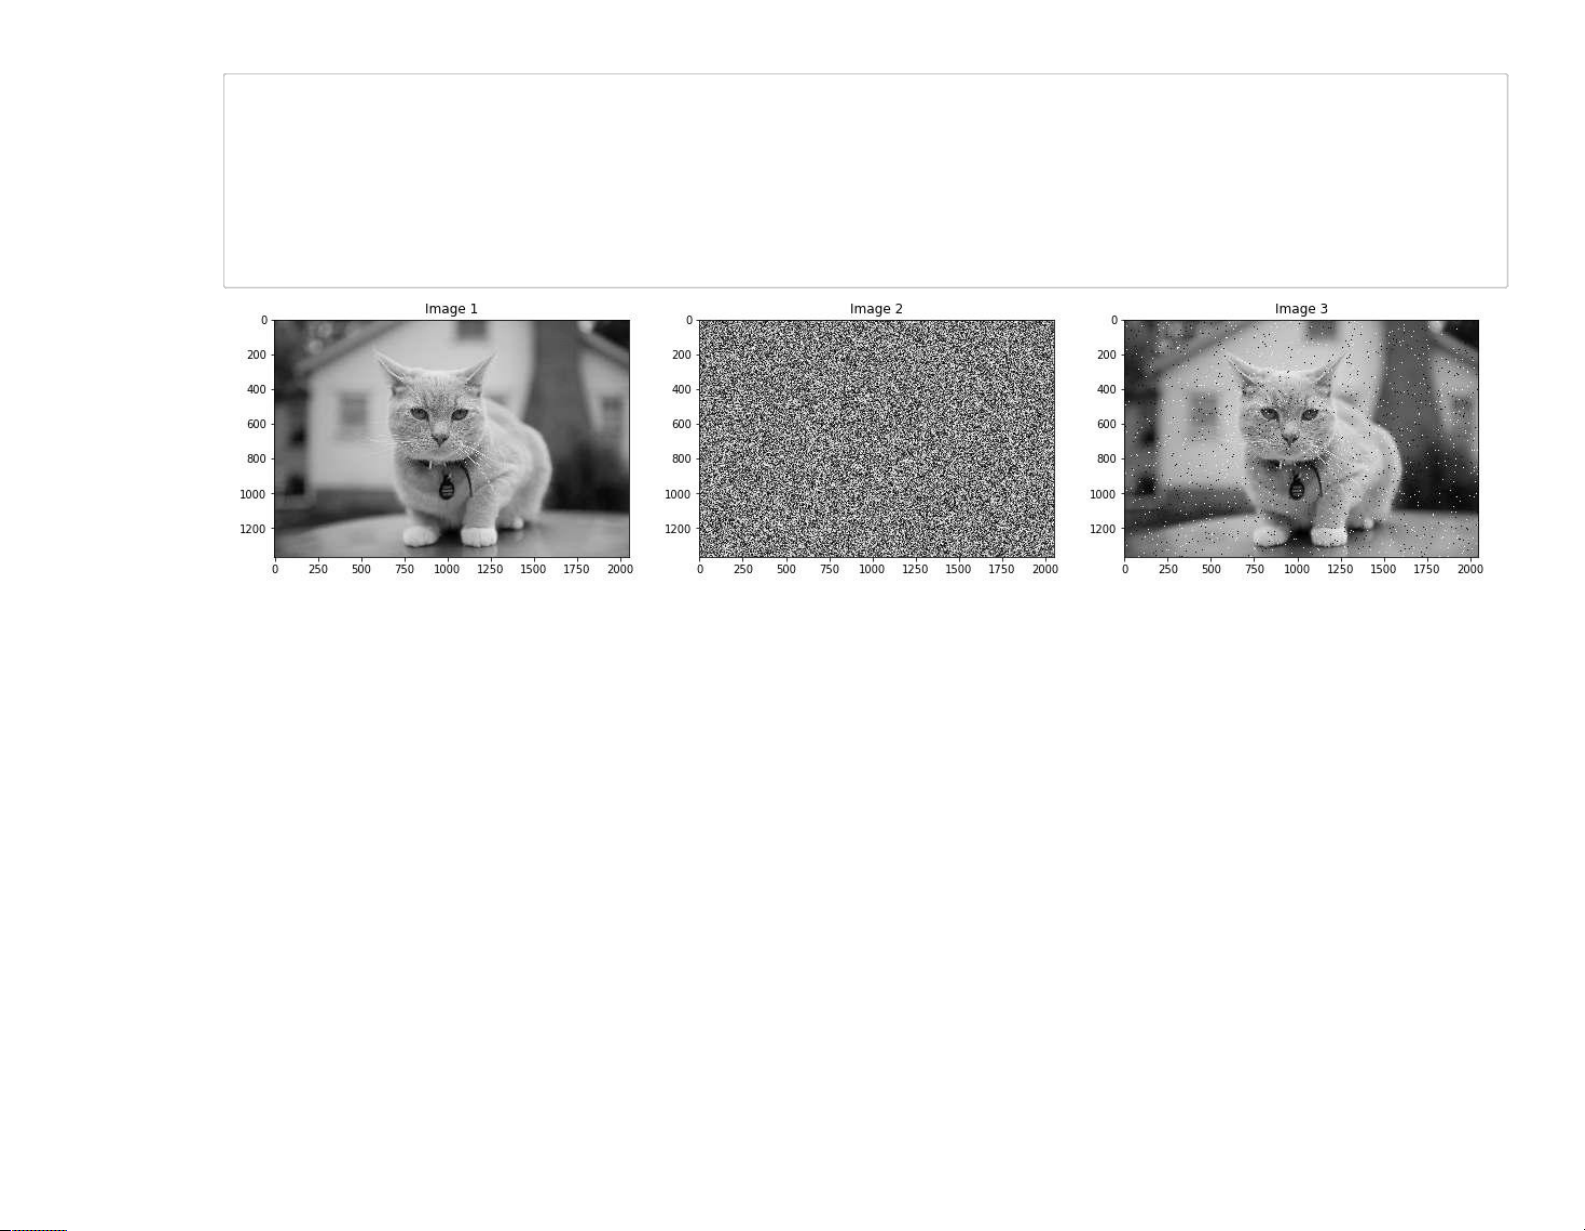
Lab01-Image Processing and Analysis In # Create Noise Image [18]:
noise = np.random.random(image_gray.shape)
image_noise = image_gray.copy()
image_noise[noise > 0.99] = 255
image_noise[noise < 0.01] = 0
ShowThreeImages(image_gray, noise, image_noise)
file:///C:/Users/Admin/Desktop/Lab01-Image Processing and Analysis.html 10/23 lOMoARcPSD|46342985 27/9/2019
Lab01-Image Processing and Analysis
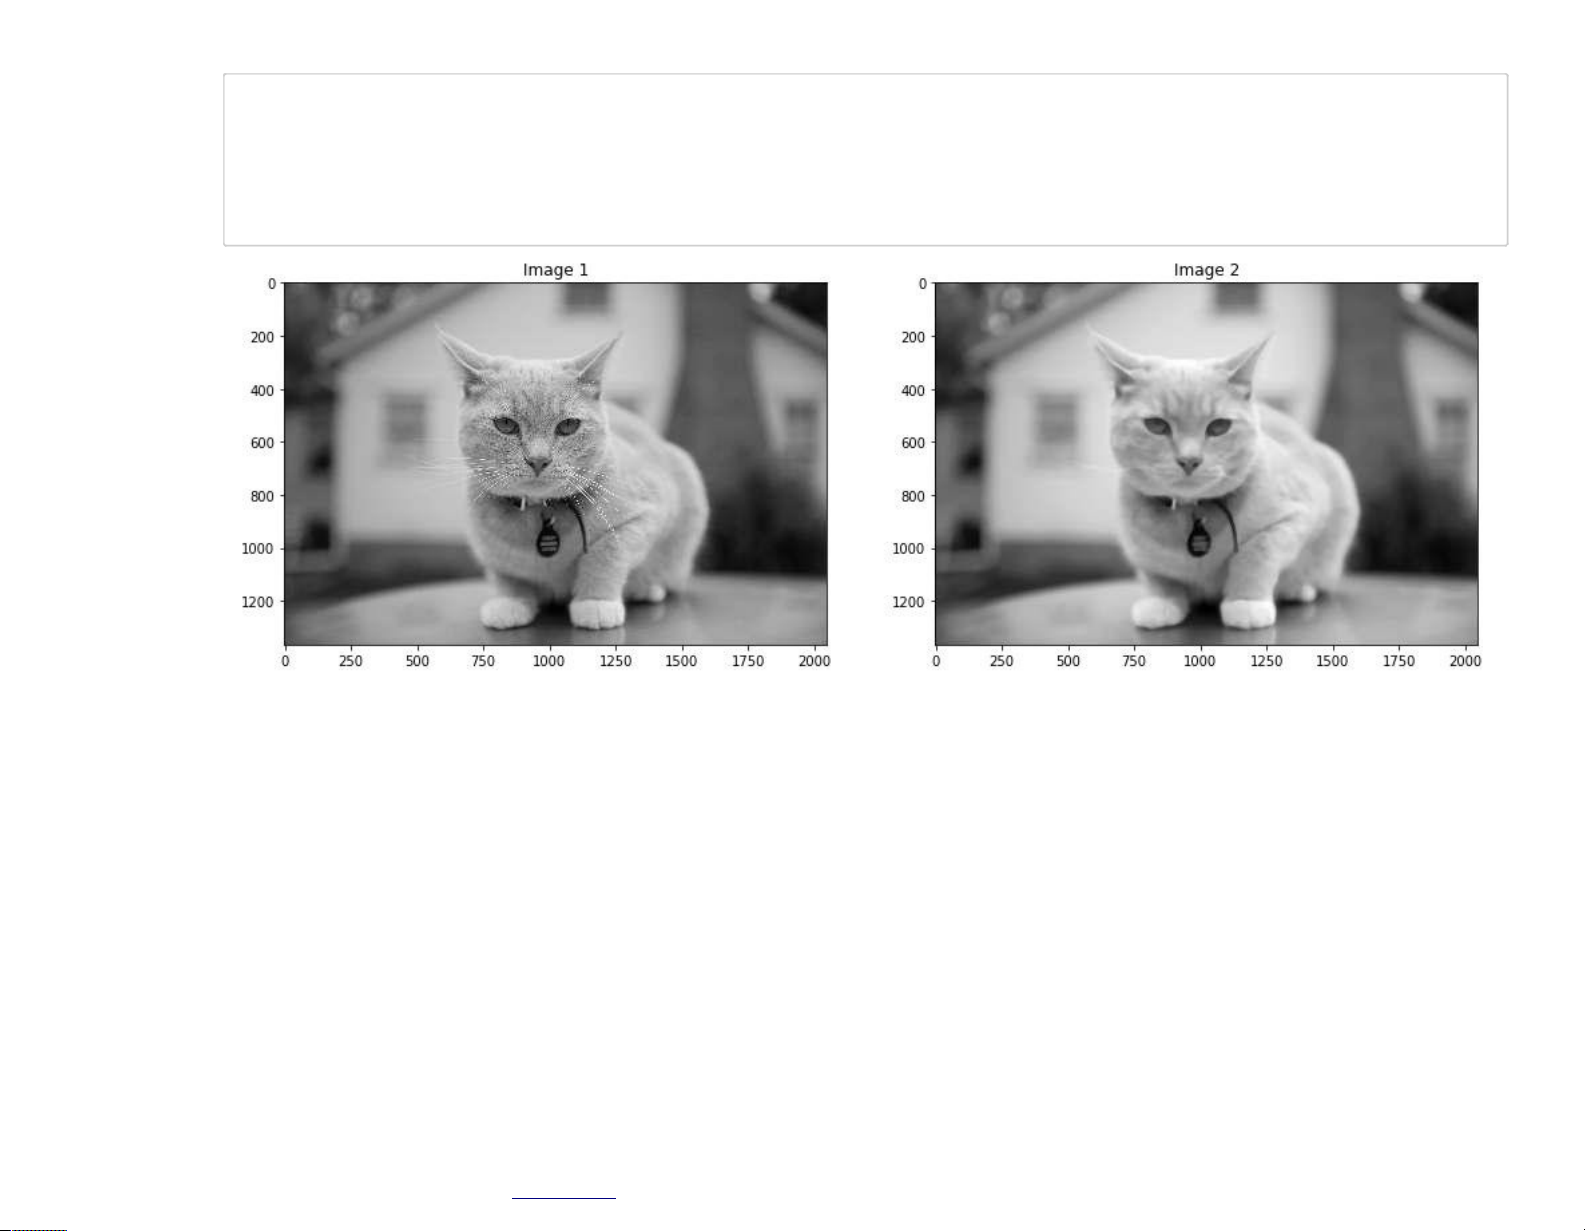
In [20]: # Create Blurred Image
from skimage.filters.rank import median
from skimage.morphology import disk
image_blurred = median(image_gray, disk(10))
ShowTwoImages(image_gray, image_blurred)
file:///C:/Users/Admin/Desktop/Lab01-Image Processing and Analysis.html 11/23 lOMoARcPSD|46342985 27/9/2019
Lab01-Image Processing and Analysis
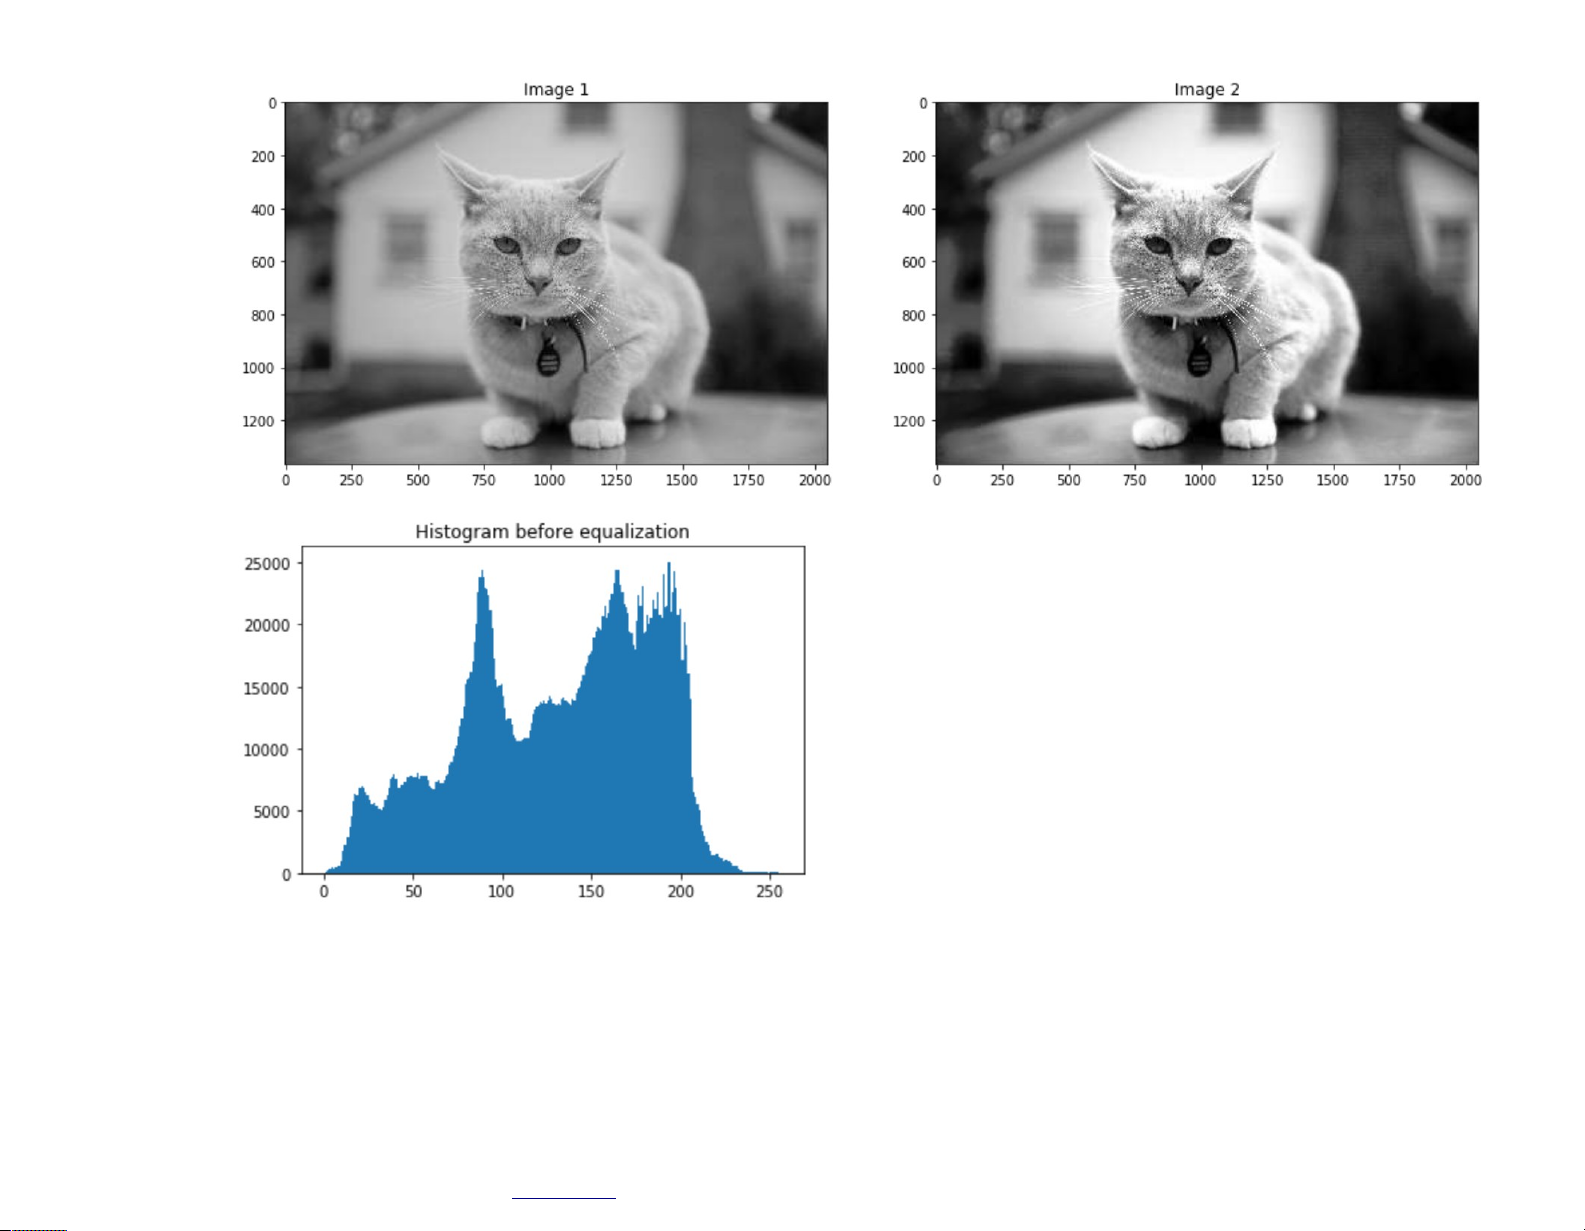
In [45]: from skimage import data, exposure
image_equalization = exposure.equalize_hist(image_gray)
image_equalization = np.float32(image_equalization * 255)
ShowTwoImages(image_gray, image_equalization)
hist = cv2.calcHist([image_gray],[0],None,[256],[0,256])
plt.hist(image_gray.ravel(),256,[0,256])
plt.title('Histogram before equalization') plt.show()
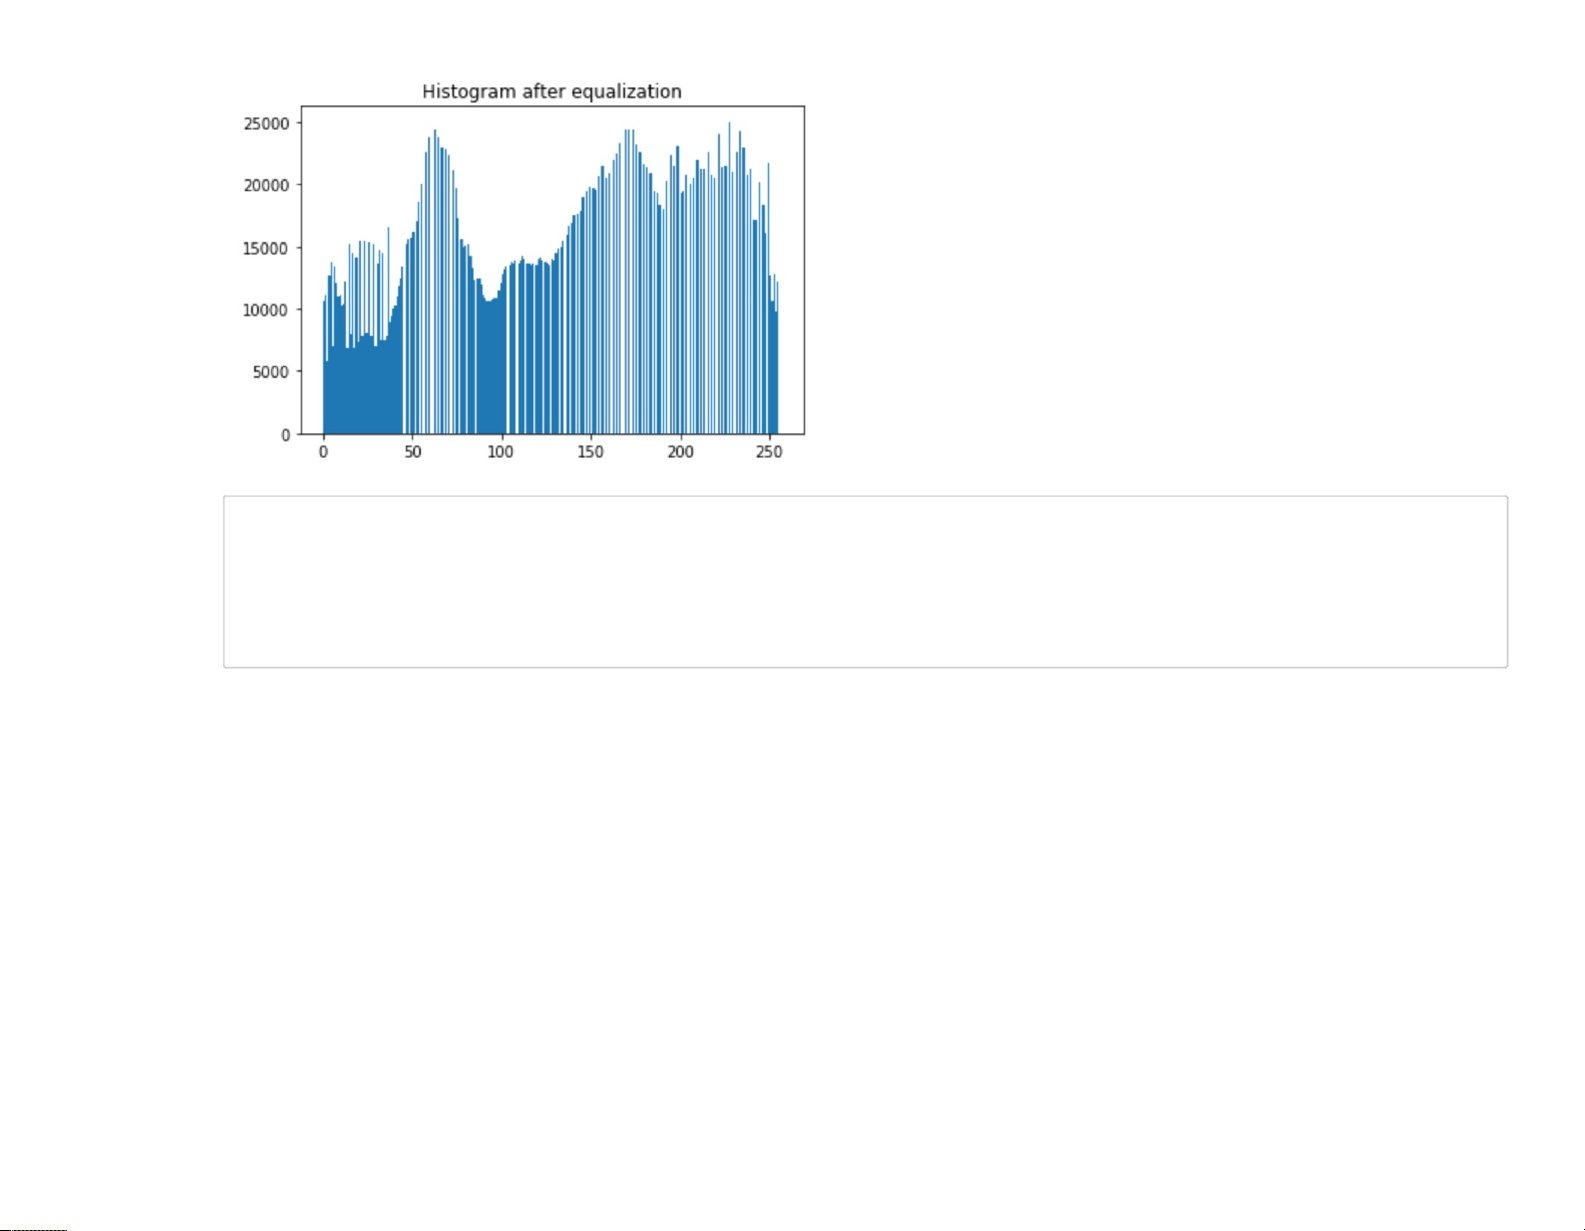
hist = cv2.calcHist([image_equalization],[0],None,[256],[0,256])
plt.hist(image_equalization.ravel(),256,[0,256])
plt.title('Histogram after equalization') plt.show()
file:///C:/Users/Admin/Desktop/Lab01-Image Processing and Analysis.html 12/23 lOMoARcPSD|46342985 27/9/2019
Lab01-Image Processing and Analysis
file:///C:/Users/Admin/Desktop/Lab01-Image Processing and Analysis.html 13/23 lOMoARcPSD|46342985 27/9/2019
Lab01-Image Processing and Analysis
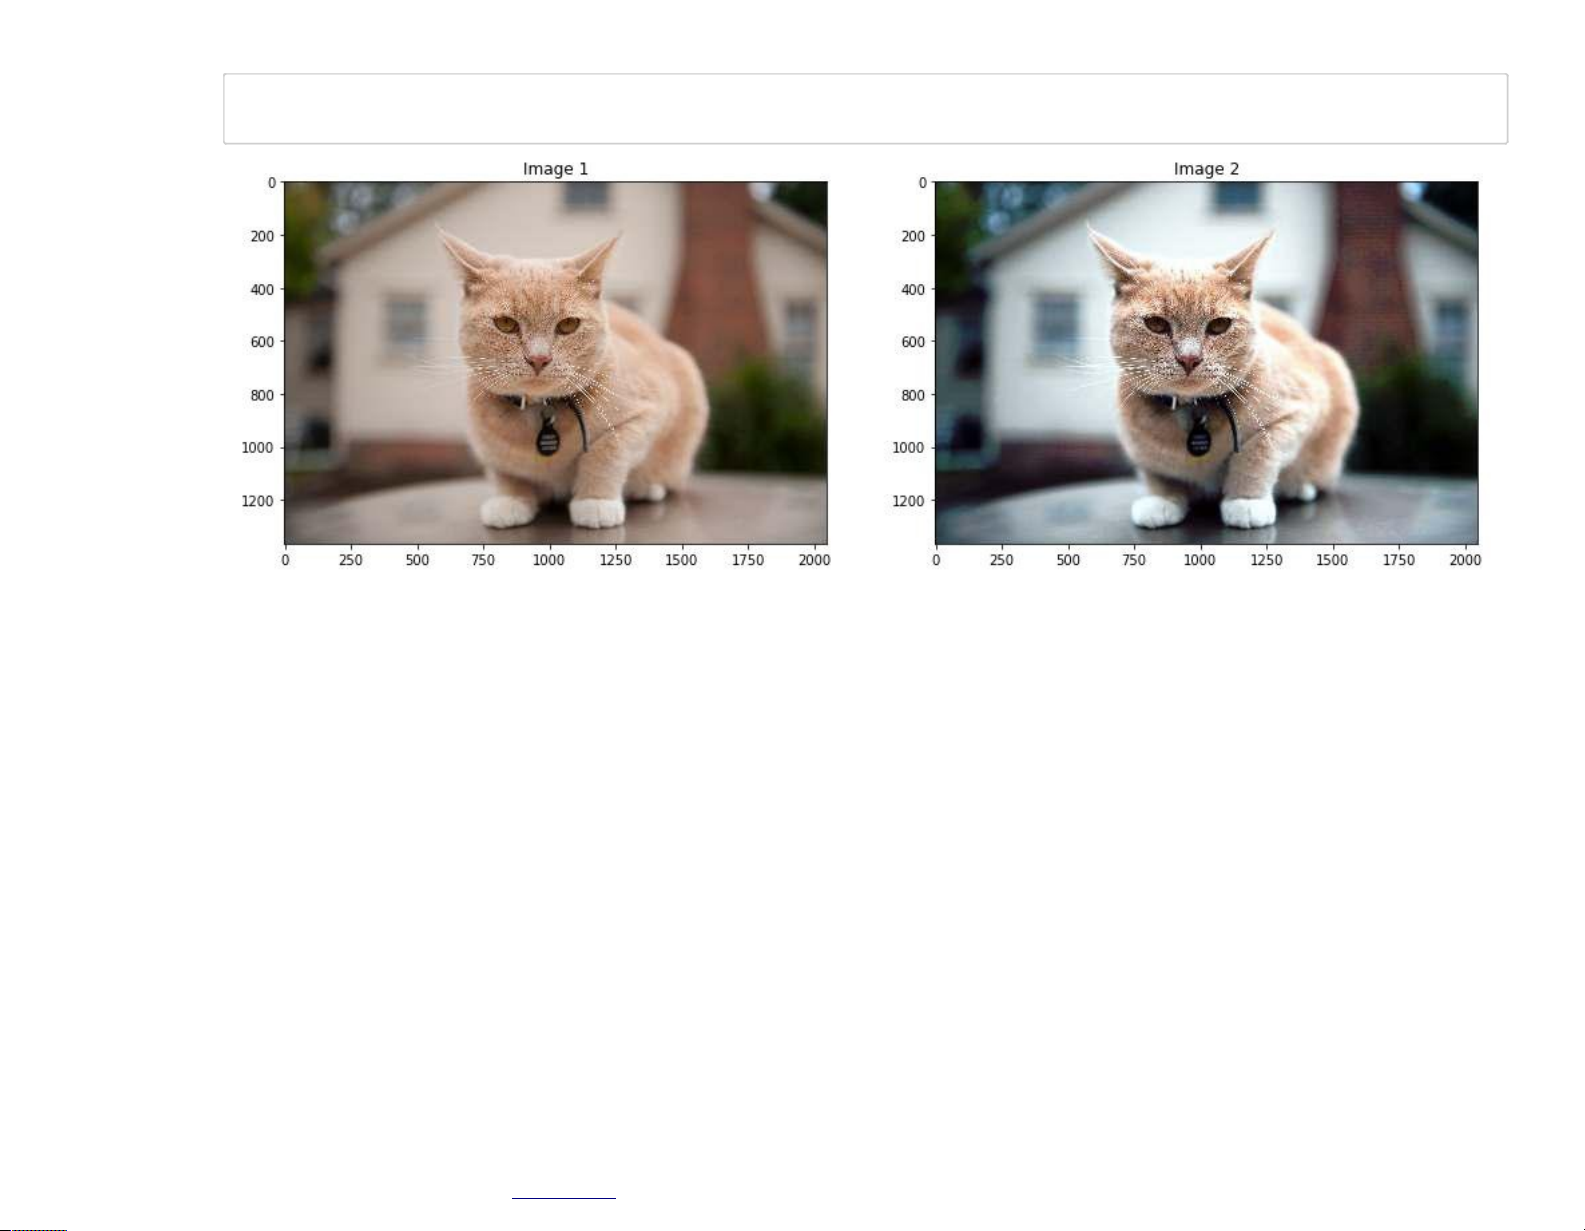
In [46]: def histogram_equalize(img): r, g, b = cv2.split(img) red = cv2.equalizeHist(r) green = cv2.equalizeHist(g) blue = cv2.equalizeHist(b)
return cv2.merge((red, green, blue))
file:///C:/Users/Admin/Desktop/Lab01-Image Processing and Analysis.html 14/23 lOMoARcPSD|46342985 27/9/2019
Lab01-Image Processing and Analysis
In [47]: image_equalization_color = histogram_equalize(image_color)
ShowTwoImages(image_color, image_equalization_color)
file:///C:/Users/Admin/Desktop/Lab01-Image Processing and Analysis.html 15/23 lOMoARcPSD|46342985 27/9/2019
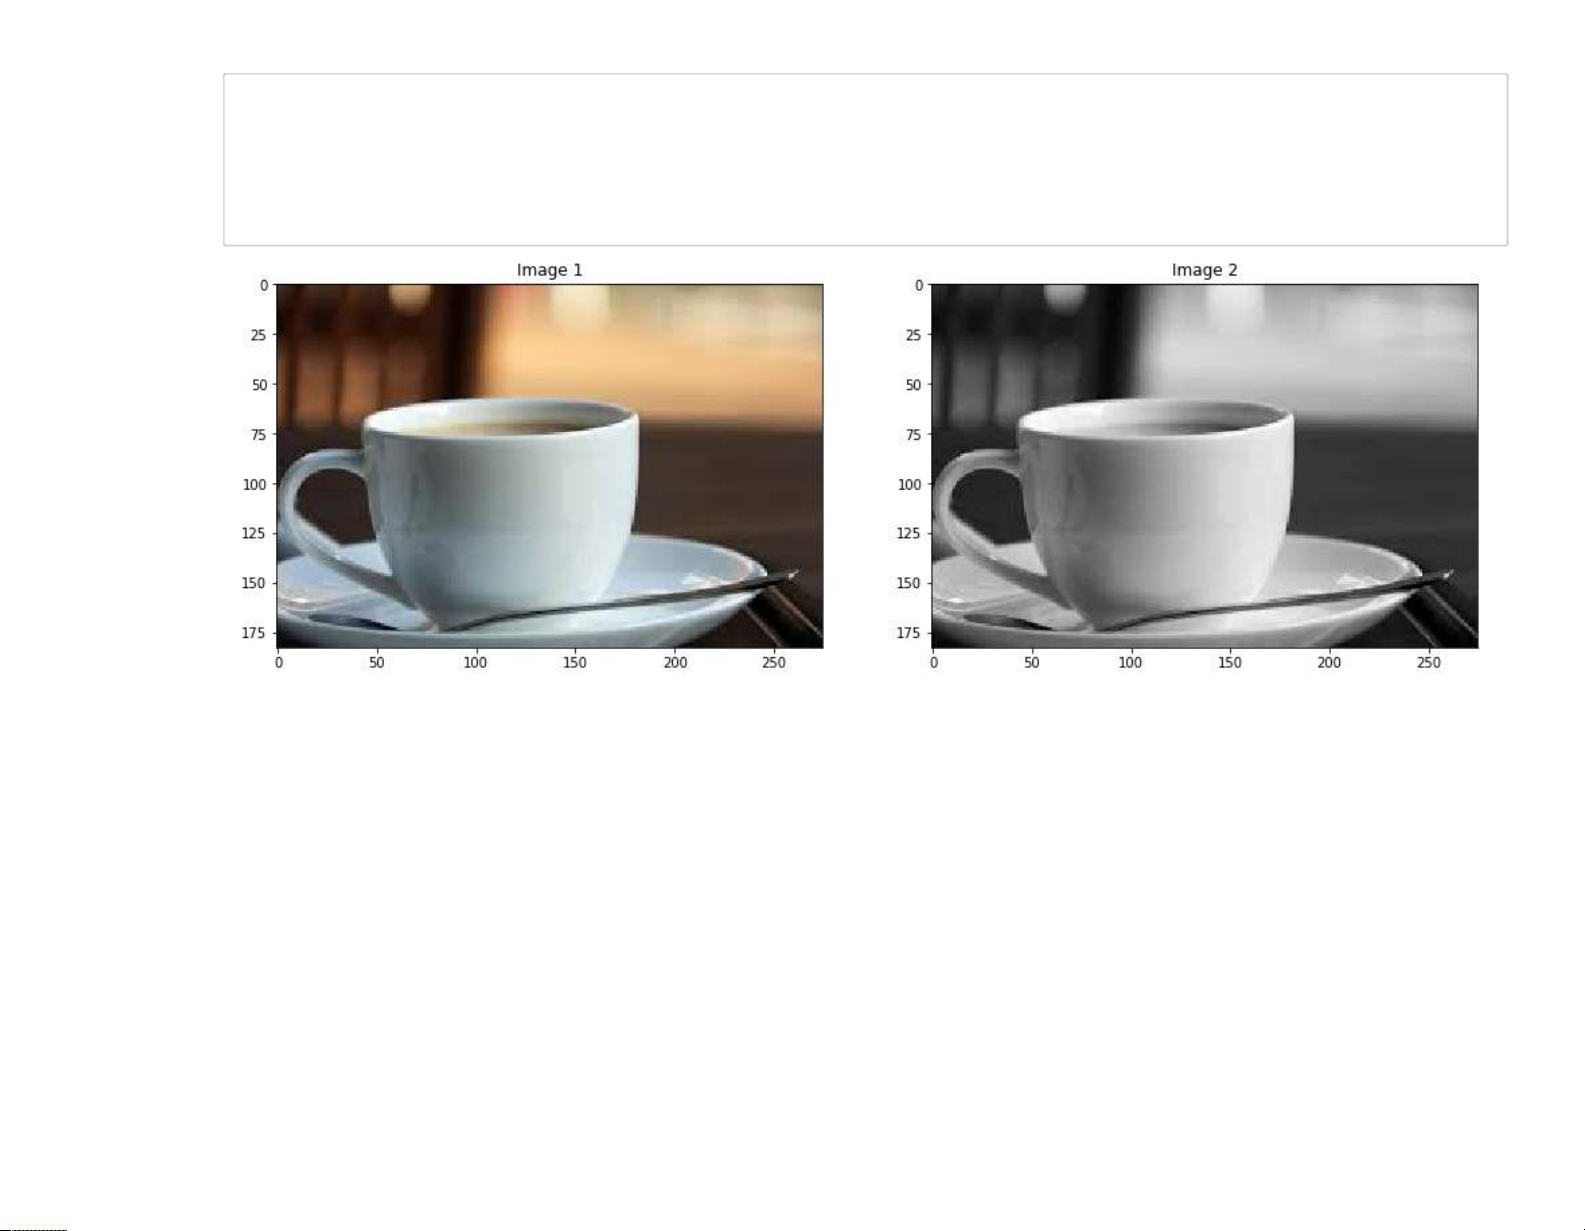
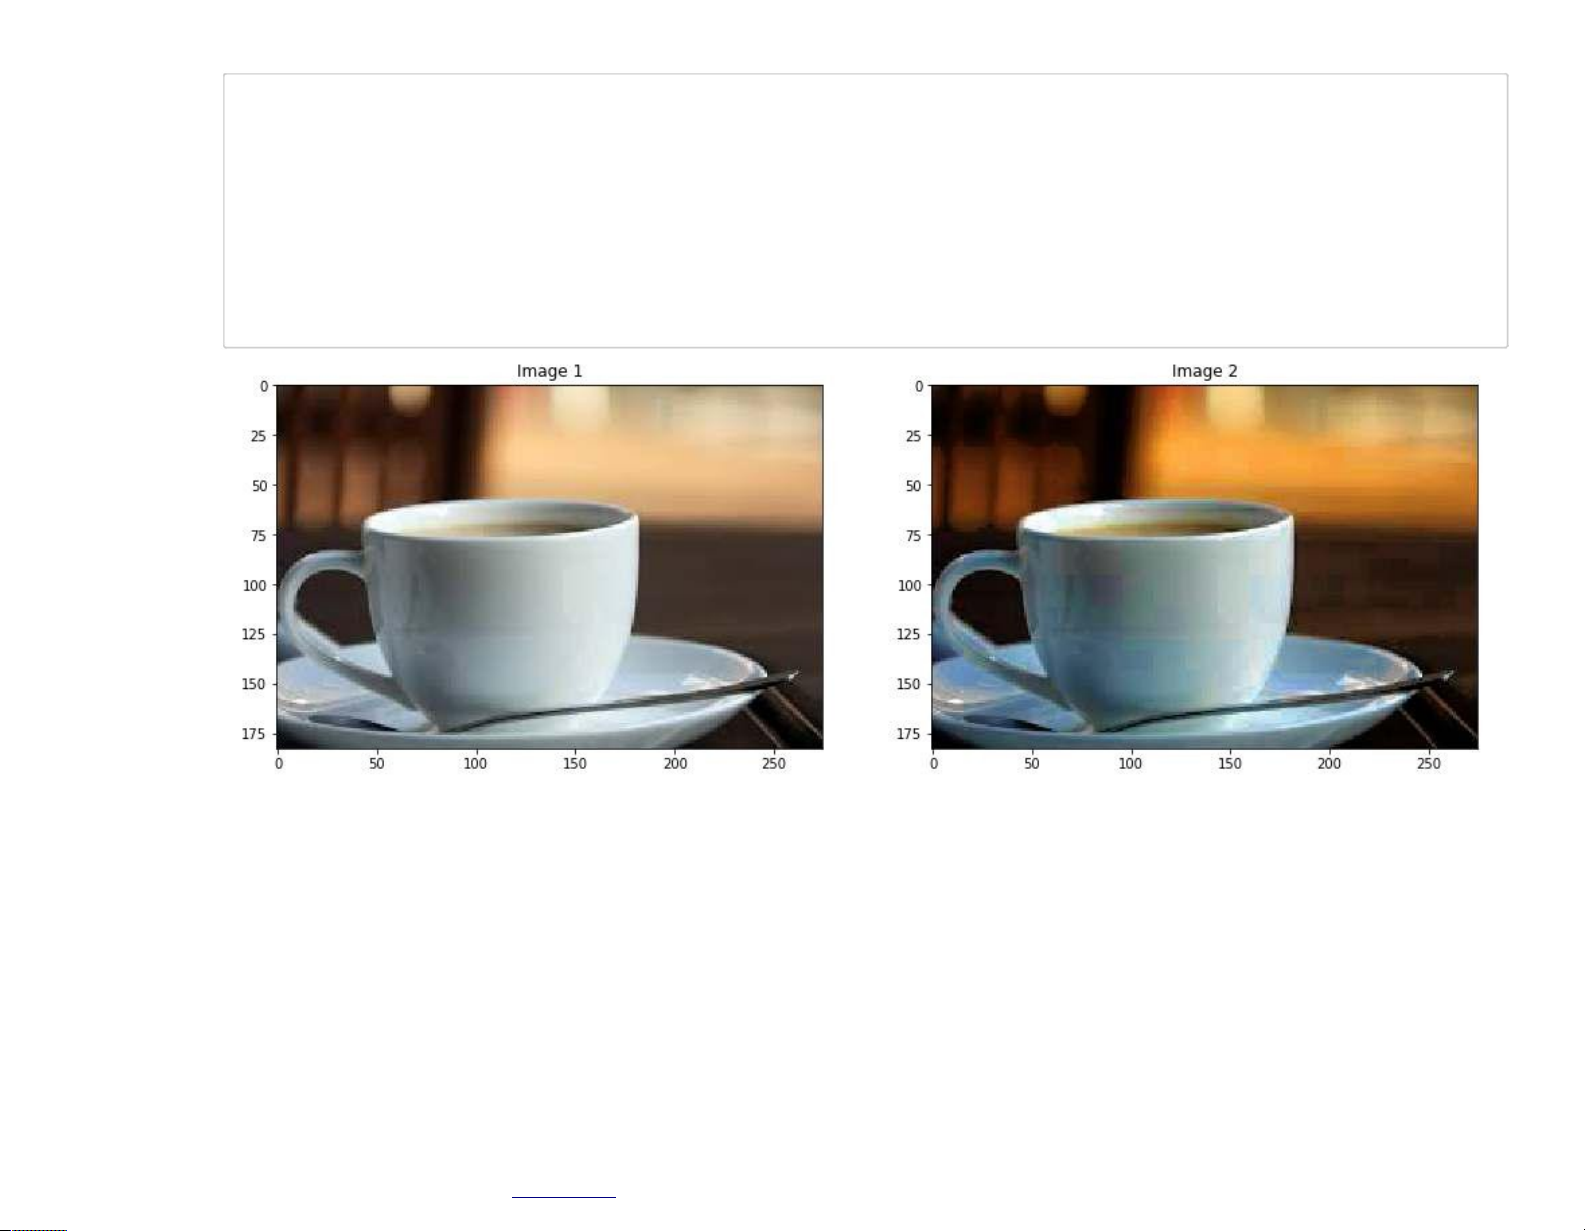
Lab01-Image Processing and Analysis In [51]: # Read Image
image_color = imread("Sample01/coffee.jpg") # Convert Image into Gray
image_gray = cv2.cvtColor(image_color, cv2.COLOR_RGB2GRAY) # Display Image
ShowTwoImages(image_color, image_gray)
file:///C:/Users/Admin/Desktop/Lab01-Image Processing and Analysis.html 16/23 lOMoARcPSD|46342985 27/9/2019
Lab01-Image Processing and Analysis In
# Convert Image into HSV color spaces [60]:
image_hsv = cv2.cvtColor(image_color, cv2.COLOR_RGB2HSV) # Apply histogram
equalization channel = 1
image_hsv[:, :, channel] = cv2.equalizeHist(image_hsv[:, :, channel]) channel = 2
image_hsv[:, :, channel] = cv2.equalizeHist(image_hsv[:, :, channel]) # Convert to RGB
image_enhanced = cv2.cvtColor(image_hsv, cv2.COLOR_HSV2RGB)
ShowTwoImages(image_color, image_enhanced)
file:///C:/Users/Admin/Desktop/Lab01-Image Processing and Analysis.html 17/23 lOMoARcPSD|46342985 27/9/2019
Lab01-Image Processing and Analysis
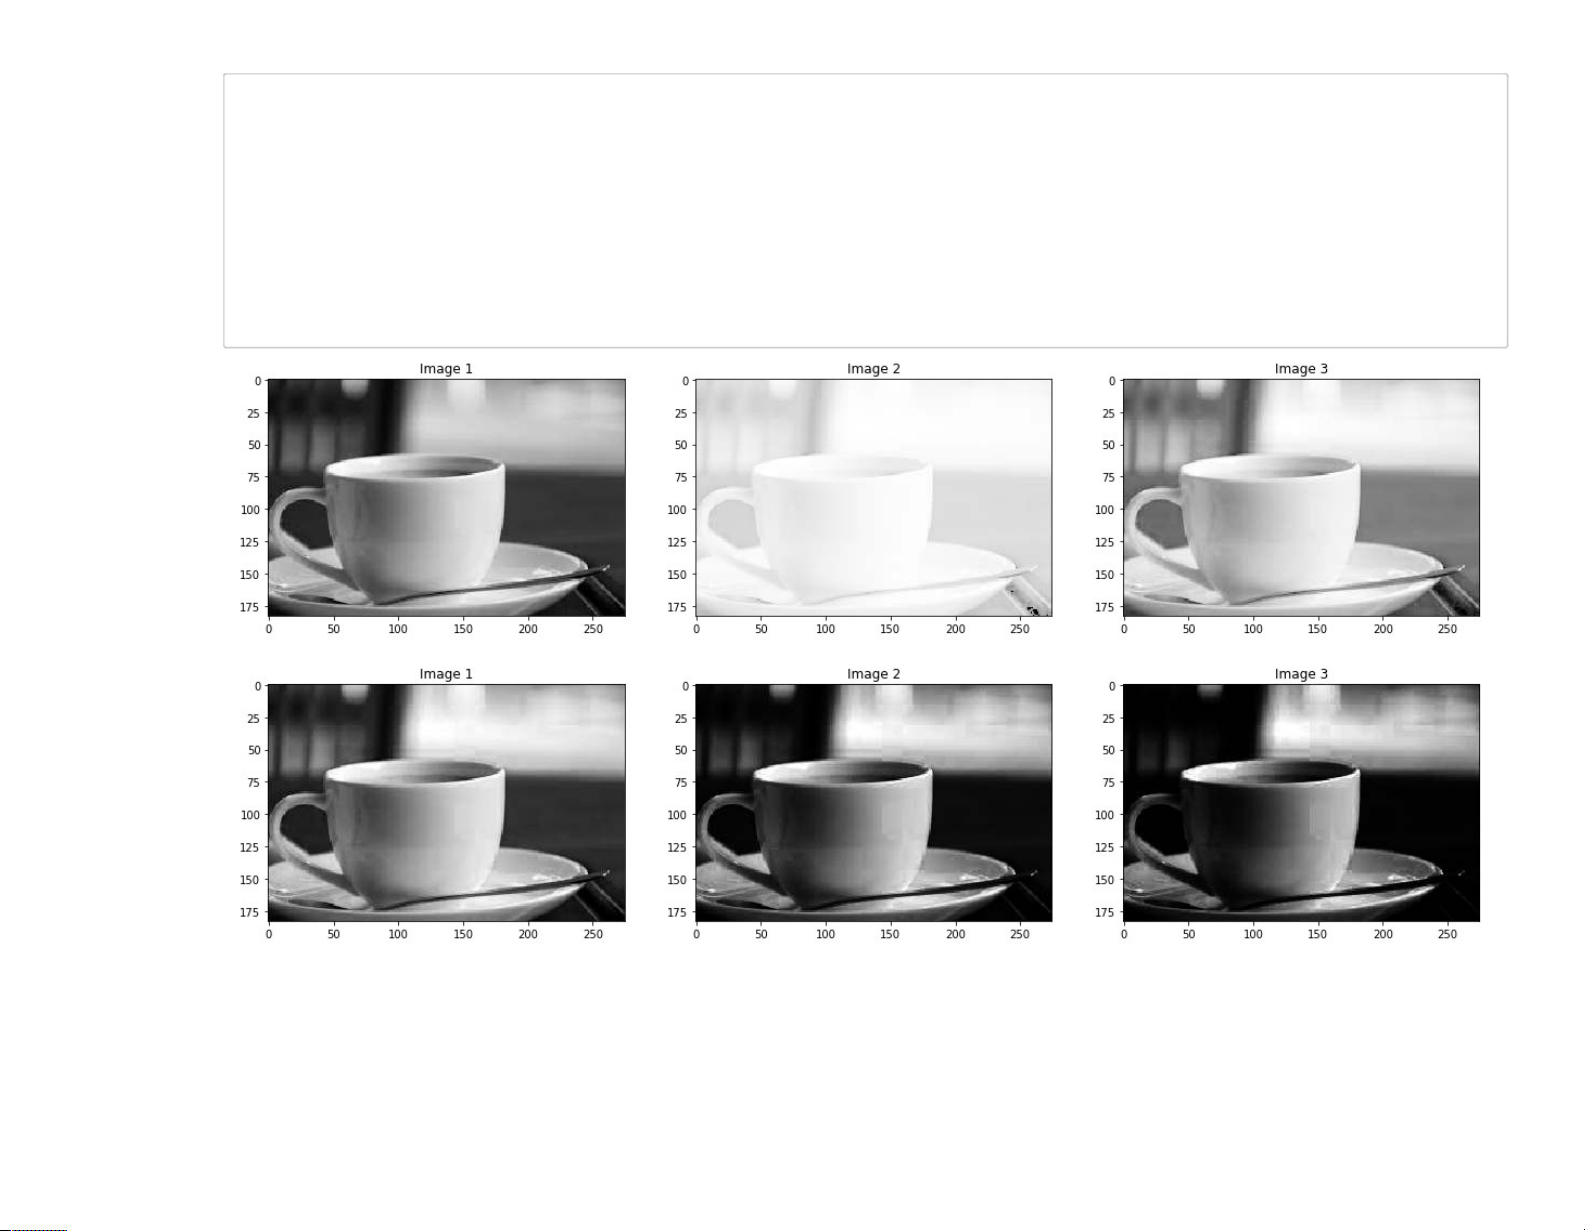
In [73]: image_hsv = cv2.cvtColor(image_color, cv2.COLOR_RGB2HSV) img = image_hsv[:,:,2]
gamma = [0.1, 0.5, 1.2, 2.2, 3.2]
gamma_corrected_01 = np.array(255*(img / 255) ** gamma[0], dtype = 'uint8')
gamma_corrected_02 = np.array(255*(img / 255) ** gamma[1], dtype = 'uint8')
gamma_corrected_03 = np.array(255*(img / 255) ** gamma[2], dtype = 'uint8')
gamma_corrected_04 = np.array(255*(img / 255) ** gamma[3], dtype = 'uint8')
gamma_corrected_05 = np.array(255*(img / 255) ** gamma[4], dtype = 'uint8')
ShowThreeImages(image_gray, gamma_corrected_01, gamma_corrected_02)
ShowThreeImages(gamma_corrected_03, gamma_corrected_04, gamma_corrected_05)
file:///C:/Users/Admin/Desktop/Lab01-Image Processing and Analysis.html 18/23
Tài liệu liên quan:
-
Trắc nghiệm môn Nhập môn khoa học dữ liệu | Trường Đại học Khoa học tự nhiên, Đại học Quốc gia Thành phố Hồ Chí Minh
17 9 -

Sách "Storytelling with Data: Let's Practice!" môn Khoa học dữ liệu | Trường Đại học Khoa học tự nhiên, Đại học Quốc gia Thành phố Hồ Chí Minh
22 11 -
Tài liệu Vật lí đại cương Cơ - Nhiệt - Khoa học dữ liệu | Trường Đại học Khoa học Tự nhiên, Đại học Quốc gia Thành phố Hồ Chí Minh
375 188 -
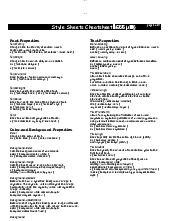
Css cheat sheet in web development - Khoa học dữ liệu | Trường Đại học Khoa học Tự nhiên, Đại học Quốc gia Thành phố Hồ Chí Minh
291 146 -
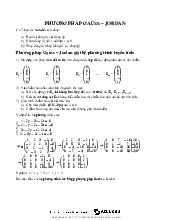
Đại số tuyến tính - Khoa học dữ liệu | Trường Đại học Khoa học Tự nhiên, Đại học Quốc gia Thành phố Hồ Chí Minh
221 111