Practice pie charts môn Tiếng Anh | Học viện Nông nghiệp Việt Nam
The charts below show the proportion of people’s spending ondifferent commodities and services in a particular European country in 1958 and in 2008.Tài liệu giúp bạn tham khảo ôn tập và đạt kết quả cao. Mời bạn đọc đón xem!
Môn: Tiếng Anh (HVNN) 173 tài liệu
Trường: Học viện Nông nghiệp Việt Nam 2.5 K tài liệu
Tác giả:


Preview text:
lOMoAR cPSD| 48599919
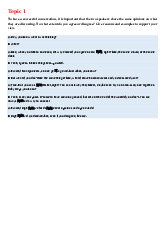
The charts below show the proportion of people’s spending on different
commodities and services in a particular European country in 1958 and in 2008 . 1958 7 22 13 Housing Clothing 8 Entertainme nt Food Travel/trans 18 32 2008 17 Housing 32 Clothing 6 Entertainme nt Food 17 Travel/trans 12 16 Report Plan:
• Part 1: Introduction: show>compare; proportion>percentage;
different>various; commodities>goods
• Part 2: Overview: (1) % spent on housing, food and luxury goods
rose (2) % spent on clothing and travel/transport declined
• Part 3: report figures and compare trends for housing, food and luxury goods
• Part 4: report figures and compare trends for spending on clothing
and travel/transport. Expenditure on entertainment was stable. lOMoAR cPSD| 48599919
Tài liệu liên quan:
-
Writing Level 3 - Adjective Clauses and Sentence Structure
113 57 -
Đề cương ôn tập môn Tiếng Anh | Học viện Nông nghiệp Việt Nam
264 132 -
Nội dung ôn tập cuối học kỳ môn Tiếng Anh | Học viện Nông nghiệp Việt Nam
233 117 -
Speaking GEP 6 môn Tiếng Anh | Học viện Nông nghiệp Việt Nam
241 121 -
Câu hỏi đuôi Tag Question S Vchia, trợ động từ not S? S trợ động từ not V, trợ động từ S? môn Tiếng Anh | Học viện Nông nghiệp Việt Nam
160 80