Prices, Exchange Rates, and Purchasing Power Parity | Tài chính quốc tế | Trường Học Viện nông nghiệp Việt Nam
Chapter 1, The Foreign Exchange Market, discussed the role of foreign exchange market arbitrage in keeping foreign exchange rates the same in different locations. If the dollar price of the yen is higher at Bank of America in San Francisco than at Citibank in NewYork, we would expect traders to buy yen from Citibank and simultaneously sell yen to Bank of America.This activity would raise the dollar/yen exchange rate quoted by Citibank and lower the rate at Bank of America until the exchange rate quotations are transaction costs close. Tài liệu được sưu tầm và soạn thảo dưới dạng file PDF để gửi tới các bạn cùng tham khảo, ôn tập đầy đủ kiến thức, chuẩn bị cho các buổi học thật tốt. Mời bạn đọc đón xem!
Môn: Tài chính quốc tế (hvnn) 130 tài liệu
Trường: Học viện Nông nghiệp Việt Nam 2.4 K tài liệu
Tác giả:
Preview text:
CHAPTER 7 Prices, Exchange Rates,
and Purchasing Power Parity Contents
Absolute Purchasing Power Parity 136 The Big Mac Index 137
Relative Purchasing Power Parity 139 Time, Inflation, and PPP 140 Deviations From PPP 141
Overvalued and Undervalued Currencies 145 Real Exchange Rates 149 Summary 150 Exercises 151 Further Reading 151
Appendix A The Effect on PPP by Relative Price Changes 151
Chapter 1, The Foreign Exchange Market, discussed the role of foreign
exchange market arbitrage in keeping foreign exchange rates the same
in different locations. If the dollar price of the yen is higher at Bank of
America in San Francisco than at Citibank in New York, we would expect
traders to buy yen from Citibank and simultaneously sell yen to Bank of
America. This activity would raise the dollar/yen exchange rate quoted by
Citibank and lower the rate at Bank of America until the exchange rate
quotations are transaction costs close. Such arbitrage activity is not limited
to the foreign exchange market. We would expect arbitrage to be present
in any market where similar goods are traded in different locations. For
instance, the price of gold is roughly the same worldwide at any point in
time. If gold sold at a higher price in one location than in another, arbi-
tragers would buy gold where it is cheap and sell where it is high until the
prices are equal (allowing for transaction costs). Similarly we would expect
the price of tractors or automobiles or sheet steel to be related across geo-
graphically disparate markets. However, there are good economic reasons
why prices for some goods are more similar across countries than others.
Copyright © 2017 Elsevier Inc.
International Money and Finance. All rights reserved. 135 136
International Money and Finance
This tendency for similar goods to sell for similar prices globally pro-
vides a link between prices and exchange rates. If we wanted to know
why exchange rates change over time, one obvious answer is that, as prices
change internationally, exchange rates must also change to keep the prices
measured in a common currency equal across countries. In other words,
exchange rates should adjust to offset differing inflation rates between
countries. This relationship between the prices of goods and services and
exchange rates is known as purchasing power parity (PPP). Although we
are hesitant to refer to PPP as a theory of the exchange rate, for reasons
that will be made apparent shortly, it is important to study the relationship
between price levels and exchange rates in order to understand the role
of goods markets (as distinct from financial asset markets) in international finance.
ABSOLUTE PURCHASING POWER PARITY
Our first view of purchasing power parity (PPP) is absolute PPP. Here we
consider the exchange rate to be given by the ratio of price levels between countries. If
E is the spot exchange rate (domestic currency units per for-
eign unit), P the domestic price index, and PF the foreign price index, the
absolute PPP relation is written as: F P P E / = (7.1)
For those readers who are not familiar with price indexes, P and PF
may be thought of as consumer price indexes or producer price indexes.
A price index is supposed to measure average prices in an economy and
therefore is subject to the criticism that, in fact, it measures the actual
prices faced by no one. To construct such an index, we must first deter-
mine which prices to include—that is, which goods and services are to be
monitored. Then these various items need to be assigned weights reflect-
ing their importance in total spending. Thus the consumer price index
would weight housing prices very heavily, but bread prices would have
only a very small weight. The final index is a weighted average of the
prices of the goods and services surveyed.
Phrased in terms of price indexes, absolute PPP, as given in Eq. (7.1),
indicates that the exchange rate between any two currencies is equal to the
ratio of their price indexes. Therefore the exchange rate is a nominal mag-
nitude, dependent on prices. We should be careful when using real-world
price index data that the various national price indexes are comparable in
Prices, Exchange Rates, and Purchasing Power Parity 137
terms of goods and services covered as well as base year (the reference year
used for comparisons over time). If changes in the world were only nomi-
nal, then we would expect PPP to hold if we had true price indexes. The
significance of this last sentence will be illustrated soon. Eq. (7.1) can be rewritten as P EP F = (7.2)
so that the domestic price level is equal to the product of the domestic
currency price of foreign currency and the foreign price level. Eq. (7.2)
is called the law of one price and indicates that goods sell for the same
price worldwide. For instance, we might observe a shirt selling for $10 in
the United States and £4 in the United Kingdom. If the $/£ exchange
rate is $2.50 per pound, then P = EPF = (2.50)(4) = 10. Thus the price of
the shirt in the United Kingdom is the same as the US price, once we use
the exchange rate to convert the pound price into dollars and compare prices in a common currency.
Unfortunately, for this analysis, the world is more complex than the
simple shirt example. The real world is characterized by differentiated
products, costly information, and all sorts of impediments to the equaliza-
tion of goods prices worldwide. Certainly the more homogeneous goods
are, the more we expect the law of one price to hold. Some commodi-
ties, which retain essentially the same form worldwide, provide the best
examples of the law of one price. Gold, for instance, is quoted in dollar
prices internationally, and so we would be correct in stating that the law
of one price holds quite closely for gold. However, shirts come in different
styles, brand names, and prices, and we do not expect the law of one price
to hold domestically for shirts, letalone internationally. THE BIG MAC INDEX
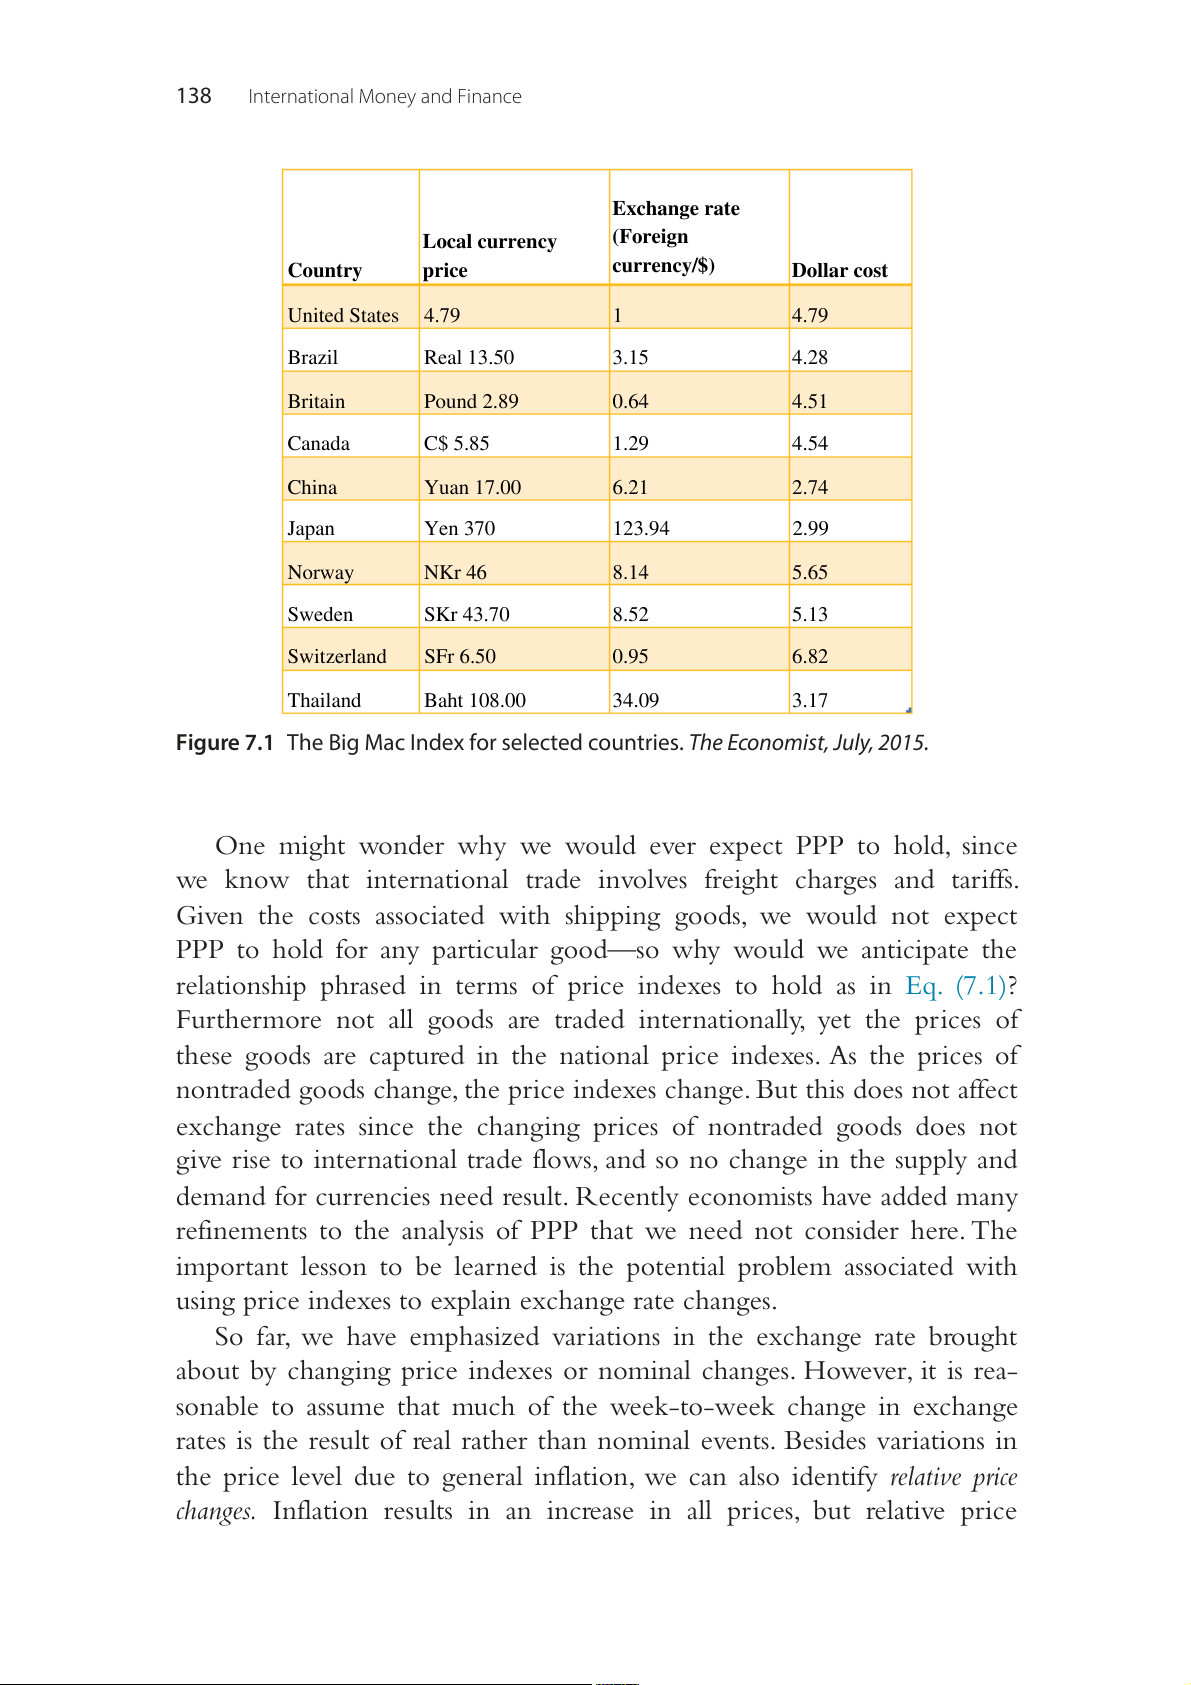
Fig. 7.1 illustrates how a Big Mac is priced differently in different coun-
tries. The first column shows the price in local currency and the third col-
umn shows the implied price in dollars. The figure indicates the cost of
a Big Mac varies drastically across countries. In China a Big Mac costs
the equivalent of $2.74, much less than the $4.79 a Big Mac costs in
the United States. In contrast a Big Mac costs the equivalent of $6.82 in
Switzerland. If you have traveled extensively abroad you are aware that
wide discrepancies exist between prices of similar products and services across countries. 138
International Money and Finance Exchange rate Local currency (Foreign Country price currency/$) Dollar cost United States 4.79 1 4.79 Brazil Real 13.50 3.15 4.28 Britain Pound 2.89 0.64 4.51 Canada C$ 5.85 1.29 4.54 China Yuan 17.00 6.21 2.74 Japan Yen 370 123.94 2.99 Norway NKr 46 8.14 5.65 Sweden SKr 43.70 8.52 5.13 Switzerland SFr 6.50 0.95 6.82 Thailand Baht 108.00 34.09 3.17
Figure 7.1 The Big Mac Index for selected countries. The Economist, July, 2015.
One might wonder why we would ever expect PPP to hold, since
we know that international trade involves freight charges and tariffs.
Given the costs associated with shipping goods, we would not expect
PPP to hold for any particular good—so why would we anticipate the
relationship phrased in terms of price indexes to hold as in Eq. (7.1)?
Furthermore not all goods are traded internationally, yet the prices of
these goods are captured in the national price indexes. As the prices of
nontraded goods change, the price indexes change. But this does not affect
exchange rates since the changing prices of nontraded goods does not
give rise to international trade flows, and so no change in the supply and
demand for currencies need result. Recently economists have added many
refinements to the analysis of PPP that we need not consider here. The
important lesson to be learned is the potential problem associated with
using price indexes to explain exchange rate changes.
So far, we have emphasized variations in the exchange rate brought
about by changing price indexes or nominal changes. However, it is rea-
sonable to assume that much of the week-to-week change in exchange
rates is the result of real rather than nominal events. Besides variations in
the price level due to general inflation, we can also identify relative price
changes. Inflation results in an increase in all prices, but relative price
Prices, Exchange Rates, and Purchasing Power Parity 139
changes indicate that not all prices move together. Some prices increase
faster than others, and some rise while others fall. An old analogy that stu-
dents often find useful is to think of inflation as an elevator carrying a load
of tennis balls, which represent the prices of individual goods. As the infla-
tion continues, the balls are carried higher by the elevator, which means
that all prices are rising. But as the inflation continues and the elevator
rises, the balls, or individual prices, are bouncing up and down. So while
the elevator raises all the balls inside, the balls do not bounce up and down
together. The balls bouncing up have their prices rising relative to the balls going down.
If we think of different elevators as representing different countries,
then if the balls were still while the elevators rose at the same rate, the
exchange rate would be constant, as suggested by PPP. Moreover, if we
looked at sufficiently long intervals, we could ignore the bouncing balls,
since the large movements of the elevators would dominate the exchange
rate movements. If, however, we observed very short intervals during
which the elevators move only slightly, we would find that the bouncing
balls, or relative price changes of individual goods, would largely deter- mine the exchange rate.
RELATIVE PURCHASING POWER PARITY
There is an alternative view of PPP besides the absolute PPP just dis-
cussed. Relative PPP is said to hold when ˆ E ˆ P ˆ P F = − (7.3)
where a hat (^) over a variable denotes percentage change. So Eq. (7.3)
says that the percentage change in the exchange rate (E) is equal to the
percentage change in the domestic price level (P) minus the percentage
change in the foreign price level (PF) Therefore although absolute PPP
states that the exchange rate is equal to the ratio of the price indexes, rela-
tive PPP deals with percentage changes in these variables.
We usually refer to the percentage change in the price level as the rate
of inflation. So another way of stating the relative PPP relationship is by
saying that the percentage change in the exchange rate is equal to the
inflation differential between the domestic and foreign country. If we say
that the percentage change in the exchange rate is equal to the inflation
differential, then we can ignore the actual levels of E, P, and PF and con-
sider the changes, which is not so strong an assumption as absolute PPP. 140
International Money and Finance
It should be noted that, if absolute PPP holds, then relative PPP will also
hold. But if absolute PPP does not hold, relative PPP still may. This is so
because the level of E may not equal P/PF, but the change in E could still
equal the inflation differential.
Having observed in the preceding section how relative prices can
determine exchange rates, we can, with reason, believe that over time
these relative price changes will decrease in importance compared to
inflation rates, so that in the long run inflation differentials will dominate
exchange rate movements. The idea is that the real events that cause rela-
tive price movements are often random and short run in nature. By ran-
dom, we mean they are unexpected and equally likely to raise or lower
the exchange rate. Given this characterization, it follows that these random
relative price movements will tend to cancel out over time (otherwise, we
would not consider them equally likely to raise or lower ) E .
TIME, INFLATION, AND PPP
Several researchers have found that PPP holds better for high-inflation
countries. When we say “holds better,” we mean that the equalities stated
in Eqs. (7.1) and (7.2) are more closely met by actual exchange rate and
price level data observed over time in high-inflation countries com-
pared to low-inflation countries. In high-inflation countries, changes in
exchange rates are highly correlated with inflation differentials because the
sheer magnitude of inflation overwhelms the relative price effects, whereas
in low- or moderate-inflation countries the relative price effects dominate
exchange rate movements and lead to discrepancies from PPP. In terms of
our earlier example, when the elevator is moving faster (high inflation),
the movement of the balls inside (relative prices) is less important; how-
ever, when the elevator is moving slowly (low inflation), the movement of
the bouncing balls is quite important.
Besides the rate of inflation, the period of time analyzed has an effect
on how well PPP holds. We expect PPP to hold better for annual data
than for monthly data, since the longer time frame allows for more infla-
tion. Thus random relative price effects are less important, and we find
exchange rate changes closely related to inflation differentials. Using the
elevator analogy, the longer the time frame analyzed, the farther the eleva-
tor moves, and the more the elevator moves, the less important will be the
balls inside. This suggests that studies of PPP covering many years are more
likely to yield evidence of PPP than studies based on a few years’ data.
Prices, Exchange Rates, and Purchasing Power Parity 141
The literature on PPP is voluminous and tends to confirm the conclu-
sions we have made. Researchers have presented evidence that relative price
shifts can have an important role in the short run, but over time the random
nature of the relative price changes reduces the importance of these unrelated
events. Investigations over long periods of time (100 years, for instance) have
concluded that PPP holds better in the long run. DEVIATIONS FROM PPP
So far, the discussion has included several reasons why deviations from
PPP occur. When discussing the role of arbitrage in goods markets, it was
said that the law of one price would not apply to differentiated products
or products that are not traded internationally. Furthermore since inter-
national trade involves shipping goods across national borders, prices may
differ because of shipping costs or tariffs. Relative price changes can also
be a reason why PPP would hold better in the long run than the short
run. Such relative price changes result from real economic events, like
changing tastes, bad weather, or government policy. The Appendix A pro-
vides further details on how relative prices can affect the PPP.
Since consumers in different countries consume different goods, price
indexes are not directly comparable internationally. We know that evaluat-
ing PPP between the United States and Japan using the US and Japanese
consumer price indexes is weakened by the fact that the typical Japanese
consumer buys a different basket of goods than the typical US consumer.
In this case the law of one price could hold perfectly for individual goods,
yet we would observe deviations from PPP using the consumer price
index for Japan and the United States.
It is important to realize that PPP is not a theory of exchange rate
determination. In other words inflation differentials do not cause exchange
rate change. PPP is an equilibrium relationship between two endogenous
variables. When we say that prices and exchange rates are endogenous,
we mean that they are simultaneously determined by other factors. The
other factors are called exogenous variables. Exogenous variables may
change independently, as with bad weather or government policy. Given a
change in an exogenous variable, as with poor weather and a consequent
poor harvest, both prices and exchange rates will change. Deviations in
measured PPP will occur if prices and exchange rates change at different
speeds. Evidence suggests that following some exogenous shock, changes in
exchange rates precede changes in prices. 142
International Money and Finance
Such a finding can be explained by theorizing that the price indexes
used for PPP calculations move slowly because commodity prices are not as
flexible as financial asset prices (the exchange rate is the price of monies).
We know that exchange rates vary throughout the day as the demand and
supply for foreign exchange vary. But how often does the department
store change the price of furniture, or how often does the auto parts store
change the price of tires? Since the prices that enter into published price
indexes are slower to adjust than are exchange rates, it is not surprising
that exchange rate changes seem to lead price changes. Yet if exchange
rates change faster than goods prices, then we have another reason why
PPP should hold better in the long run than in the short run. When eco-
nomic news is received, both exchange rates and prices may change. For
instance suppose the Federal Reserve announces today that it will pro-
mote a 100% increase in the US money supply over the next 12 months.
Such a change would cause greater inflation because more money in
circulation leads to higher prices. The dollar would also fall in value rela-
tive to other currencies because the supply of dollars rises relative to the demand.
Following the Fed’s announcement, would you expect goods prices
in the United States to rise before the dollar depreciates on the foreign
exchange market? While there are some important issues in exchange
rate determination that must wait until later chapters, we generally can
say here that the dollar would depreciate immediately following the
announcement. If traders believe that the dollar will be worth less in the
future, they will attempt to sell dollars now, and this selling activity drives
down the dollar’s value today. There should be some similar forces at work
in the goods market as traders expecting higher prices in the future buy
more goods today. But for most goods, the immediate short-run result will
be a depletion of inventories at constant prices. Only over time will most goods prices rise.
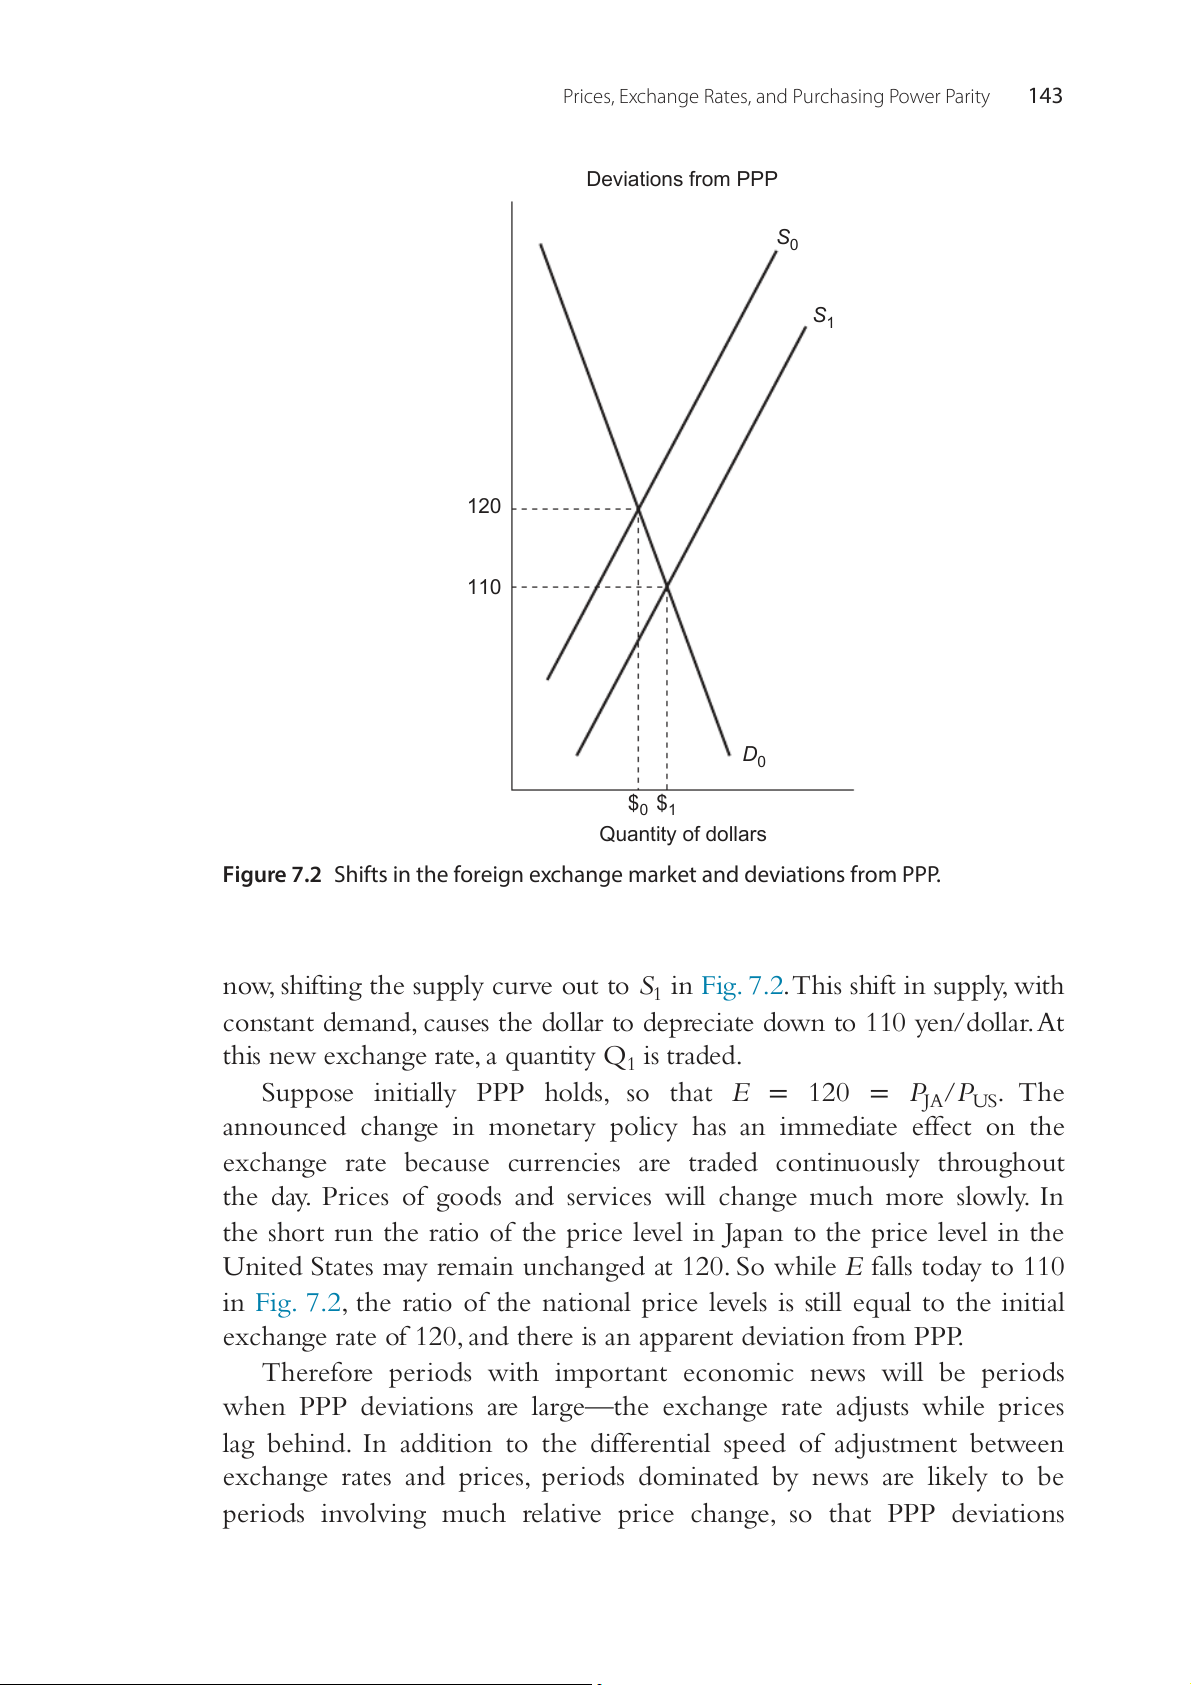
Fig. 7.2 illustrates how the exchange rate will shift with news. The figure
illustrates the quantity of dollars bought and sold on the horizontal axis and
the yen price of the dollar on the vertical axis. Initially the foreign exchange
market equilibrium occurs where the demand curve, D , intersects the sup- 0
ply curve, S , at an exchange rate of 120 yen/dollar with quantity Q of 0 0
dollars being bought and sold. Suppose the Federal Reserve now issues a
statement causing people to expect the US money supply to grow more
rapidly in the future. This causes foreign exchange traders to expect the dol-
lar to depreciate in the future. As a result, they attempt to sell more dollars
Prices, Exchange Rates, and Purchasing Power Parity 143 Deviations from PPP S0 S1 S U/P JA P = te ra e g n a 120 xch r e lla 110 o /d n e Y D0 $0 $1 Quantity of dollars
Figure 7.2 Shifts in the foreign exchange market and deviations from PPP.
now, shifting the supply curve out to S1 in Fig. 7.2. This shift in supply, with
constant demand, causes the dollar to depreciate down to 110 yen/dollar. At
this new exchange rate, a quantity Q is traded. 1
Suppose initially PPP holds, so that E = = 120 PJA/PUS. The
announced change in monetary policy has an immediate effect on the
exchange rate because currencies are traded continuously throughout
the day. Prices of goods and services will change much more slowly. In
the short run the ratio of the price level in Japan to the price level in the
United States may remain unchanged at 120. So while E falls today to 110
in Fig. 7.2, the ratio of the national price levels is still equal to the initial
exchange rate of 120, and there is an apparent deviation from PPP.
Therefore periods with important economic news will be periods
when PPP deviations are large—the exchange rate adjusts while prices
lag behind. In addition to the differential speed of adjustment between
exchange rates and prices, periods dominated by news are likely to be
periods involving much relative price change, so that PPP deviations 144
International Money and Finance
would tend to appear even without exchange rates and prices changing at different speeds.
Deviations from PPP are also likely because international trade
involves lags between order and delivery. Prices are often set by contract
today for goods that are to be delivered several months later. If we com-
pare goods prices and exchange rates today to evaluate PPP, we are using
the exchange rate applicable to goods delivered today with prices that
were set some time in the past. Ideally we should compare contract prices
in each country at the time contracts are signed with the exchange rate
that is expected to prevail in the future period when goods are actually
delivered and payment is made. If the exchange rate actually realized in
the future period is the same as that expected when the goods prices were
agreed upon, then there would be no problem in using today’s exchange
rate and today’s delivered goods prices. The problem is that, realistically,
exchange rates are very difficult to forecast, so that seldom would today’s
realized exchange rate be equal to the trader’s forecast at some past period.
Let us consider a simple example. Suppose that on September 1,
Mr.U.S. agrees to buy books from Ms. U.K. for £1 per book. At the time
the contract is signed, books in the United States sell for $2, and the cur- rent exchange rate of E
2 ensures that the law of one price holds—a $/£ =
£1 book from the United Kingdom is selling for the dollar equivalent of
$2 (the pound book price of 1 times the dollar price of the pound of $2).
If the contract calls for delivery and payment on December 1 of £1 per
book and Mr. U.S. expects the exchange rate and prices to be unchanged
until December 1, he expects PPP to hold at the time the payment is due.
Suppose that on December 1, the actual exchange rate is £1 = $1.50.
An economist researching the law of one price for books would compare
book prices of £1 and $2 with the exchange rate of E 1.50, and $/£ = examine if E = P
. Since 1.50 2/1, he would conclude that $/£ US/PUK <
there are important deviations from PPP. Yet these deviations are spurious.
At the time the prices were set, PPP was expected to hold. We generate
the appearance of PPP deviations by comparing exchange rates today with
prices that were set in the past.
The possible explanations for deviations from PPP include factors
that would suggest permanent deviations (shipping costs and tariffs), fac-
tors that would produce temporary deviations (differential speed of adjust-
ment between financial asset markets and goods markets, or real relative
price changes), and factors that cause the appearance of deviations where
none may actually exist (comparing current exchange rates with prices
Prices, Exchange Rates, and Purchasing Power Parity 145
set in the past or using national price indexes when countries consume
different baskets of goods). Since PPP measurements convey information
regarding the relative purchasing power of currencies, such measurements
have served as a basis for economic policy discussions. The next section
will provide an example of policy-related information contained in PPP measurement.
OVERVALUED AND UNDERVALUED CURRENCIES
If we observe E, P, and PF over time, we find that the absolute PPP rela-
tionship does not hold very well for any pair of countries. If, over time,
PF rises faster than P, then we would expect ,
E the domestic currency
price of the foreign currency, to fall. If
E does not fall by the amount sug-
gested by the lower P/PF, then we could say that the domestic currency is
undervalued or (the same thing) that the foreign currency is overvalued.
In the early 1980s there was much talk of an overvalued dollar. The
foreign exchange value of the dollar appeared to be too high relative to
the inflation differentials between the United States and the other devel-
oped countries. The term overvalued suggests that the exchange rate is not
where it should be yet. However, if the free-market supply and demand
factors are determining the exchange rate, then the overvalued exchange
rate is actually the free-market equilibrium rate. This means that the term
overvalued might suggest that this equilibrium is merely a temporary
deviation from PPP, and over time the exchange rate will fall in line with the inflation differential.
In the early 1980s the foreign exchange price of the dollar grew at
a faster rate than the inflation differential between the other industrial
nations and the United States. It appears, then, that for more than 4 years,
a dollar overvaluation developed. Not until 1985 did the exchange rate
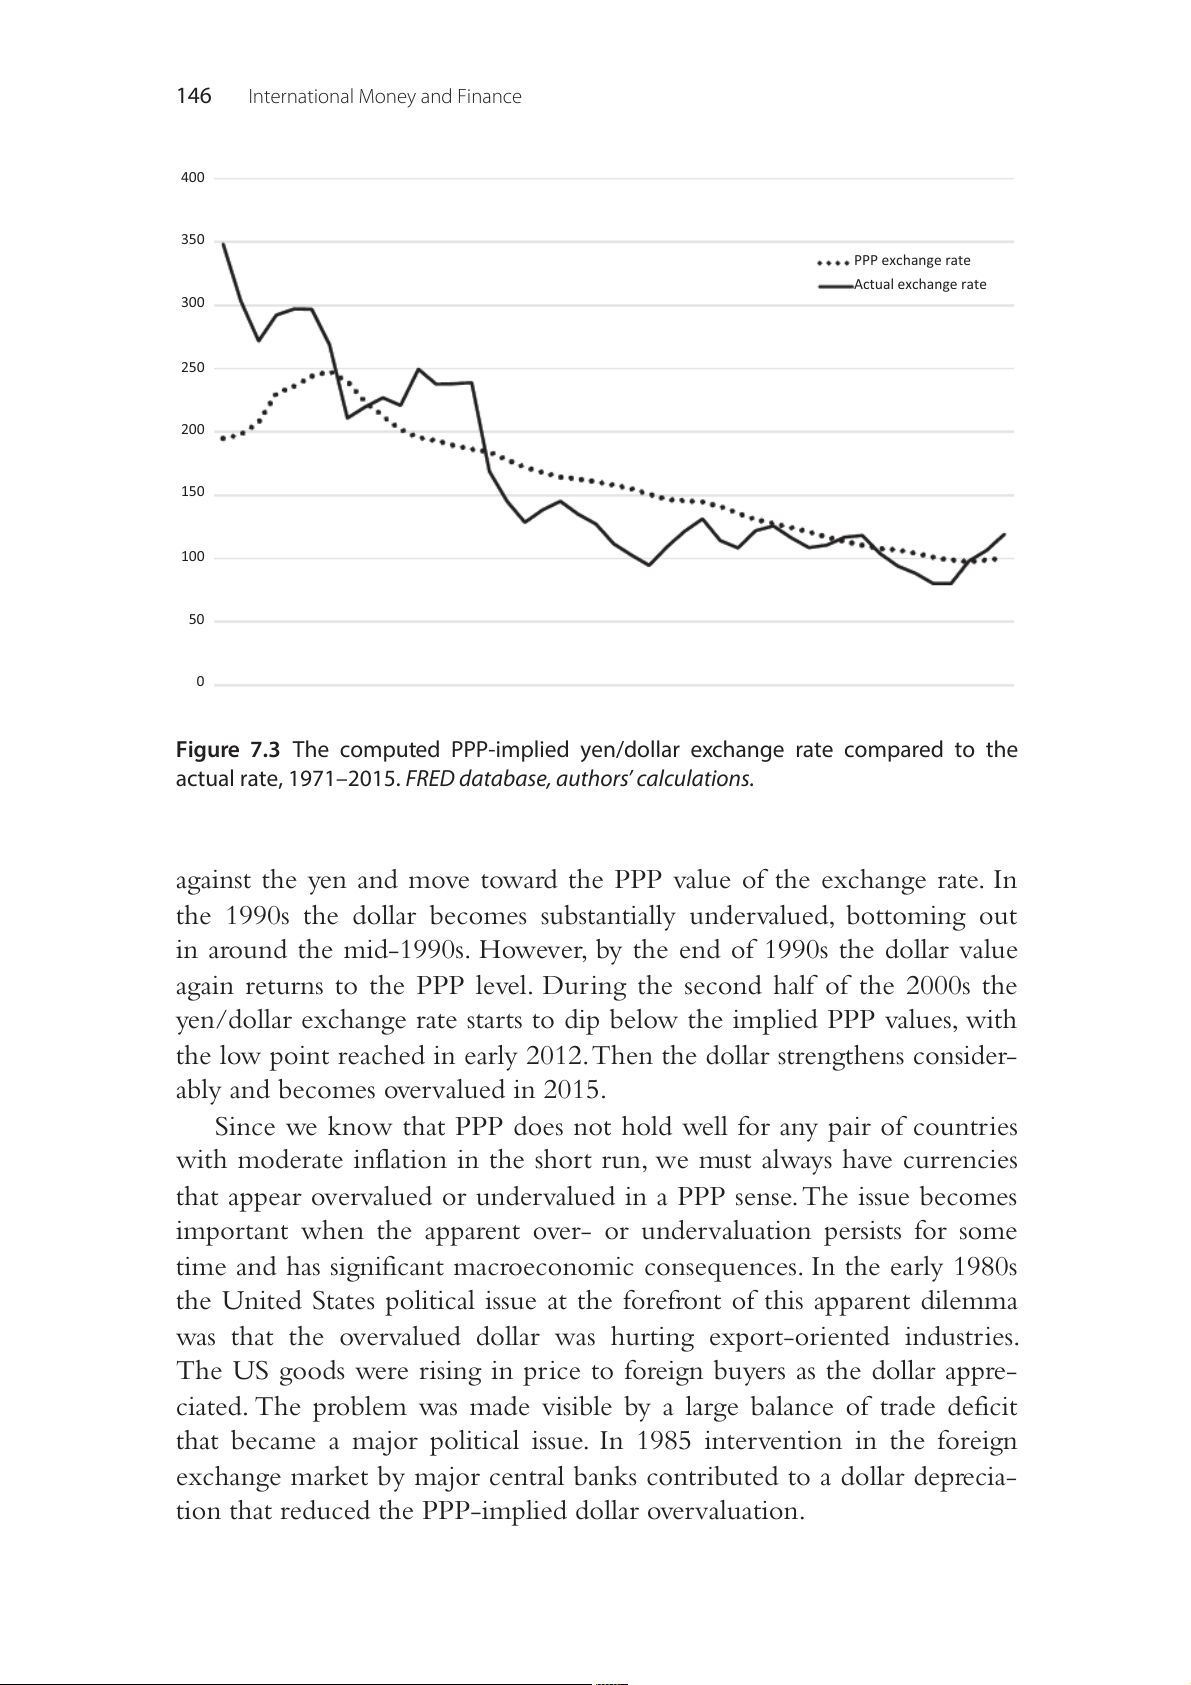
begin to return to a level consistent with PPP. Fig. 7.3 illustrates the actual
level of the yen/dollar exchange rate and the implied PPP exchange rate
of the yen/dollar. The implied PPP exchange rate is measured by the
inflation rate differential between Japan and the United States. The line
labeled “PPP exchange rate” measures the values the exchange rate would
take if the percentage change in the exchange rate equaled the inflation
differential between Japan and the United States.
Fig. 7.3 shows that the dollar appears to be overvalued in the early
1980s, in that the actual exchange rate is above that implied by PPP as
measured by inflation differentials. By 1985 the dollar begins to depreciate 146
International Money and Finance 400 350 PPP exchange rate Actual exchange rate 300 250 200 150 100 50 0 1 2 3 4 5 6 7 8 9 0 1 2 3 4 5 6 7 8 9 0 1 2 3 4 5 6 7 8 9 0 1 2 3 4 5 6 7 8 9 0 1 2 3 4 5 7 7 7 7 7 7 7 7 7 8 8 8 8 8 8 8 8 8 8 9 9 9 9 9 9 9 9 9 9 0 0 0 0 0 0 0 0 0 0 1 1 1 1 1 1 9 9 9 9 9 9 9 9 9 9 9 9 9 9 9 9 9 9 9 9 9 9 9 9 9 9 9 9 9 0 0 0 0 0 0 0 0 0 0 0 0 0 0 0 0 1 1 1 1 1 1 1 1 1 1 1 1 1 1 1 1 1 1 1 1 1 1 1 1 1 1 1 1 1 2 2 2 2 2 2 2 2 2 2 2 2 2 2 2 2
Figure 7.3 The computed PPP-implied yen/dollar exchange rate compared to the
actual rate, 1971–2015. FRED database, authors’ calculations.
against the yen and move toward the PPP value of the exchange rate. In
the 1990s the dollar becomes substantially undervalued, bottoming out
in around the mid-1990s. However, by the end of 1990s the dollar value
again returns to the PPP level. During the second half of the 2000s the
yen/dollar exchange rate starts to dip below the implied PPP values, with
the low point reached in early 2012. Then the dollar strengthens consider-
ably and becomes overvalued in 2015.
Since we know that PPP does not hold well for any pair of countries
with moderate inflation in the short run, we must always have currencies
that appear overvalued or undervalued in a PPP sense. The issue becomes
important when the apparent over- or undervaluation persists for some
time and has significant macroeconomic consequences. In the early 1980s
the United States political issue at the forefront of this apparent dilemma
was that the overvalued dollar was hurting export-oriented industries.
The US goods were rising in price to foreign buyers as the dollar appre-
ciated. The problem was made visible by a large balance of trade deficit
that became a major political issue. In 1985 intervention in the foreign
exchange market by major central banks contributed to a dollar deprecia-
tion that reduced the PPP-implied dollar overvaluation.
Prices, Exchange Rates, and Purchasing Power Parity 147
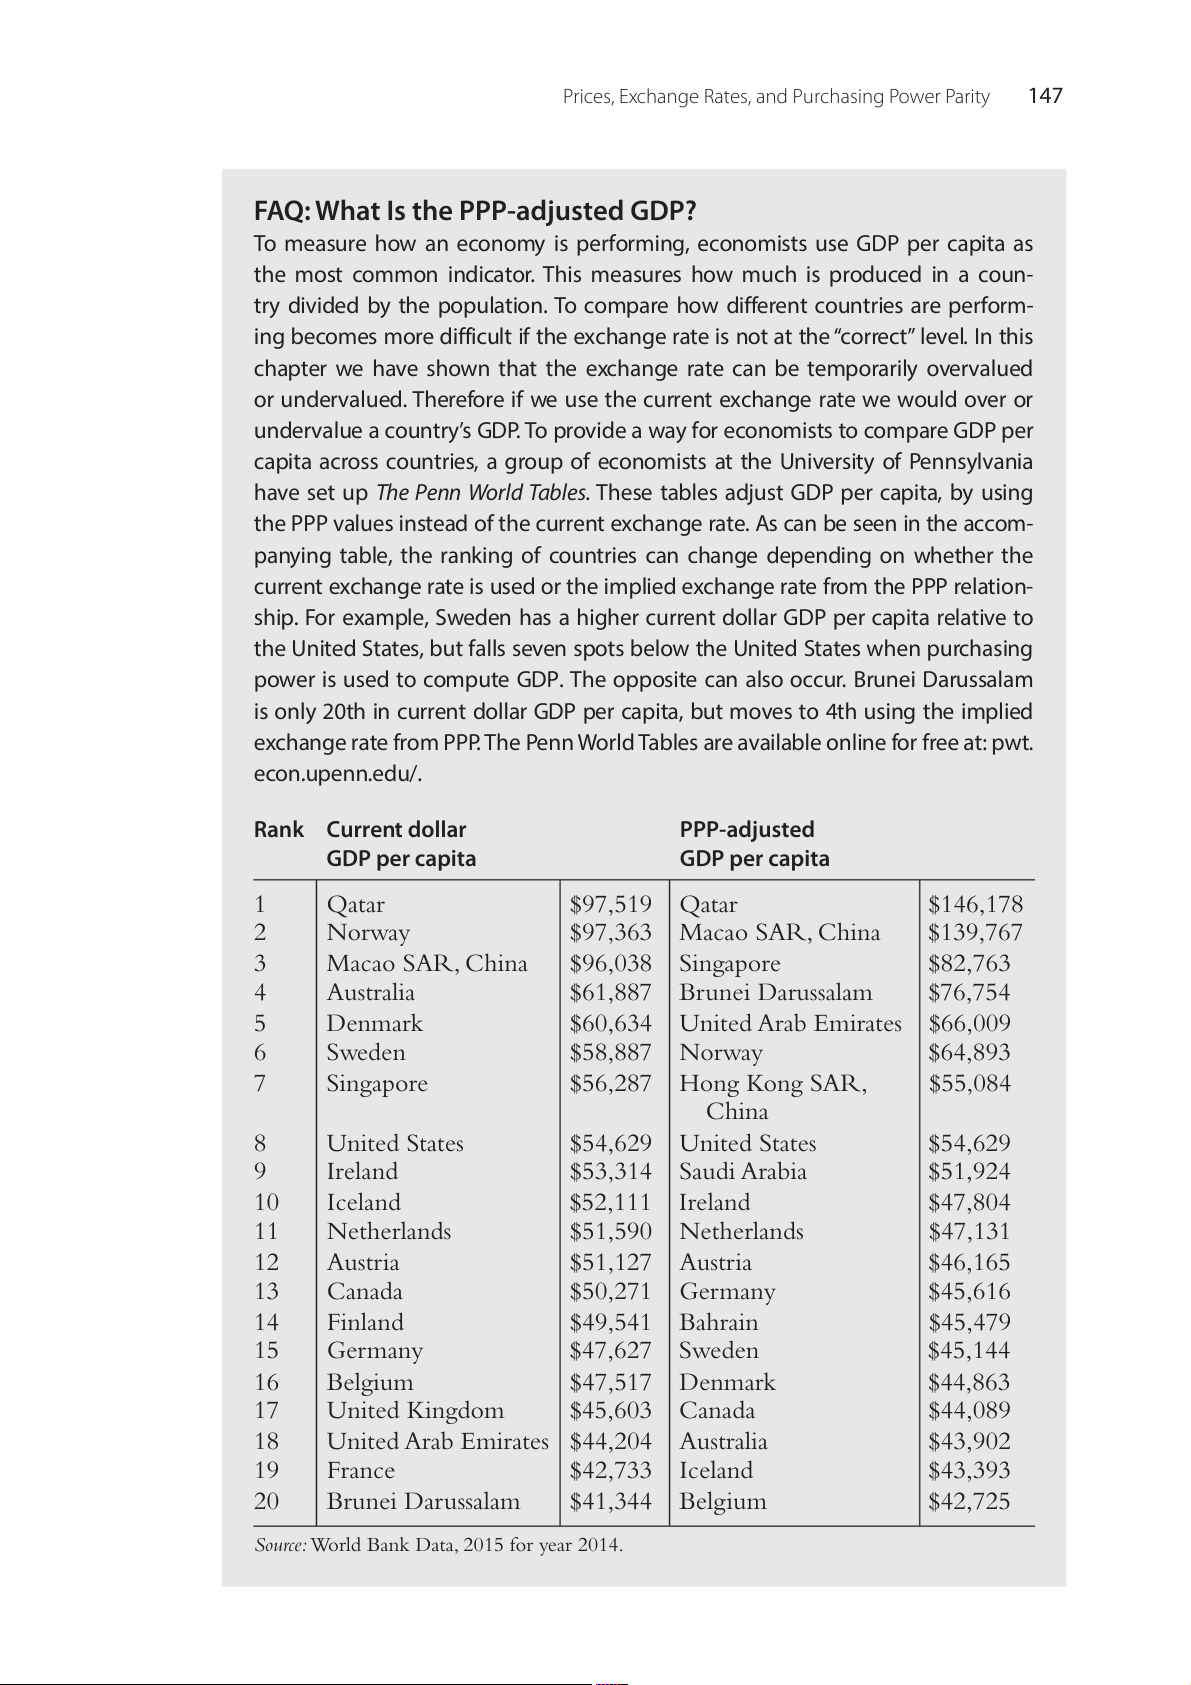
FAQ: What Is the PPP-adjusted GDP?
To measure how an economy is performing, economists use GDP per capita as
the most common indicator. This measures how much is produced in a coun-
try divided by the population. To compare how different countries are perform-
ing becomes more difficult if the exchange rate is not at the “correct” level. In this
chapter we have shown that the exchange rate can be temporarily overvalued
or undervalued. Therefore if we use the current exchange rate we would over or
undervalue a country’s GDP. To provide a way for economists to compare GDP per
capita across countries, a group of economists at the University of Pennsylvania
have set up The Penn World Tables. These tables adjust GDP per capita, by using
the PPP values instead of the current exchange rate. As can be seen in the accom-
panying table, the ranking of countries can change depending on whether the
current exchange rate is used or the implied exchange rate from the PPP relation-
ship. For example, Sweden has a higher current dollar GDP per capita relative to
the United States, but falls seven spots below the United States when purchasing
power is used to compute GDP. The opposite can also occur. Brunei Darussalam
is only 20th in current dollar GDP per capita, but moves to 4th using the implied
exchange rate from PPP. The Penn World Tables are available online for free at: pwt. econ.upenn.edu/. Rank Current dollar PPP-adjusted GDP per capita GDP per capita 1 Qatar $97,519 Qatar $146,178 2 Norway $97,363 Macao SAR, China $139,767 3 Macao SAR, China $96,038 Singapore $82,763 4 Australia $61,887 Brunei Darussalam $76,754 5 Denmark $60,634 United Arab Emirates $66,009 6 Sweden $58,887 Norway $64,893 7 Singapore $56,287 Hong Kong SAR, $55,084 China 8 United States $54,629 United States $54,629 9 Ireland $53,314 Saudi Arabia $51,924 10 Iceland $52,111 Ireland $47,804 11 Netherlands $51,590 Netherlands $47,131 12 Austria $51,127 Austria $46,165 13 Canada $50,271 Germany $45,616 14 Finland $49,541 Bahrain $45,479 15 Germany $47,627 Sweden $45,144 16 Belgium $47,517 Denmark $44,863 17 United Kingdom $45,603 Canada $44,089 18 United Arab Emirates $44,204 Australia $43,902 19 France $42,733 Iceland $43,393 20 Brunei Darussalam $41,344 Belgium $42,725
Source: World Bank Data, 2015 for year 2014. 148
International Money and Finance
Besides the dollar overvaluation relative to the other developed coun-
tries’ currencies, from time to time many developing countries have
complained that their currencies are overvalued against the developed
countries’ currencies, and thus their balance of trade sustains a larger
deficit than would otherwise occur. If PPP applied only to internation-
ally traded goods, then we could show how lower labor productivity in
developing countries could contribute to apparently overvalued curren-
cies. For nontraded goods we assume that production methods are simi-
lar worldwide. It may make more sense to think of the nontraded goods
sector as being largely services. In this case more productive countries tend
to have higher wages and thus higher prices in the service sector than less-
productive, low-wage countries. We now have a situation in which the
price indexes used to calculate PPP vary with productivity and hence with wages in each country.
If we assume that exchange rates are determined only by traded goods
prices (the idea being that if a good does not enter into international
trade, there is no reason for its price to be equalized internationally and
thus no reason for changes in its price to affect the exchange rate), then
we can find how price indexes vary with service prices while exchange
rates are unaffected. For instance the price of a haircut in Paris should
not be affected by an increase in haircut prices in Los Angeles. So if the
price of haircuts should rise in Los Angeles, other things being equal,
the average price level in the United States increases. But this US price
increase should not have any impact on the dollar per euro exchange rate.
If, instead, the price of an automobile rises in the United States relative
to French auto prices, we would expect the dollar to depreciate relative
to the euro because demand for French autos (and thus euros) increases
while demand for US autos (and thus dollars) decreases.
If the world operates in the way just described, then we would expect
that the greater are the traded goods productivity differentials between
countries, the greater will be the wage differentials reflected in service
prices, and thus the greater will be the deviations from absolute PPP
over time. Suppose that developing countries, starting from lower abso-
lute levels of productivity, have higher productivity growth rates. If per
capita income differences between countries give a reasonable measure
of the productivity differences, then we would anticipate that as develop-
ing country per capita income increases relative to developed country per
capita income, the developing country price index will grow faster than
that of the developed country. But at the same time, the depreciation of
Prices, Exchange Rates, and Purchasing Power Parity 149
the developing country’s currency lags behind the inflation differentials, as
measured by the average price levels in each country that include traded
and nontraded goods prices. Thus, over time, the currency of the develop-
ing country will tend to appear overvalued (the foreign exchange value
of the developing country’s money has not depreciated as much as called
for by the movements in the average price levels), whereas the developed
country’s currency will appear undervalued (the exchange value of the
developed country’s money has not appreciated as much as the price level changes would indicate).
Does the preceding discussion describe the real world? Do you believe
that labor-intensive services (domestic servants, haircuts, etc.) are cheaper
in poorer countries than in wealthy countries? Researchers have provided
evidence suggesting that the deviations from PPP as previously mentioned
do indeed occur systematically with changes in per capita income.
What is the bottom line of the foregoing consideration? National price
indexes are not particularly good indicators of the need for exchange rate
adjustments. In this respect it is not surprising to find that many studies
have shown that absolute PPP does not hold. The idea that currencies are
undervalued or overvalued can be misleading if exchange rates are free to
change with changing market conditions. Only if central bank or govern-
ment intervention interrupts the free adjustment of the exchange rate to
market clearing levels can we really talk about a currency as being over-
valued or undervalued (and in many such instances black markets develop
where the currency is traded at free-market prices). The fact that changes
in PPP over time present the appearance of an undervalued currency in
terms of the price indexes of two countries is perhaps more an indicator
of the limitations of price indexes than of any real market phenomena. REAL EXCHANGE RATES
All discussions of exchange rates so far have been with respect to the nomi-
nal exchange rate. This is the exchange rate that is actually observed in the
foreign exchange market. However, economists sometimes utilize the con-
cept of the real exchange rate to represent changes in the competitiveness
of a currency. The real exchange rate is an alternative way to think about
currencies being over- and undervalued. The real exchange rate is mea- sured as F E = E P P real /( / ) (7.4) 150
International Money and Finance
or the nominal exchange rate adjusted for the ratio of the home price
level relative to the price level abroad. In Fig. 7.3 one sees that the dol-
lar appeared to be significantly overvalued against the yen in the early
1980s and then significantly undervalued in the mid-1990s. In terms of
real exchange rate changes, this would mean that the real exchange rate in
terms of yen per dollar would have risen in the early 1980s as the nominal
exchange rate (yen per dollar) rose relative to the ratio of Japanese prices
to US prices. Then, in the 1990s, the real yen/dollar exchange rate fell
as the nominal exchange rate decreased relative to the ratio of Japanese prices to US prices.
If absolute PPP always held, the real exchange rate would equal 1. In
such a world nominal exchange rates would always change to mirror the
change in the ratio of home prices to foreign prices. Since the real world
has deviations from PPP, we also observe real exchange rates rising and
falling. When the real exchange rate rises beyond some point, concern is
expressed about an exchange rate overvaluation. When the real exchange
rate falls beyond some point, concern is expressed about exchange rate
undervaluation. As stated in the preceding section, terms like overvaluation
and undervaluation must be used carefully. Such terms may sometimes reflect
shortcomings of price indexes as inputs into measures of currency values. SUMMARY
1. PPP explains the relationship between product price levels and exchange rates.
2. If the exchange rate between two currencies is equal to the ratio of
average price levels between two countries, then the absolute PPP holds.
3. If the percentage change in the exchange rate is equal to the inflation
rate differential between two countries, then relative PPP holds.
4. PPP holds better for high-inflation countries due to the movement of
price levels overwhelms any relative price changes.
5. From empirical evidence, exchange rates seem to deviate from PPP in
the short run, but PPP tends to hold in the long run.
6. Deviations from PPP may arise from the presence of nontraded
good prices in price indexes, differentiated goods, transactions costs,
government restrictions, different consumption bundles in price
indexes across countries, and adjustment lags between exchange rates and product prices.
Prices, Exchange Rates, and Purchasing Power Parity 151
7. A currency is overvalued (undervalued) if it has appreciated more (less)
than the inflation rate differential between two countries as implied by PPP. EXERCISES
1. Assume that the cost of a particular basket of goods is equal to $108 in
the United States and ¥14,000 in Japan.
a. What should the ¥/$ exchange rate be according to absolute PPP?
b. If the actual exchange rate were equal to 120, would the dollar be
considered undervalued or overvalued?
2. Suppose that the inflation rate in India is 100% and the inflation rate
in the United States is 5%. According to relative PPP, what would hap-
pen to the value of dollar/rupee exchange rate?
3. If nontradable goods prices rise faster in country A than in country B,
and tradable goods prices remain unchanged, determine whether cur-
rency A will appear to be overvalued or undervalued.
4. Explain why relative PPP may hold when absolute PPP does not?
5. List four reasons why deviations from PPP might occur; then carefully
explain how each causes such deviations?
6. What is the “real exchange rate”? What does the real exchange rate equal if absolute PPP holds? FURTHER READING
Lothian, J.R., Taylor, M.P., 1996. Real exchange rate behavior: the recent float from the
perspective of the past two centuries. J. Polit. Econ. 104 (3), 488–509.
Officer, L.H., 1982. Purchasing Power Parity and Exchange Rates: Theory, Evidence, and
Relevance. JAI Press, Greenwich.
Ravn, M.O., Schmitt-Grohe, S., Uribe, M., 2007. Pricing to habits and the law of one price.
Am. Econ. Rev. 97 (2), 232–238. May.
Taylor, A.M., Taylor, M.P., 2004. The purchasing power parity debate. J. Econ. Perspect. 18 (4), 135–158.
The Economist online, 2016. The Big Mac Index, Patty Purchasing Parity. July 23.
APPENDIX A THE EFFECT ON PPP BY RELATIVE PRICE CHANGES
Arbitrage in goods markets makes it easy to understand why price level
changes affect exchange rates, but the effect of relative price changes is
more subtle. The following example will illustrate how exchange rates can
change because of relative price change even though there is no change in 152
International Money and Finance
the overall price level (no inflation). Table 7.A summarizes the argument.
Let us suppose there are two countries, France and Japan, and each con-
sumes wine and sake. Initially, in period 0, wine and sake each sell for 1
euro in France and 1 yen in Japan. In a simple world of no transport costs
or other barriers to the law of one price, the exchange rate, E = €/¥, must
equal 1. Note that initially the relative price of one bottle of wine is equal
to one bottle of sake (since sake and wine sell for the same price in each
country). To determine the inflation rate in each country, we must calcu-
late price indexes that indicate the value of the items consumed in each
country for each period. Suppose that initially France consumes 9 units of
wine and 1 unit of sake, whereas Japan consumes 1 wine and 9 sake. At the
domestic prices of 1 unit of domestic currency per unit of wine or sake, we
can see that the total value of the basket of goods consumed in France is 10
euros, whereas the total value of the goods consumed in Japan is 10 yen.
Now let us suppose that there is a bad grape harvest, so that in the
next period wine is more expensive. In terms of relative prices, we know
that the bad harvest will make wine rise in price relative to sake. Suppose
now that instead of the original relative price of 1 sake = 1 wine, we now
have 1.5 sake = 1 wine. Consumers will recognize this change in relative
prices and tend to decrease their consumption of wine and increase con-
sumption of sake. Suppose in period 1 the French consume 8 wine and
1.5 sake, whereas the Japanese consume 0.333 wine and 9.5 sake. Let us
further assume that the central banks of Japan and France follow a policy
of zero inflation, where inflation is measured by the change in the cost
of current consumption. With no inflation, the value of the consumption
basket will be unchanged from period 0 and will equal 10 in each country.
Thus although average prices have not changed, we know that individual
prices must change because of the rising price of wine relative to sake.
The determination of the individual prices is a simple exercise in alge-
bra, but is not needed to understand the central message of the example;
therefore, students could skip this paragraph and still retain the benefit of
the lesson. Since we know that France consumes 8 wine and 1.5 sake with
a total value of 10 francs and that the relative price is 1.5 sake = 1 wine,
we can solve for the individual prices by letting 1.5P , and we can s = Pw
then substitute this into our total spending equation (8P 1.5 10) to w + Ps =
determine the prices. In other words we have a system with two equations
and two unknowns that is solvable: 8P + 1. 5P = w s 10 (7.A1)
Prices, Exchange Rates, and Purchasing Power Parity 153
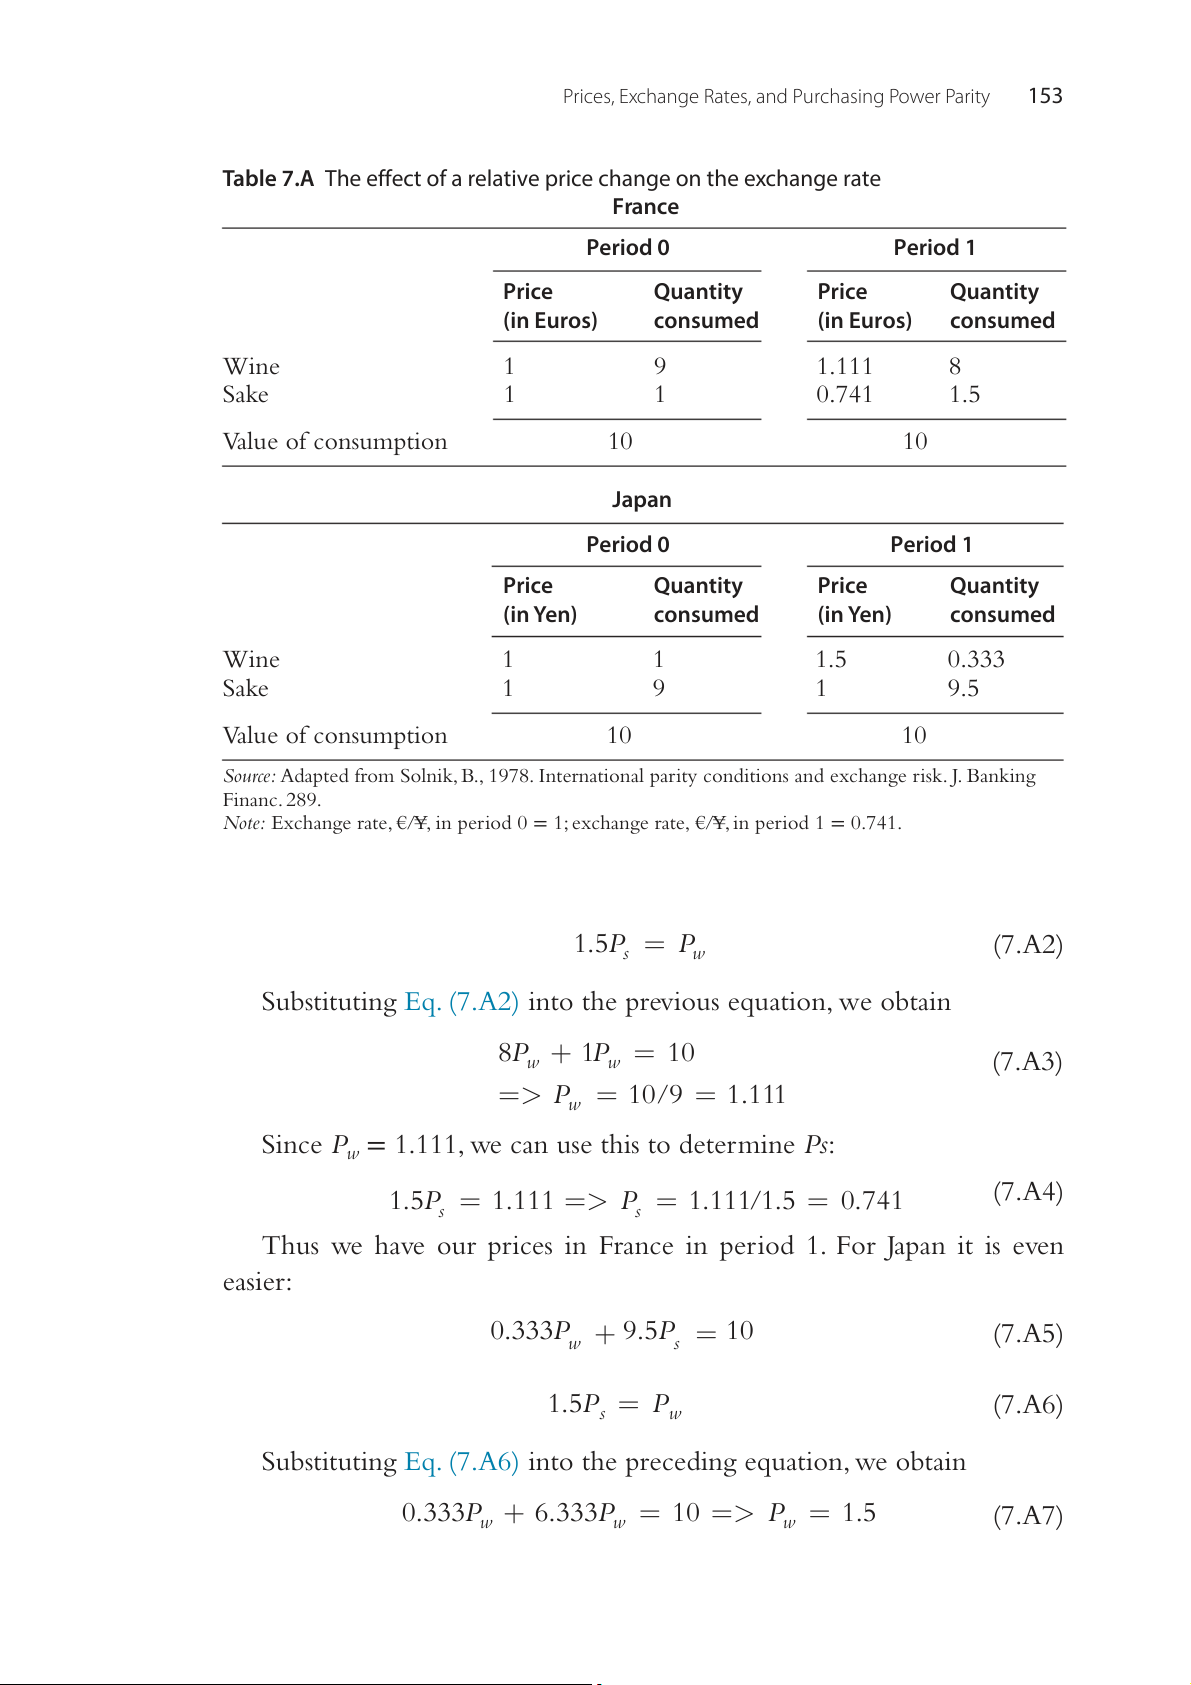
Table 7.A The effect of a relative price change on the exchange rate France Period 0 Period 1 Price Quantity Price Quantity (in Euros) consumed (in Euros) consumed Wine 1 9 1.111 8 Sake 1 1 0.741 1.5 Value of consumption 10 10 Japan Period 0 Period 1 Price Quantity Price Quantity (in Yen) consumed (in Yen) consumed Wine 1 1 1.5 0.333 Sake 1 9 1 9.5 Value of consumption 10 10
Source: Adapted from Solnik, B., 1978. International parity conditions and exchange risk. J. Banking Financ. 289.
Note: Exchange rate, €/¥, in period 0 = 1; exchange rate, €/¥, in period 1 = 0.741. 1.5P = P s w (7.A2)
Substituting Eq. (7.A2) into the previous equation, we obtain 8P + = w 1Pw 10 (7.A3) => P = / = . w 10 9 1 111
Since P 1.111, we can use this to determine : w = Ps
1.5P = 1.111 => P (7.A4) = = s s 1.111 1 / .5 0.741
Thus we have our prices in France in period 1. For Japan it is even easier:
0.333P + 9.5P = 10 w s (7.A5) 1.5P = P s w (7.A6)
Substituting Eq. (7.A6) into the preceding equation, we obtain
0.333P + 6.333P = 10 => P = w w w 1 5 . (7.A7) 154
International Money and Finance Thus 1.5P = 1 5 . => P = 1 s (7.A8) s
Given the new prices in period 1, we can now determine the exchange
rate implied by the law of one price. Since sake sells for 0.741 euros in
France and 1 yen in Japan, the euro price of yen must be €/¥ = 0.741.
In summary this example has shown how exchange rates can change
because of real economic events, even when average price levels are con-
stant. Since PPP is usually discussed in terms of price indexes, we find that
real events, such as the relative price changes brought about by a poor har-
vest, will cause deviations from absolute PPP as the exchange rate changes,
even though the price indexes are constant. Note also that the relative price
effect leads to an appreciation of the currency in the country where con-
sumption of the good that is increasing in price is heaviest. In our example
the euro appreciates as a result of the increased relative price of wine.
Tài liệu liên quan:
-

Hoạt động Tài chính của Doanh nghiệp Đa Quốc Gia (DN) - Chương 6 | Tài chính quốc tế | Trường Học Viện nông nghiệp Việt Nam
19 10 -

Hệ Thống Tiền Tệ Quốc Tế: Khái Niệm và Các Chế Độ Tỷ Giá | Tài chính quốc tế | Trường Học Viện nông nghiệp Việt Nam
24 12 -

Bài giảng Chương 1: Các Quan Hệ Cân Bằng Quốc Tế và LOP | Tài chính quốc tế | Trường Học Viện nông nghiệp Việt Nam
21 11 -
Cách Tính Lạm Phát và CPI: So Sánh Việt Nam và Mỹ | Tài chính quốc tế | Trường Học Viện nông nghiệp Việt Nam
23 12 -

Detailed Report and Analysis on Submission Trends | Tài chính quốc tế | Trường Học Viện nông nghiệp Việt Nam
23 12