A Framework for Enhancing Life Cycle Inventory Data Availability | Kinh tế vĩ mô | Trường Đại học kinh tế Thành Phố Hồ Chí Minh
Conclusions The integrated LCI data collection process and strategy has demonstrated the potential role of a multinational company to quickly engage and act as a strong enabler to unlock latent data for various aspects of the confectionery supply chain. Overall, it is recommended that the research findings serve as the foundations to transition towards a standardised procedure which can practically guide other multinational companies to considerably increase the availability of LCI data. Tài liệu được sưu tầm và soạn thảo dưới dạng file PDF để gửi tới các bạn cùng tham khảo, ôn tập đầy đủ kiến thức, chuẩn bị cho các buổi học thật tốt. Mời bạn đọc đón xem!
Môn: Kinh tế vĩ mô ( UEH) 0.9 K tài liệu
Trường: Đại học Kinh tế Thành phố Hồ Chí Minh 2.8 K tài liệu
Tác giả:


Preview text:
Int J Life Cycle Assess (2018) 23:1744–1760 DOI 10.1007/s11367-017-1391-y
DATA AVAILABILITY, DATA QUALITY
A framework for increasing the availability of life cycle inventory
data based on the role of multinational companies
Jamal Hussain Miah 1,2 & Andrew Griffiths3 & Ryan McNeill4 & Sharla Halvorson5 &
Urs Schenker 6 & Namy Espinoza-Orias6 & Stephen Morse2 & Aidong Yang7 & Jhuma Sadhukhan 2
Received: 20 December 2016 / Accepted: 23 August 2017 / Published online: 4 October 2017
# The Author(s) 2017. This article is an open access publication Abstract
features includes (1) management and implementation by a
Purpose The aim of the paper is to assess the role and effec
m-ultinational food company; (2) types of roles to manage,
tiveness of a proposed novel strategy for Life Cycle Inventory
provide and facilitate data exchange; (3) procedures to identi-
(LCI) data collection in the food sector and associated supply
f key products, suppliers and customers; (4) LCI question-
chains. The study represents one of the first of its type andnaire and cover letter and (5) data quality management based
provides answers to some of the key questions regarding the
on the pedigree matrix. Overall, the combined features in an
data collection process developed, managed and implemented integrated framework provide a new way of thinking about the
by a multinational food company across the supply chain. collection of LCI data from the perspective of a multinational
Methods An integrated LCI data collection process for con-food company.
fectionery products was developed and implemented byResults and discussion The integrated LCI collection frame-
Nestlé, a multinational food company. Some of the keywork spanned across 5 months and resulted in 87 new LCI
datasets for confectionery products from raw material, prima-
ry resource use, emission and waste release data collected
Responsible editor: Niels Jungbluth
from suppliers across 19 countries. The data collected was
Electronic supplementary material The online version of this article
found to be of medium to high quality compared with second-
(https://doi.org/10.1007/s11367-017-1391-y) contains supplementary
material, which is available to authorized users.
ary data. However, for retailers and waste service companies,
only partially completed questionnaires were returned. Some * Jamal Hussain Miah
of the key challenges encountered during the collection and j.miah@surrey.ac.uk
creation of data included lack of experience, identifying key
actors, communication and technical language, commercial 1
compromise, confidentiality protection and complexity of
Nestlé UK Ltd, Rowan Drive, Fawdon, Newcastle Upon Tyne NE3multi-tiered supplier systems. A range of recommendations 3TR, UK 2
are proposed to reconcile these challenges which include
Centre for Environment and Sustainability (CES), Faculty of
Engineering and Physical Sciences, University of Surrey,
standardisation of environmental data from suppliers, concise Guildford GU2 7XH, UK
and targeted LCI questionnaires and visualising complexity 3
Nestlé UK Ltd, Group Technical and Production, Haxby Road, through drawings. York YO91 1XY, UK
Conclusions The integrated LCI data collection process and 4
Nestlé Confectionery Product & Technology Centre (PTC), Haxby strategy has demonstrated the potential role of a multinational Road, York YO91 1XY, UK
company to quickly engage and act as a strong enabler to 5
Nestlé Research Centre (NRC), CT-Nutrition, Health, Wellness andunlock latent data for various aspects of the confectionery
Sustainability, 1000 Lausanne 26, Switzerland
supply chain. Overall, it is recommended that the research 6
findings serve as the foundations to transition towards a
Nestlé Research Centre (NRC), Sustainability & Novel Packaging, 1000 Lausanne 26, Switzerland
standardised procedure which can practically guide other mul- 7
tinational companies to considerably increase the availability
Department of Engineering Science, University of Oxford, Parks Road, Oxford OX1 3PJ, UK of LCI data.
Int J Life Cycle Assess (2018) 23:1744–1760 1745
Keywords Confectionery . Data collection . Food industry .
strategy for data collection is to collect the highest proportion
Food products . Life cycle inventory . Multinational
of data from primary data sources which is carried out by an
LCA practitioner. However, a considerable amount of time and
cost is required by an LCA practitioner to physically collect 1 Introduction
primary data and rationalise and interpret LCI data as defined
by the goal and scope of the LCA study (Testa et al. 2016; Jolliet
From the early days of life cycle assessment (LCA) overt al. 2015; Ang et al. 2014).
40 years ago, the availability of Life Cycle Inventory (LCI) In an effort to reduce cost and time of data collection,
data has been a continuing major problem—a bottleneck—forseveral approaches have been developed that streamline and
the wide application of LCA (Testa et al. 2016; Ang et a sil.
mplify LCA methodology (Scanlon et al. 2013; Ning et al.
2014; Finnveden et al. 2009; Pennington et al. 2007). As an
2013; Dowson et al. 2012) including reduction in LCA stages,
internationally recognised and standardised approach, the ap-e.g. gate-to-gate (factory) (Jimenez-Gonzalez et al. 2000);
plication of LCA involves four phases which are (1) goal and
meta-product-based accounting (Mila i Canals et al. 2011);
scope definition, (2) inventory analysis, (3) impact assessmentsingle impact categories, e.g. carbon dioxide or freshwater
and (4) interpretation (ISO 2006). Overall, it is estimated tha
c tonsumption (Stoessel et al. 2012); cut-off rules, e.g. 95%
70–80% of the time and cost involved in an LCA are related tao
ta coverage (Almeida et al. 2015); substitution of similar
data collection in the inventory phase by an organisation, es-
data (Dong et al. 2015) and simplification of the whole supply
pecially for complex products that have several componentschain which are considered (Roches et al. 2010). However,
and where the upstream and downstream supply chain struc-despite these efforts, the availability of LCI data continues to
tures are even more complex involving many actors (Testabe a consistent problem found in many LCA studies (Resta
et al. 2016; Ang et al. 2014; Berkhout and Howes 1997).
et al. 2016; Meinrenken et al. 2014; Mila i Canals et al. 2011).
Since the advent of LCA, there are many published LCA Over the past 20 years, the primary and secondary data
studies where data collection is reported as a background ac- collected have been used to develop and populate LCI DBs
tivity (Resta et al. 2016; Meinrenken et al. 2014; Mila i Canalsdedicated at the national level, e.g. the US LCI (NREL 2014);
et al. 2011; Rebitzer and Buxmann 2005). The collection of
Australian LCI (ALCAS 2011), Quebec LCI (Lesage and
data falls into two types: primary data and secondary data
S.amson 2016) and also at the sectorial level, e.g. WFLDB
Primary data are defined as Bdirectly measured or collected(Nemecek et al. 2014), Plastics Europe DB (PlasticsEurope
data representative of activities at a specific facility or set o
2f015) and for agricultural products such as AgriBalyse DB in
facilities^ (European Commission 2013). For example, France (Koch and Salou 2013; Colomb et al. 2015) or
emissions/consumptions directly related to a specific process Agrifootprint DB in the Netherlands (Agri-footprint gouda
(Kim et al. 2015; Kellens et al. 2011), otherwise known a
2 s014). However, current LCI DBs are limited in available data
process LCI (Islam et al. 2016; Suh and Huppes 2005)t.hat is current and of high quality. In addition, another aspect
Primary data tends to be highly specific and accurate. A variety
which is rarely discussed is the major gaps from the informa-
of techniques can be used to collect primary data such as invoitc i e
on in the public domain and available LCI datasets given the
bills, metered data, questionnaires, interviews and site visitsconsiderable rise in environmental reporting by companies
(UNEP 2011; BSI PAS 2050 2011; European Commission across the full supply chain (Corporate Register 2017).
2010; EPA 1993, 1995, 2014). Once primary data is collected, Although such information may not be suitable as LCI data,
the data is transformed into LCI for a range of environmental
what they do demonstrate is the potential available data and
impacts such as Global Warming Potenital (GWP), ozone de-actors that can be harnessed to provide suitable data for LCA
pletion and acidification (Bare 2011; Goedkoop et al. 2009;applications.
IPCC 2006; Guinée et al. 2002). In comparison, secondary data Traditionally, the central vehicle to collect and compile LCI
are defined as Bdata that is not directly collected, measured, o
h ras been by consultants (Ecodesk 2015). However, the effec-
estimated, but rather sourced from a third-party life-cycle-tiveness of consultants to facilitate data exchange is limited as
inventory database^ (European Commission 2013). This can shown by the availability of data in current LCI DBs. As such,
also include data from publications and reports. However, sec-alternative strategies have emerged which involve single or
ondary data tends to be less specific and highly aggregated.
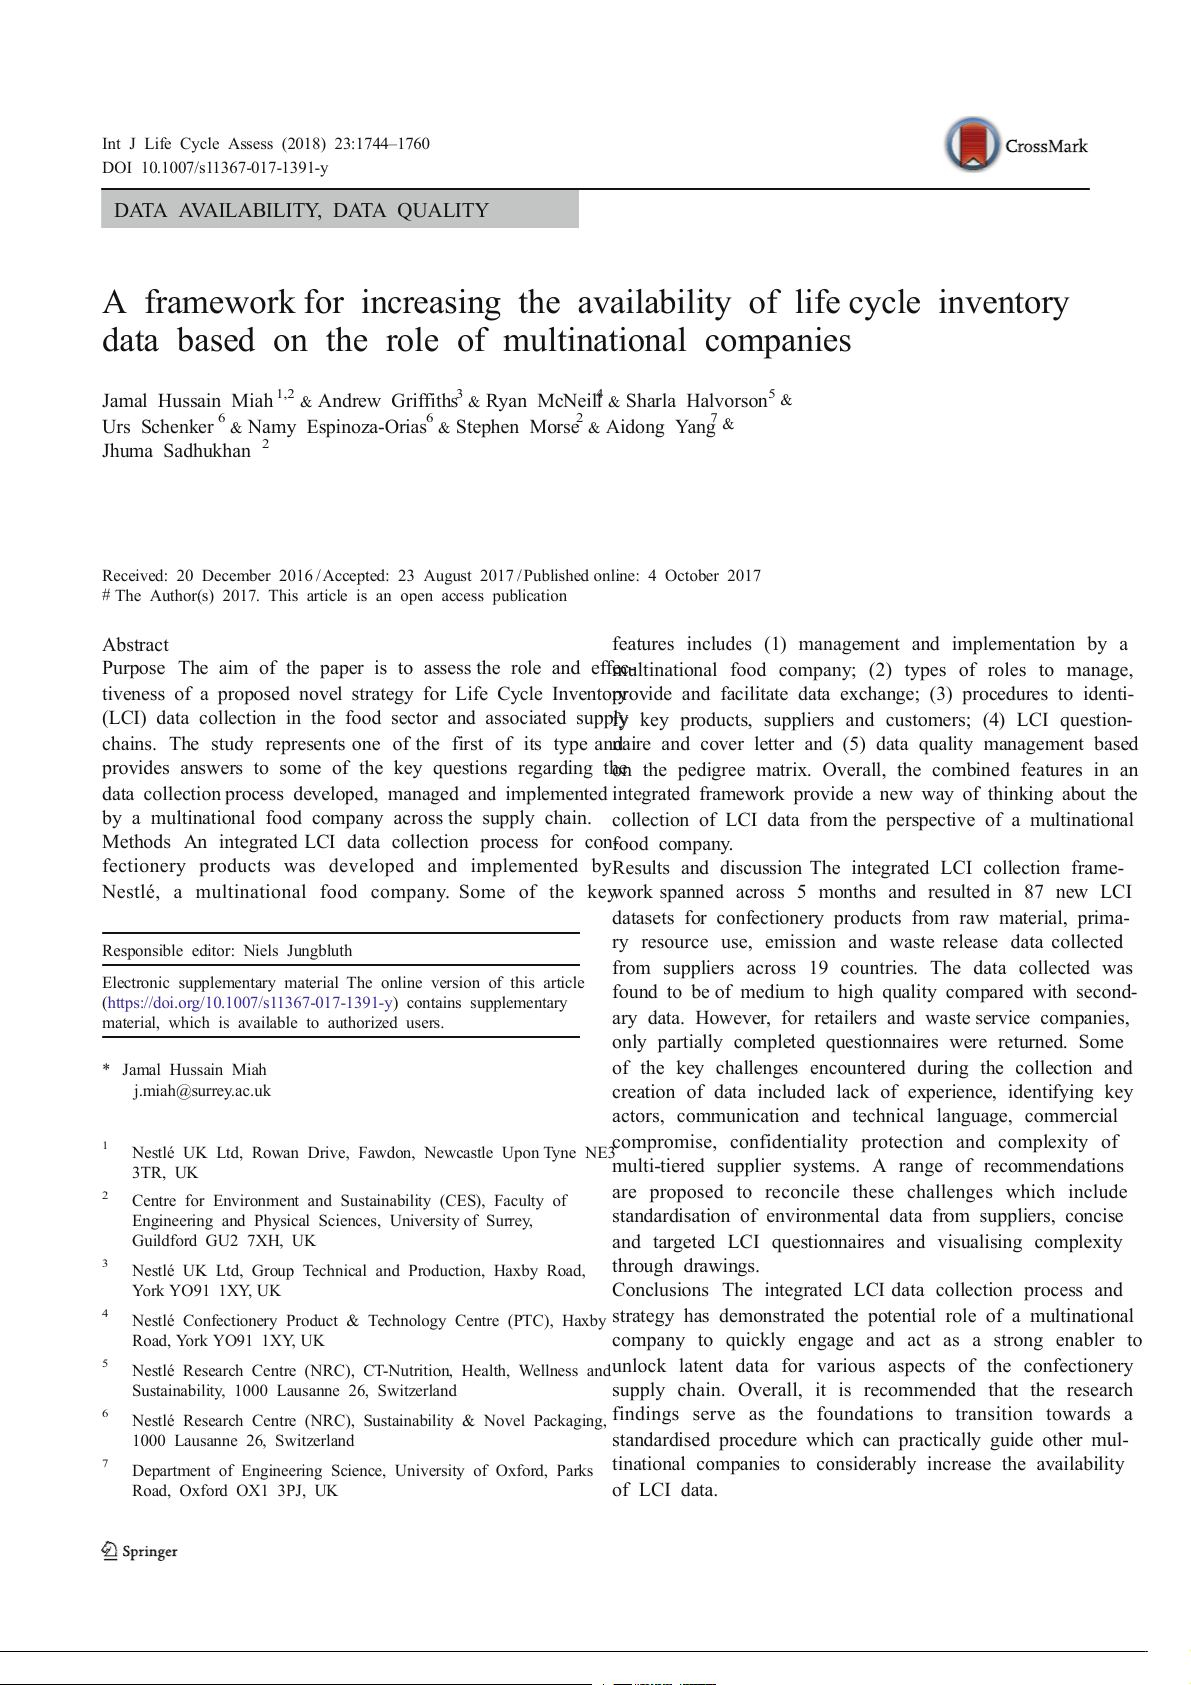
multiple actors to catalyse participation and encourage coop-
Some of the major LCI databases (DB) include Ecoinvent DBeration across the supply chain to increase data availability, as
(Ecoinvent 2016), US LCI DB (NREL 2014), World Food LCA shown in Fig. 1.
DB (WFLDB) (Nemecek et al. 2014) and Plastics Europe DB Due to the involvement of different actors, a range of dif-
(PlasticsEurope 2015). For both primary and secondary data,ferent strategies have been developed to facilitate and collect
there are guidelines available to ensure completeness, qualityLCI. For example, web-based systems (Ramos et al. 2016;
and transparency (Weidema et al. 2013; PEF World ForumBONSAI 2016; Recchioni et al. 2015; Mistry et al. 2016;
2013; UNEP 2011). Overall, for many LCAs, the commonBellon-Maurel et al. 2014), trade bodies/industry associations 1746
Int J Life Cycle Assess (2018) 23:1744–1760 5.
How effective is a company acting as the facilitator for data exchange? 6.
What are the motivations for data exchange? 7.
What are the challenges of collecting LCI data? 8.
Can the collection of inlet/outlet flow data be standardised? 9.
What is the resource required to collect inlet/outlet flow data? 10.
What are the quality controls required to ensure robust datasets? 11.
What company initiatives are recommended to promote
Fig. 1 Different types of actors which can play a role to collect LCI data an efficient LCI data collection?
The paper begins by presenting the proposed LCI data
(Jungbluth et al. 2016; Popp et al. 2013; Finkbeiner et al
c .ollection process employed by Nestlé in Sect. 2. This is
2003; Pomper 1998) and consultants (Credit 360 2015; followed by a selection of results of the LCI data collection
Ecodesk 2015). However, the collection of data by theseprocess for confectionery products in Sect. 3. A discussion of
routes requires the strong involvement of actors across the
the implementation experience, key challenges encountered
whole supply chain where the main strategy and implementa-and how the Nestlé LCI process compares to other initiatives
tion process in terms of collecting data and data quality check a s
nd—in particular—what were the major differences and
has been on a voluntary basis, promoted and instigated at a to
wphat we can learn from Nestlé’s experience that will help with
level by a third party, e.g. research institutes, universities,LCI collection is provided in Sect. 4. Lastly, the conclusions
governments, industry associations and consultants are provided in Sect. 5.
(Recchioni et al. 2015; Skone and Curran 2005). Even so,
the ability of a third party to effectively engage and therefore
collect data in a reasonable and practical timeframe with actors 2 Methods
across the supply chain will be limited as they will not have
full knowledge of the supply chain or the limitations of inter 2 -
.1 Description of case company and food factory
nal processes adopted by actors across that chain (Lesage and Samson 2016).
The case company is Nestlé UK Ltd., a large food company in
Another strategy that has received little attention is athe UK and a subsidiary of Nestlé SAwho are a global leading
company-led approach, especially from the perspective of nutrition, health and wellness food company. Across the
powerful and influential actors such as manufacturing andglobe, Nestlé are active on addressing many sustainability
retail companies. This is an important, and perhaps surprising,issues related to the Sustainable Development Goals (SDGs)
gap in the literature as due to the integration of manufacturin a g
s part of their Creating Shared Value (CSV) strategy (Nestlé
and retail companies within supply chains, they offer the op-
2015a). For example, working with smallholder farmers
portunities to engage, initiate, collect, influence and managethrough the Nestlé Cocoa plan (Nestlé 2015b) and Nestlé
LCI data directly through actors across the supply chain. As
Nescafe plan (Nestlé 2015c), assessing and optimising the
such, our hypothesis is that a company-led approach to dataenvironmental impact of Nestlé products by LCA-based ap-
collection can provide an effective means to collect data. In
proaches (Nestlé 2013) and contributing to the development
order to satisfy this hypothesis, this paper seeks to address
of environmental data across the supply chain such as the
several research questions by presenting an effective and nov-
World Food LCA database (WFLDB 2014). As an organisa-
el LCI data collection process and the implementation experi-
tion, there is not only the potential but a broad array of expe-
ence by Nestlé, a multinational food company for confection-rience which can contribute to supply chain engagement and
ery products. The research questions are as follows:
expedite data collection across the supply chain.
In the UK, Nestlé have 14 food factories that manufacture a 1.
What is the timeframe to collect inlet/outlet flow datrange of products that include coffee, cereals, pet food, water and can it be accelerated?
and confectionery. The case factory is based in the North East 2.
How much data should be collected and are their limita o -
f England that manufactures a range of confectionery prod- tions on quality?
ucts that are sugar, chocolate and biscuit based by utilising a 3.
What are the effective tools to collect data?
diverse range of processing technologies. In total, there are 4.
Who are the key actors in the supply chain and howato
pproximately 130 Stock Keeping Units (SKUs) which are a identify them?
variation of a brand product format, e.g. single bar pack and
Int J Life Cycle Assess (2018) 23:1744–1760 1747
multiple bars pack. The SKUs are sold to a range of custome
a rse sought for advice. Overall, a range of people are involved
both in the UK and across the globe (Miah et al. 2015a). Ttheroughout whose role falls into two categories: (1) data pro-
use of a case study in this way allows for an in-depth explo
vi -der and (2) data exchange facilitator. The ‘data provider’ are
ration of the supply chain, and while it is acknowledged tha
p teople from different organisations across the stages of the life
the findings are specific to that chain, it can be reasonably
of a food product which provide data. The ‘data exchange
surmised that the results are applicable for other multinationaflacilitator’ are people primarily from Nestlé who have
food companies who manufacture and sell food products di-established relationships with data provider organisations to rectly to retailers.
facilitate data exchange. From Nestlé’s perspective, an indic-
ative level of resource required and expected data quality is
2.2 Overview of confectionery LCI data collection process
provided at each life cycle stage as guidance. The different
stages are explained in the following subsections.
The LCI data collection process was initiated and developed
by a transdisciplinary process involving both Nestlé practi-2.3 Description of the potential available resource
tioners and academics from the University of Surrey (Miah
et al. 2015b). The LCI data collection process presented here
The potential available resource is an indication of the differ-
(Fig. 2) is based on LCI guidelines (Nemecek et al. 2014 e ;
nt people that could potentially be made available from the
ALCAS 2014; UNEP 2011; BSI PAS 2050 2011; European food company to participate in the collection of inlet/outlet
Commission 2010) and the challenges faced by Rebitzer et alf.low data. The process to identify people is a continuing pro-
(2004) and Berkhout and Howes (1997). As a methodology,cess but starts during the goal and scope definition, before the
the LCI data collection process displays features which are
identification of SKUs, by developing a list/map of potential
found in approaches by different companies, e.g. data sources,available resource based on recommendations from the
questionnaires, data quality management, etc. What distin-decision-maker who commissioned the LCA. The decision-
guishes the approach presented here is the combined features
maker is likely to be someone in a senior position responsible
and, more importantly, the role of a multinational food com-
for environmental sustainability improvements in the compa-
pany (e.g. Nestlé), rather than a third party, to initiate, moti-
ny. Following this, further people can be identified as data
vate, accelerate and manage the whole collection of inlet/collection progresses. The types of people involved are pri-
outlet flow data across the supply chain.
marily internal to the food company from the environment/
The goal of the LCI data collection process is to provide a s n
ustainability department to provide further guidance and di-
effective and efficient streamlined route to practically collectrection towards data providers both internal and external to the
data—on a voluntary basis—across different input intensitiesfood company. For example, at the factory life cycle stage, the
such as electricity, natural gas, water and solid waste that is
food company is directly involved with the management and
both specific and general at different stages of the producotperation of the food factory and will have several depart-
supply chain that can be used to conduct an LCA, e.g. envi
m -ents where various data is collected related to the environ- ronmental hotspot analysis.
ment. As such, there are a large number of people that could
The scope of the primary data collection process includesbe coordinated to collect inlet/outlet flow data at the factory
first-tier suppliers, factory, retailer, consumer and disposal.life cycle stage. In comparison to the farm-level life cycle
The farm-level stage was not included due to the indirects age, the food company will not necessarily have a direct
relationship with farmers and existing Nestlé initiatives suchinvolvement with the management and operation of the farm
as the Cocoa plan (Nestlé 2015b), Nescafe plan (Nestléas Nestlé does not own farms. Although, they do have direct
2015c) and contributing partner to the World Food LCA da-suppliers, where a strong relationship is established, through
tabase (WFLDB 2014). The integrated LCI data collectionwhich data collection is possible indirectly to the farmers. As
process begins at the food factory because food manufacturersuch, there will be a low number of people that could be
typically carry out the design of the product which sets forth
coordinated to collect inlet/outlet flow data at the farm-level
the product supply chain structure both upstream and down-life cycle stage. Overall, the types of people involved internal-
stream. From here onwards, the data collection strategyly to the food company will vary depending on the life cycle
branches both upstream and downstream of the product sup-stage as different departments or functions will have varying
ply chain where the collected data is reviewed, analysed and
knowledge based on their role, experience and the relation-
normalised, if required. The final stage involves a reconcilia- ships they have with people both internally and externally via
tion and aggregation of LCI datasets.
institutions. The degree of engagement of human resources in
The responsibility for the whole management and imple-LCI-related activities will vary for different food companies,
mentation (including analysis) of the LCI data collection pro-but a general description is provided in Table 1 to distinguish
cess is by a single person in Nestlé known as the ‘data colle
bce-tween low, medium and high resources. The direct relation-
tor manager’. On occasion, internal and external LCA expertsship refers to a business/professional relationship. On the 1748
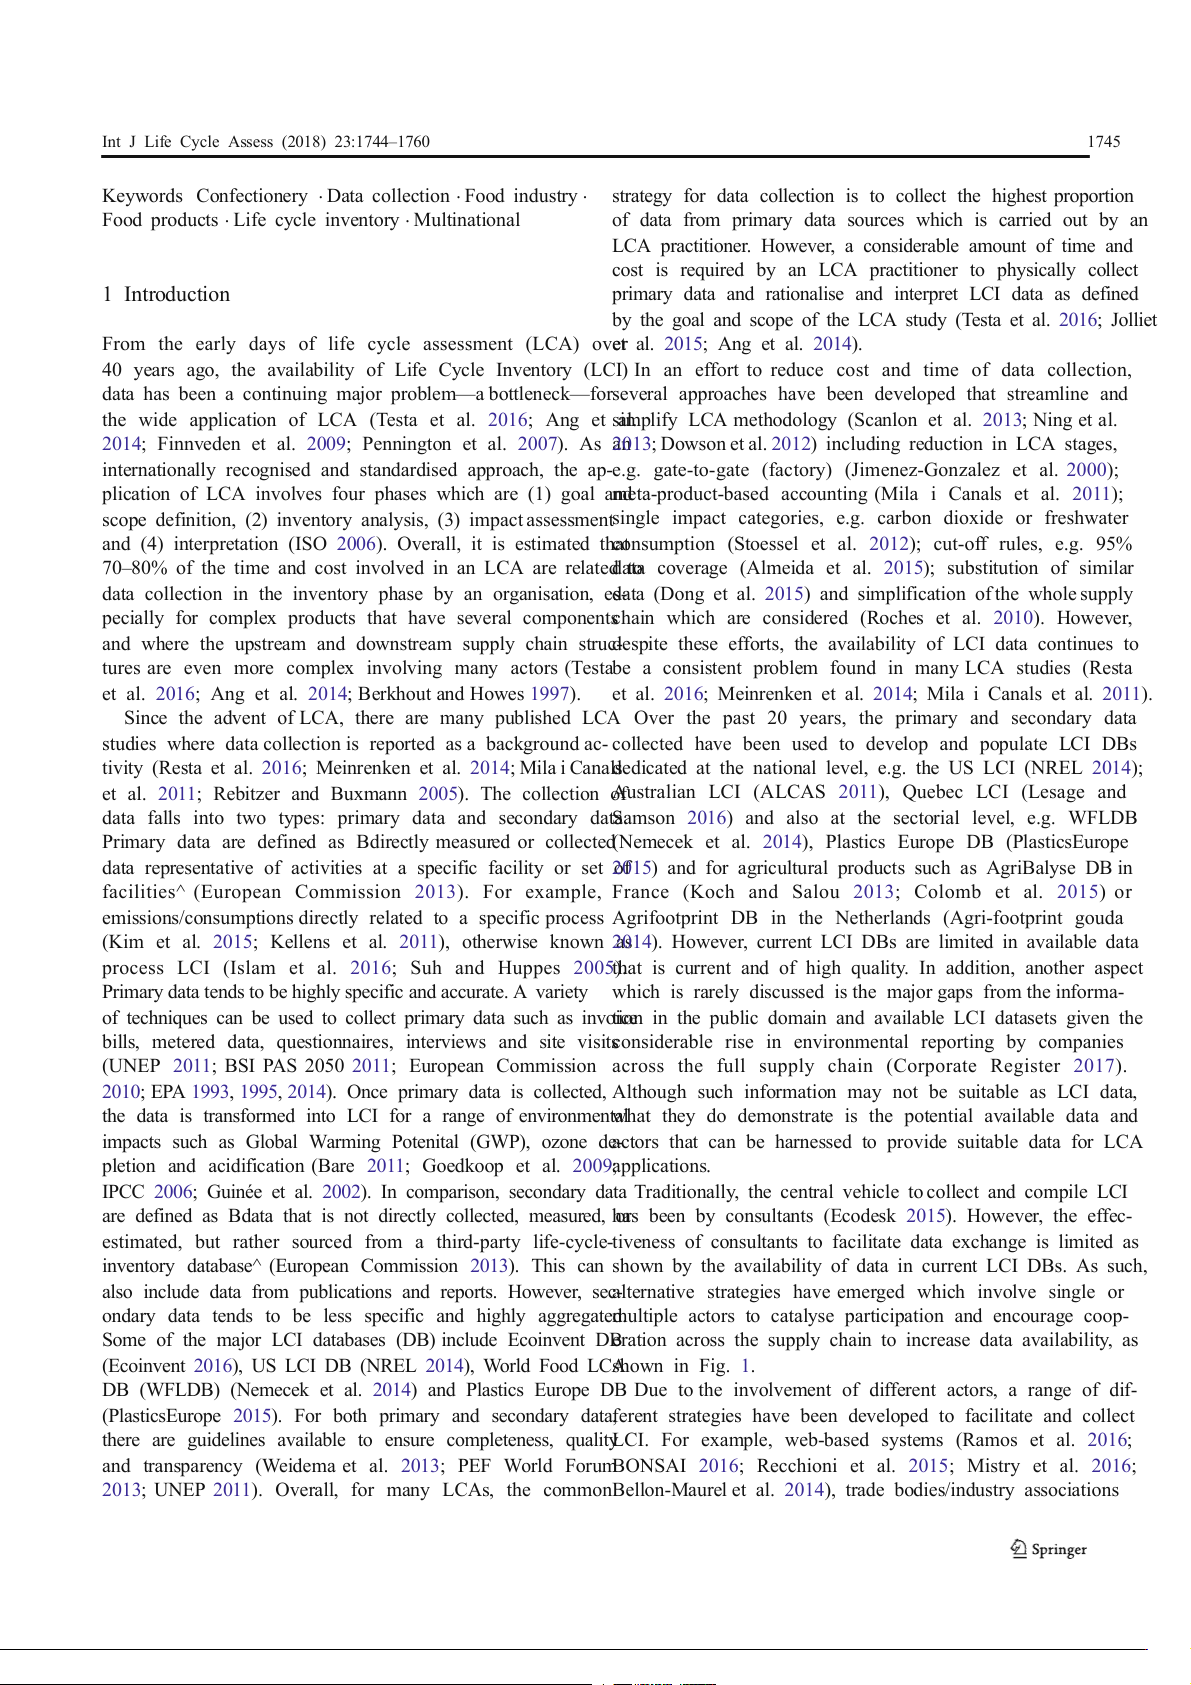
Int J Life Cycle Assess (2018) 23:1744–1760 Raw material Life cycle Farm level Food factory Customers Consumers Disposal stages processing Food processors Retailers Waste service Types of Farmers Food company Retailers NGOs NGOs Research institutes Research institutes providers Actors Research institutes Trade associations NGOs National government involved Research institutes Agricultural cooperatives Trade associations Local government Data provider Data provider Data collector Data provider Data provider Data provider Data exchange Role of Data exchange Data exchange manager Data exchange Data exchange facilitator Actors facilitator facilitator Data provider facilitator facilitator Data exchange facilitator Procurement Procurement Engineers Sales / marketing Sales / marketing Engineers Potential Logistics Logistics SHE Logistics Logistics SHE Available Production Logistics resource Logistics Sales / marketing Expected Data quality LOW MEDIUM / HIGH HIGH MEDIUM / HIGH LOW / MEDIUM MEDIUM / HIGH START Define Goal and Scope A1 Identify key products Identify ingredients and Extract factory Develop customer Determine consumer B1 packaging m aterials A2 environmental data D1 category map E1 profile Identify ingredients and Develop environmental Extract environmental Identify routes to packaging suppliers B2 A3 standards Identify major customers E2 impa ct of consumer D2 F1 Life Cycle profile disposal Inventory collection process Develop Life Cycle Develop Life Cycle Extract environmental Inventory (LCI) B3 impa ct of disposal questionnaire Inventory (LCI) D3 F2 questionnaire routes Email LCI questionnaire Email LCI questionnaire to suppliers and invite to B4 to customer s and invite a webinar D4 to a telephone meeting Follow-up suppliers with B5 emails and phon e calls Follow-up suppliers with D5 emails and phone calls Identify raw materials Extract LCI data and B6 Extract LCI data and C1 from LCI data extraction standardise D6 standardise Search general LCI databases a nd literature C2 for LCI profiles on raw materials Data Quality Management G Output LCI dataset compilation H
Fig. 2 Life Cycle Inventory (LCI) data collection process
Int J Life Cycle Assess (2018) 23:1744–1760 1749 Table 1 The degree of engagement of human resources Human resources Description in LCI related activities Low
• No involvement in the life cycle stage
• Indirect relationship with life cycle stage operator via an intermediary, e.g. co-operatives Medium
• No direct involvement in the life cycle stage management or operation
• A mix of direct and indirect relationships with life cycle stage operator High
• A direct involvement in the life cycle stage via management and/or operation
• A range of departments actively involved in environmental issues
other hand, the indirect relationship refers to the business/developed and sent to the data provider for clarification.
professional relationship with an intermediary to collect dataFrom here onwards, a two-way dialogue (via emails, phone from the life cycle stage.
calls and physical meetings) continues with the aim to in-
crease the quality of data to the highest quality level which
2.4 Description of data quality management
is practical and economical to collect. Overall, throughout
the data analysis approach, internal and external LCA ex-
The management of data quality primarily involves the vali-
perts are sought to provide additional quality assurances on
dation of data from the various life cycle stages to ensure datta
he compiled dataset. For example, possible explanations
is robust, and thereby reduces the level of uncertainty in fur-
of anomalies in data and verification of expected results.
ther analysis. A semi-quantitative assessment method known
as the pedigree matrix is used which was originally developed
2.5 Description of food factory data collection: stages
by Weidema and Wesnaes (1996) and has gained traction overA1–A3
the course of 20 years to become the de facto quality assess-
ment method for several LCI DBs (Ecoinvent 2016; NRELAfter the goal and scope was defined, the next step was to
2014; ALCAS 2011). The pedigree matrix contains ratings foridentify key products which can include distinct product cat-
different data quality indicators (DQIs) such as reliability (R),
egories and major products. The identification process was
completeness (C), temporal correlation (TC), geographical carried out through engagement with the factory production
correlation (GC) and technological correlation (TeC). Theteam who were able to provide production data split out into
DQIs are then assessed based on the judgement of experts
product categories. For the list of SKUs in each key product
(e.g. LCA practitioners) and converted into a data quality category, the major SKU was selected based on a Pareto anal-
score (DQS) by Eq. (1). The score is rated into higyhsis of the SKU production volumes which can be extracted
(DQS ≤ 1.6), medium (DQS ≥ 1.6 to <3) and low (DQS ≥f 3
rom production and sales records. The major SKU is thus the to ≤ 5) quality.
reference product for the key product category throughout the
whole LCI data collection process. R þ C þ TC þ GC þ TeC þ X
At a factory level, the input intensity monitored will typi- DQS ¼ W 4 ð1Þ i þ 4
cally cover energy, water, solid waste and liquid waste. The
scale of available data will vary depending on the coverage of
utility meters across site and within processes, billed utility where
invoices and systems to record physical materials, e.g. solid DQS data quality score
waste. As such, a combination of the available data in con-
junction with reasonable estimates based on expert judgement
R, C, TC, GC, TeC: see values found in Weidema and
was needed to allocate the input intensity down to a key prod- Wesnaes (1996)
uct group based on mass allocation. A general rule for the X
allocation process is not possible as this will depend on the W
weakest quality level obtained (i.e. highest numerical
value) among the data quality indicators
combination of available data and expert judgement. i
number of applicable data quality indicators
Alternatively, an economic allocation approach can be used
if economic data is readily available. However, the major lim-
The data quality management proce ss involves itation compared to a mass allocation approach is the repre-
reviewing the data provided to (1) screen for any data gaps,entation of input-output flows based on economic data rather
(2) identify anomalies in datasets and (3) ascertain data
than physical dimensions based on mass; hence, this is subject
quality as described in Weidema and Wesnaes (1996) andto price variability. As such, an economic allocation is recom-
Eq. (1). Based on the review, a list of questions is
mended when mass data is not available. 1750
Int J Life Cycle Assess (2018) 23:1744–1760
2.6 Description of raw material processing data collection:
modular ‘builidng blocks’. Afterwards, the raw material stages B1–B6
groups were cross-referenced with commercial LCI databases
to find similar LCI profiles (Ecoinvent 2016; Quantis 2014;
For the major SKU identified, a list of ingredients and pack A-LCAS 2011).
aging materials was determined based on the product recipe
and packaging specification. The source of the data was ob-
2.8 Description of customers’ data collection: stages
tained from the production specialists at the food factory. D1–D6
Following this, the identification of suppliers involved engag-
ing with the procurement team of the food manufacturing The portfolio of customers for confectionery products can be
company who has a business relationship with the suppliershighly diverse depending on how developed the market where
and is able to formally and more appropriately request infort-he products are sold, e.g. high street retailers to convenience
mation. Prior to contacting the suppliers, an LCI questionnaire
stores to cinema outlets to snacks on an aeroplane. As such,
and cover letter was developed to provide the suppliers withe development of the range of customer categories was
the motivations of the request and the types of information
based on the literature (Spencer and Kneebone 2007;
required. The design of the questionnaire contains a range ofSpencer and Kneebone 2012) and from the food manufactur-
information categories shown in Table 2. The questionnaireing company logistics team. For the major SKUs, it was pos-
template can be found in the Electronic Supplementarysible to extract delivery orders over a 1-year time period to Material.
identify major customer categories and specifically the cus-
The cover letter developed was contained to a single pagetomers per se. From the identification of the major customer, it
to keep the communication concise. It included the purpose of
was possible to identify the key account manager inside the
the data request, contact details and a deadline of 4 weeksfood manufacturing company who manages the business re-
from receipt. The cover letter was signed off by the procurel-
ationship with an equivalent in the customer company. At the
ment contact who managed the business relationship with same time, the sustainability/environmental contact in the
suppliers and by the head of sustainability and head of pro f -
ood manufacturing company was able to provide an equiva-
curement in the food manufacturing company. This was tolent contact in the major customer category from previous and
ensure the request was supported at a high level in the foo o d
ngoing relationships. Before contacting the customer, a tai- manufacturing company.
lored LCI questionnaire was developed to include the same
Both the inlet/outlet flow questionnaire and cover letterinformation categories as for customers. The processing of the
were sent via e-mail to the business contact in the supplie r r
eturned inlet/outlet flow questionnaire is the same as
company. The option to follow-up with a webinar or phonediscussed in Sect. 2.6.
call was provided. Any further communications took place
through e-mails to discuss and clarify the request in more
2.9 Description of consumers’ data collection: stages
detail. When the inlet/outlet flow questionnaire was returned,E1–E2
the data were reviewed to gauge the sensibility of the infor-
mation. The LCI data for each inlet/outlet flow obtained for a
As most confectionery products are ‘ready to eat’, they do
specific geographic location were then converted to a range of
have short shelf-lives, and consumers are not expected to carry
life cycle impacts per tonne of material manufactured based
out any processes before consuming them. In this particular
on different life cycle impact assessment (LCIA) methodolo-scenario, consumer behaviour regarding transportation from
gies discussed in Sadhukhan et al. (2014) using GaBi 6.0. point of purchase (customer store location) to consumption,
storage of product, food waste and disposal of packaging are
2.7 Description of farm level data collection: stages C1–C2 the relevant parameters to be evaluated. Therefore, the process
to collect data for the major SKUs was largely based on liter-
The raw materials required to manufacture the ingredients andature supported by the marketing and sales team in the food
packaging materials can be found in the information extractedmanufacturing company and retailers.
from the inlet/outlet flow questionnaires sent to the food
manufacturing company suppliers. For the raw materials that2.10 Description of disposal data collection: stages F1–F2
could not be extracted or were not available due to incomplete
or unreturned inlet/outlet flow questionnaires, literature For the major SKUs and based on the consumption behaviour
searches were carried out on the general manufacture of in-
of the consumer, the waste materials can be identified. The
gredients and packaging materials to create a list of raw ma-
process to determine the routes to disposal should in principle
terials. Once a list of raw materials was made, they werfeollow the waste hierarchy (European Commission 2008), but
categorised into similar groups (e.g. dairy includes milk, wheyin practice, this can differ where there are national averages
etc) adopting the approach by Mila i Canals et al. (2011) fo t r
hat can be taken that provide recycling rates and disposal to
Int J Life Cycle Assess (2018) 23:1744–1760 1751 Table 2 An overview of LCI questionnaire categories and Information Description of content Data provider general content category Supplier/customer
• Basic information on supplier to include material names and Supplier overview manufacturing site locations.
• Confirmation of environmental management systems
• Confirmation of previous LCAs in the company
• Confirmation of willingness to collect further data down the supply chain Production
Production volumes of the factory and raw materials required to Suppliers
manufacture ingredients/packaging Land footprint
The area space occupied by the total site and factory Suppliers and customers Store volume
The volume space occupied by the retail site and/or warehouse Customers Energy
Includes the different energy types: electricity, natural gas, fuel oil Suppliers and
consumed at a factory and if possible at a product level customers Water
Includes the different water types: main, ground, river, and recycledSuppliers and
consumed at a factory and if possible at a product level customers Atmospheric
Includes the release of pollutants (if measured) to the atmosphere Suppliers emissions including particulate matter Solid waste
Includes solid materials that are discarded off-site and not recycledSuppliers and on-site customers Liquid waste
Includes liquid process water sent to a wastewater treatment plant a S n u d ppliers
any liquids that are siphoned into tanks to be treated off-site Transportation
Includes a general breakdown of the transportation route from the Suppliers and
location of manufacturing to the customer location Customers
landfill (EA 2014). For more specific environmental impact of
Table 4. Overall, the sugar product category has the highest
different waste treatment options, the engagement with wastenatural resources consumption.
service providers that operate on a local or national level canThe LCI questionnaire and cover letter developed were
provide data on a kilogram basis.
sent via e-mail to 67 ingredients and packaging suppliers
requesting 2013 data only. In total, only 55% returned ques-
tionnaires that went through a review process with the sup- 3 Results
pliers over a series of e-mails before being converted on a
relative basis, e.g. per ton of bulk product delivered to the 3.1 Amount of data collected
confectionery factory. The LCI data were then converted to
a range of environmental impacts to widen the application
The amount of data collected from both primary and second-depending on the preference of LCA practitioner, see
ary data sources are shown in Table 3. Overall, 183 LC
EIlectronic Supplementary Material for full LCIA data.
datasets were targeted for specific ingredients of which 129 Similar to raw material processing, an LCI questionnaire
were collected from primary and secondary sources. The totaland cover letter was sent to two major food retailers in the UK.
primary data collected was 100 whereas secondary data rep-However, only one retailer was able to provide some informa- resented 29.
tion which was not in the correct format, as shown in Table 5. 3.2 Types of data collected 3.3 Quality of data collected
A range of primary data was collected for the factory, raw
3.3.1 DQSs for both primary and secondary data
material processing and retailer shown in Tables 4 and 5 and
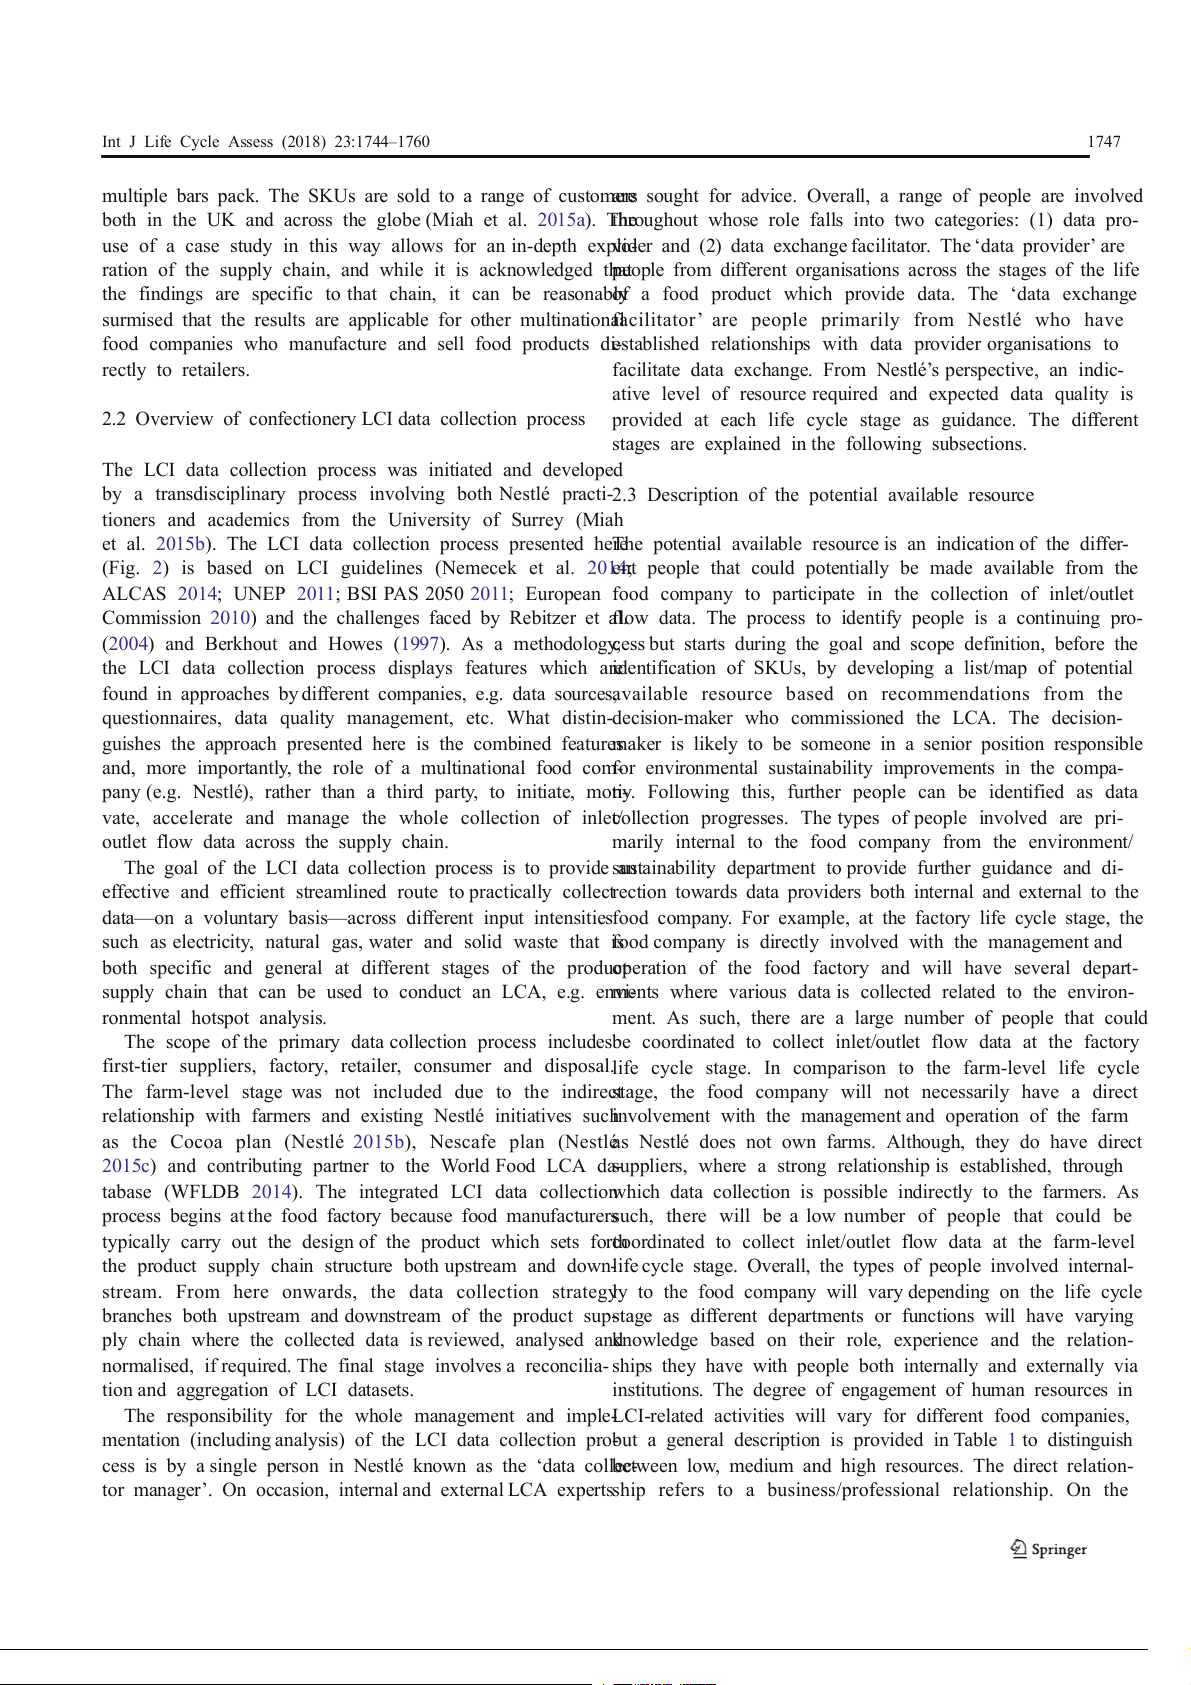
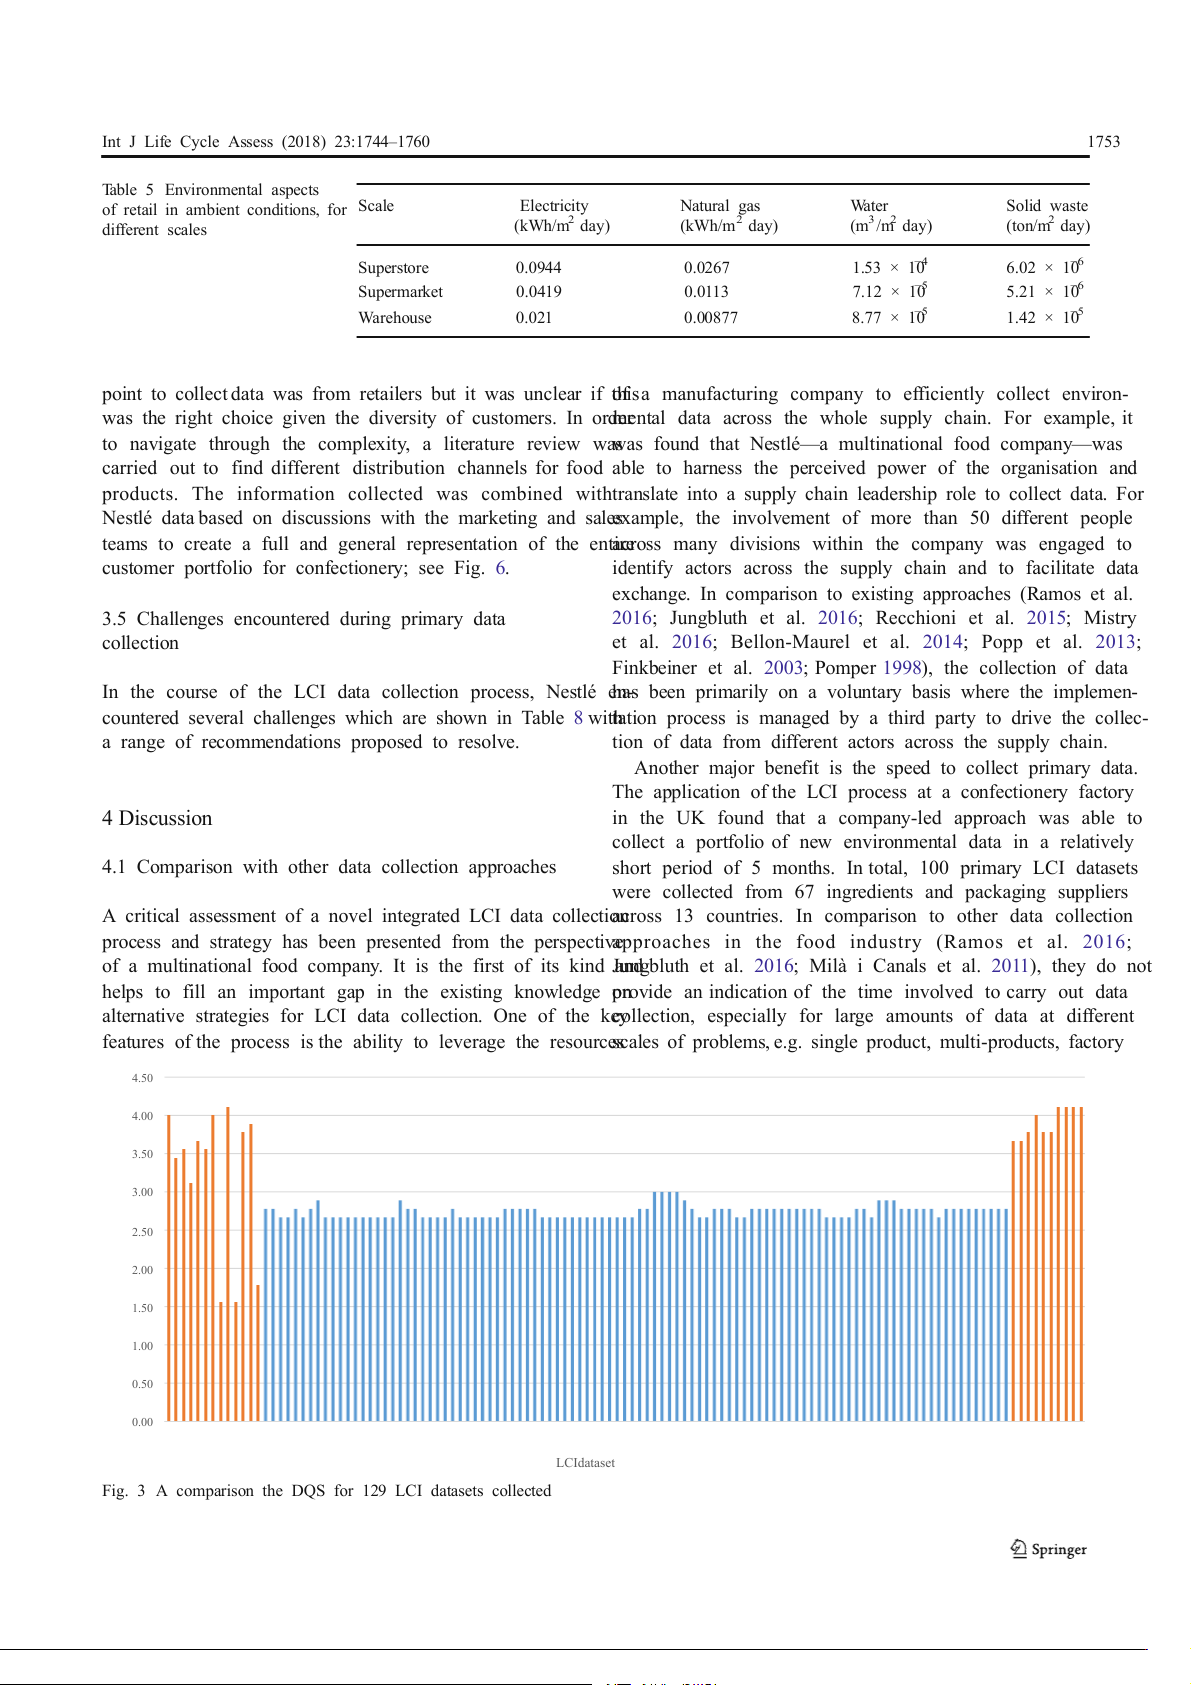
Electronic Supplementary Material. For the conversion of pri-The data collected was assessed based on the pedigree data
mary data to environmental impacts, this was based on thequality matrix. A comparison of the calculated data quality
energy data collected. The collection of emissions data wascore (DQS) for 123 LCI datasets is shown in Fig. 3. The
not found to be available across the majority of data provider
o srange bars represent secondary data whereas the blue bars
as this was not measured and/or was confidential. represent primary data.
For the confectionery factory, the input intensity data is Overall, the DQS were then categorised into high-,
provided at the factory and product category level, shown inmedium- and low-quality groups, as shown in Table 6. 1752
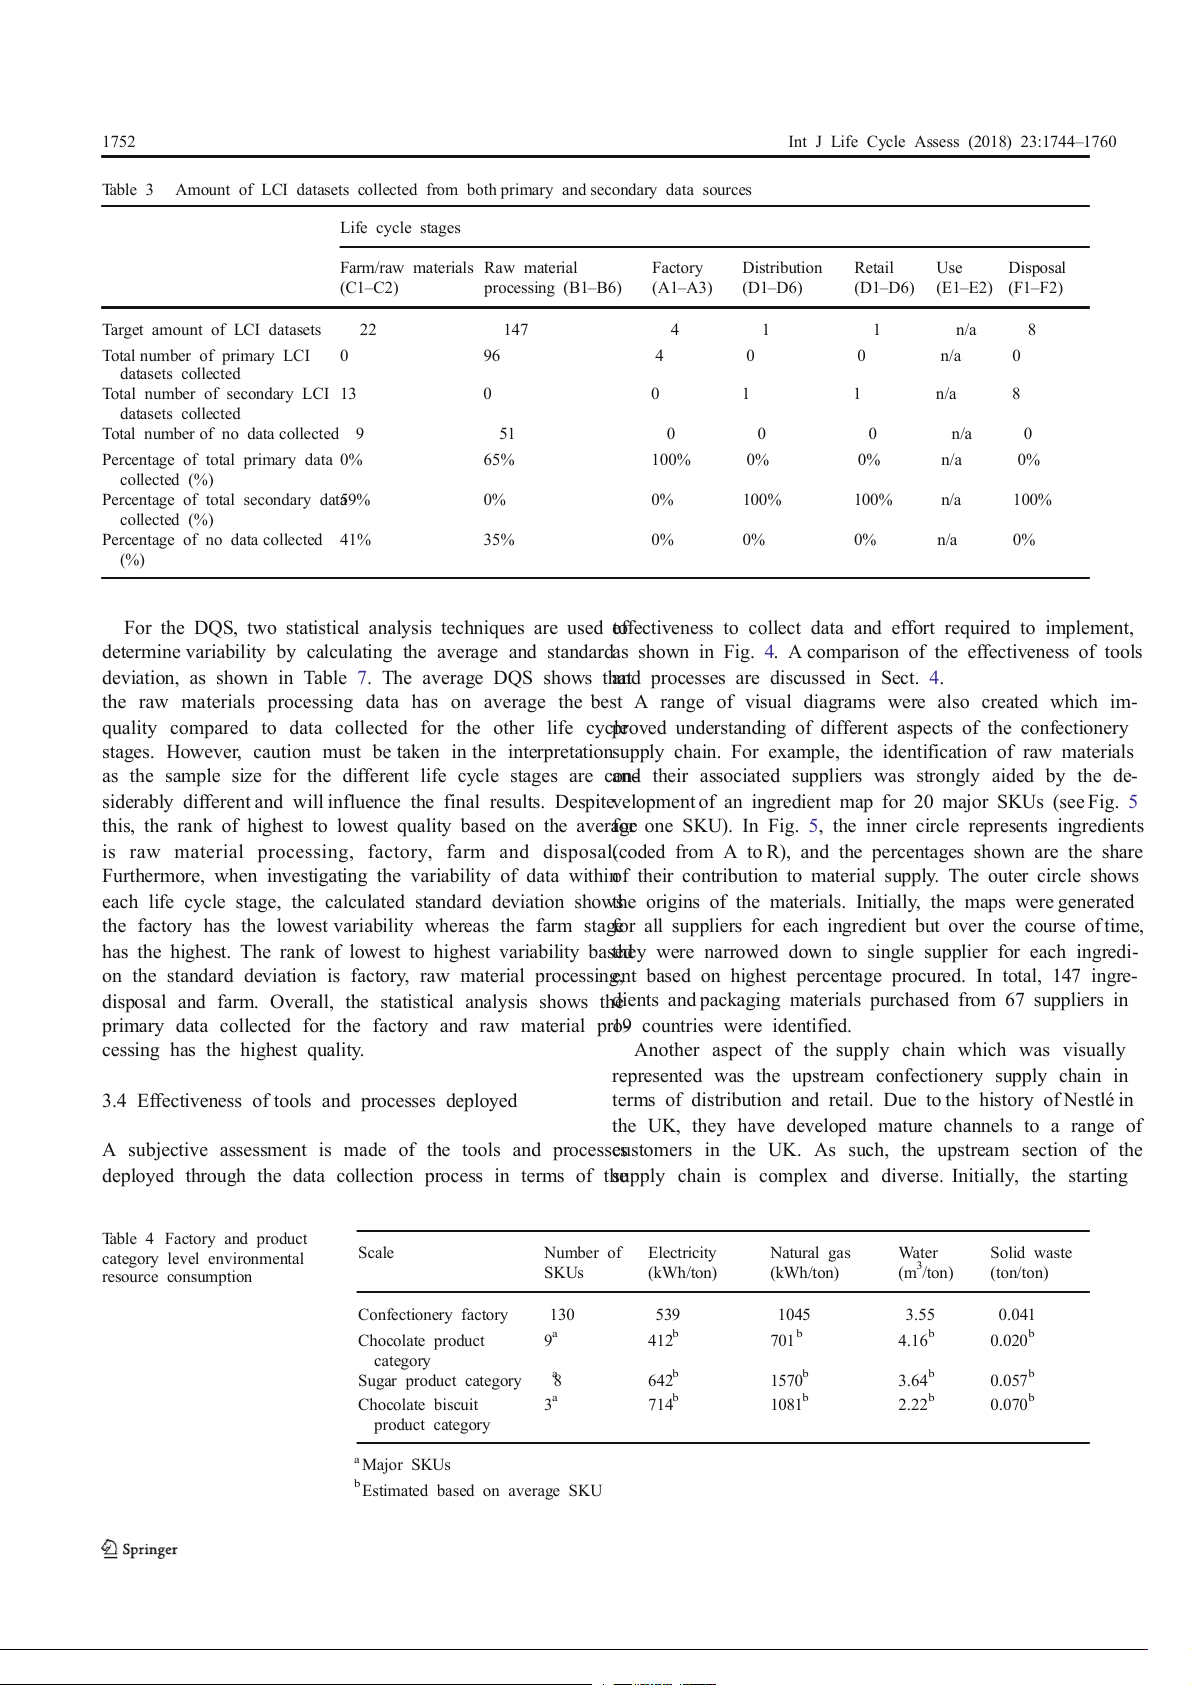
Int J Life Cycle Assess (2018) 23:1744–1760 Table 3
Amount of LCI datasets collected from both primary and secondary data sources Life cycle stages
Farm/raw materials Raw material Factory Distribution Retail Use Disposal (C1–C2) processing (B1–B6) (A1–A3) (D1–D6) (D1–D6) (E1–E2) (F1–F2) Target amount of LCI datasets 22 147 4 1 1 n/a 8 Total number of primary LCI 0 96 4 0 0 n/a 0 datasets collected
Total number of secondary LCI 13 0 0 1 1 n/a 8 datasets collected
Total number of no data collected 9 51 0 0 0 n/a 0
Percentage of total primary data 0% 65% 100% 0% 0% n/a 0% collected (%)
Percentage of total secondary data59% 0% 0% 100% 100% n/a 100% collected (%)
Percentage of no data collected 41% 35% 0% 0% 0% n/a 0% (%)
For the DQS, two statistical analysis techniques are used to
effectiveness to collect data and effort required to implement,
determine variability by calculating the average and standardas shown in Fig. 4. A comparison of the effectiveness of tools
deviation, as shown in Table 7. The average DQS shows tha a t
nd processes are discussed in Sect. 4.
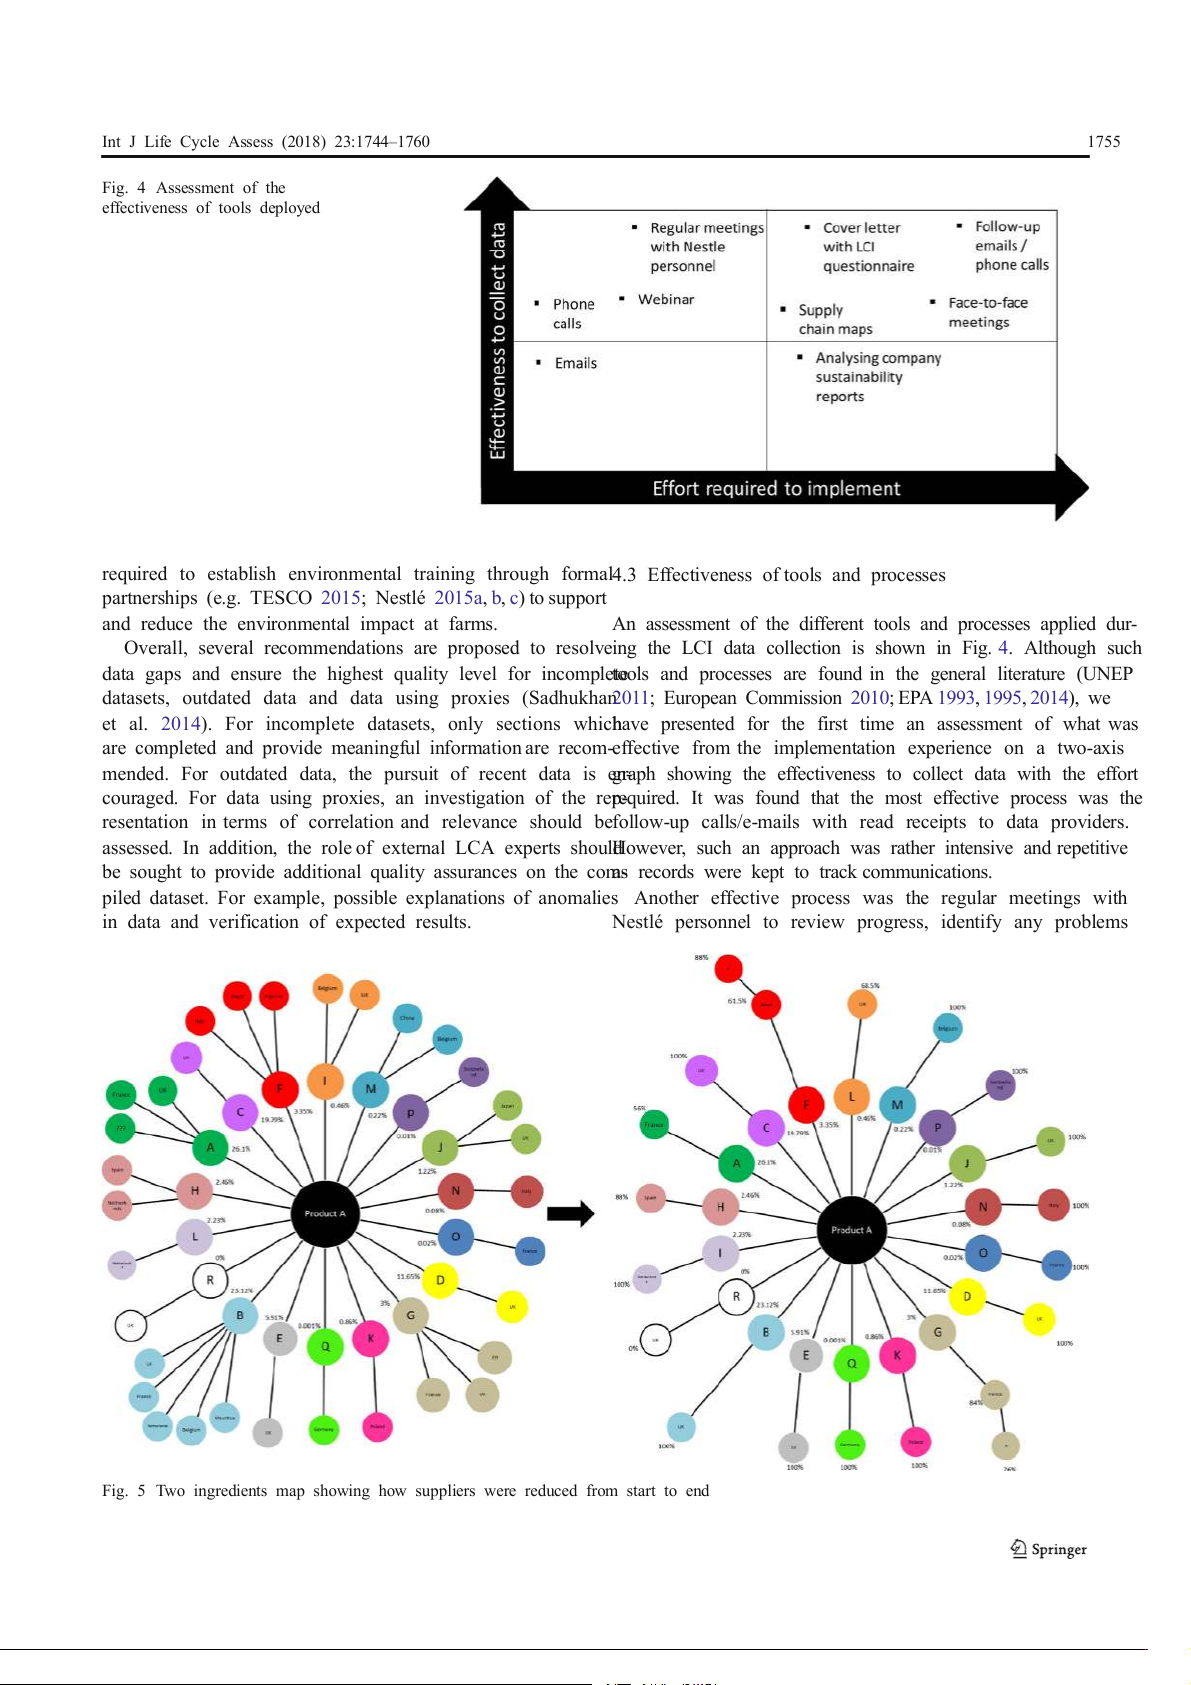
the raw materials processing data has on average the best A range of visual diagrams were also created which im-
quality compared to data collected for the other life cycle
proved understanding of different aspects of the confectionery
stages. However, caution must be taken in the interpretationsupply chain. For example, the identification of raw materials
as the sample size for the different life cycle stages are coan-d their associated suppliers was strongly aided by the de-
siderably different and will influence the final results. Despitevelopment of an ingredient map for 20 major SKUs (see Fig. 5
this, the rank of highest to lowest quality based on the averafge
or one SKU). In Fig. 5, the inner circle represents ingredients
is raw material processing, factory, farm and disposal.(coded from A to R), and the percentages shown are the share
Furthermore, when investigating the variability of data withinof their contribution to material supply. The outer circle shows
each life cycle stage, the calculated standard deviation shows
the origins of the materials. Initially, the maps were generated
the factory has the lowest variability whereas the farm stage
for all suppliers for each ingredient but over the course of time,
has the highest. The rank of lowest to highest variability base t d
hey were narrowed down to single supplier for each ingredi-
on the standard deviation is factory, raw material processing,
ent based on highest percentage procured. In total, 147 ingre-
disposal and farm. Overall, the statistical analysis shows the
dients and packaging materials purchased from 67 suppliers in
primary data collected for the factory and raw material pro1-9 countries were identified.
cessing has the highest quality.
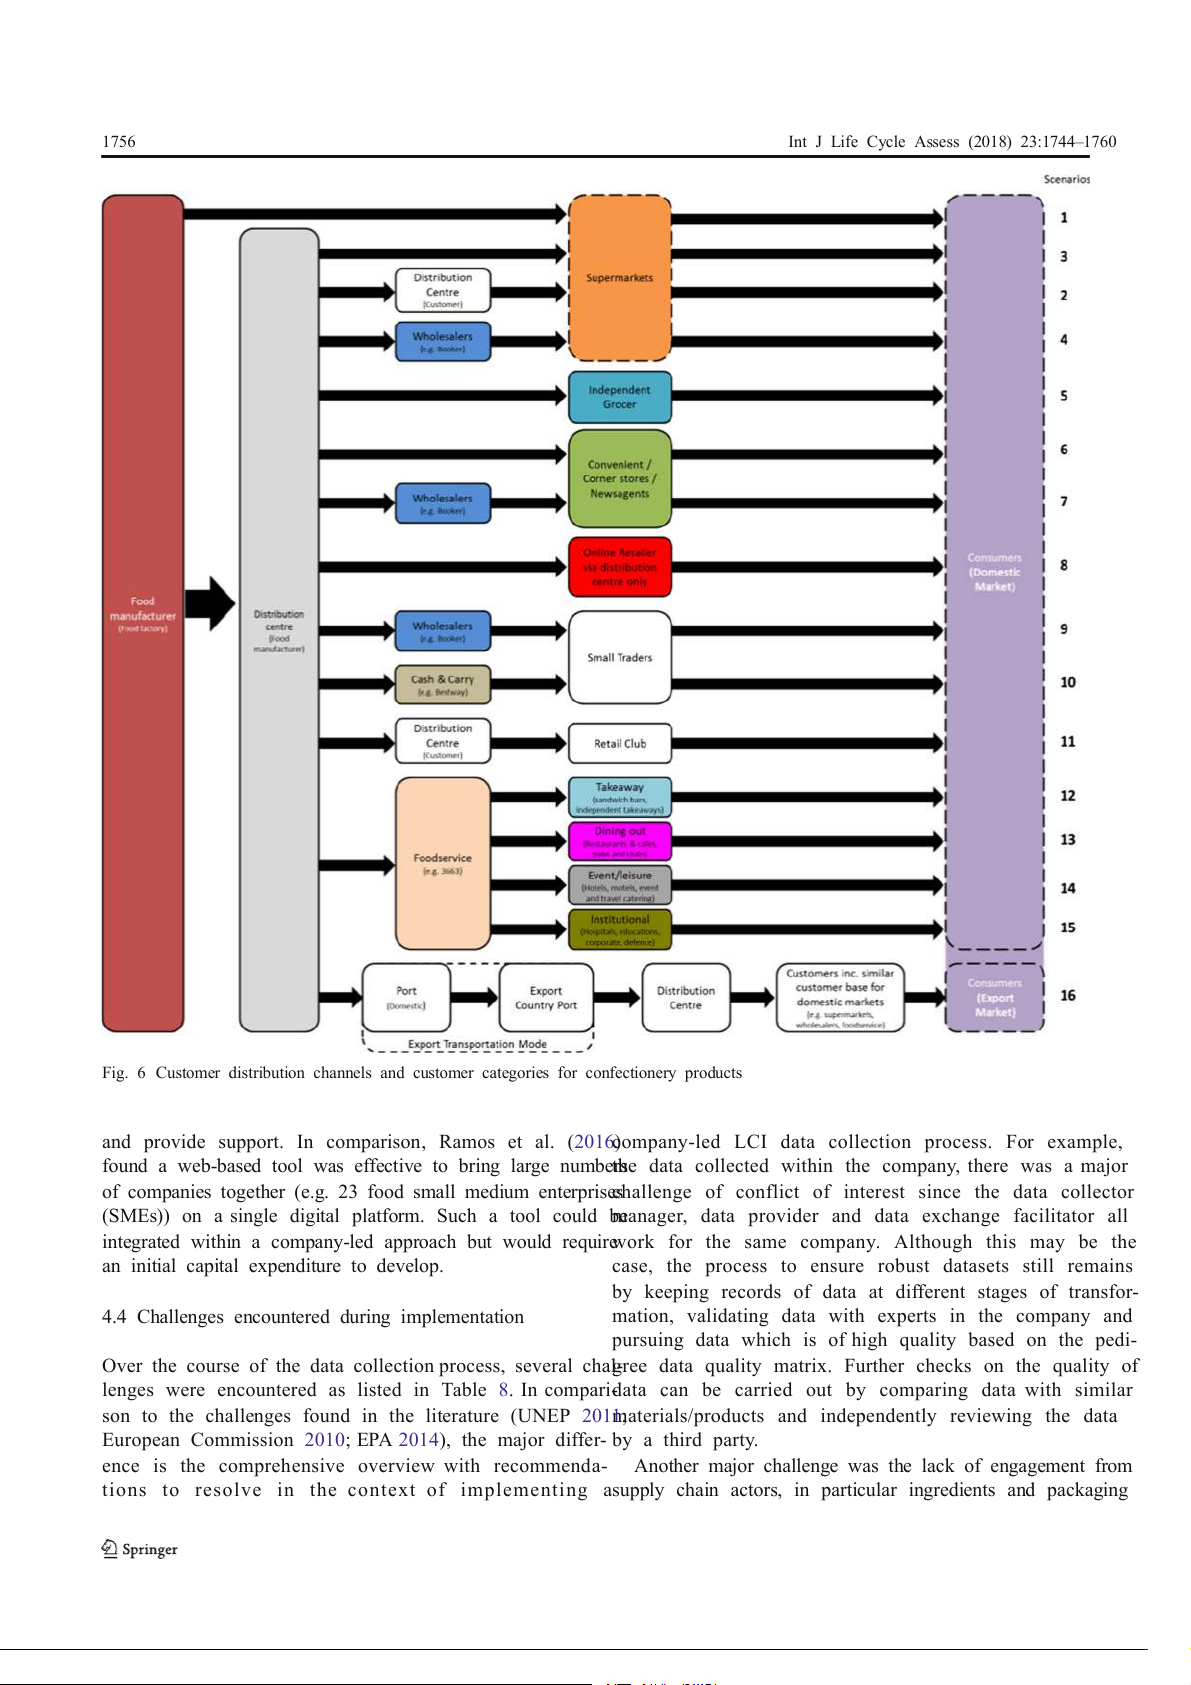
Another aspect of the supply chain which was visually
represented was the upstream confectionery supply chain in
3.4 Effectiveness of tools and processes deployed
terms of distribution and retail. Due to the history of Nestlé in
the UK, they have developed mature channels to a range of
A subjective assessment is made of the tools and processes
customers in the UK. As such, the upstream section of the
deployed through the data collection process in terms of the
supply chain is complex and diverse. Initially, the starting Table 4 Factory and product category level environmental Scale Number of Electricity Natural gas Water Solid waste resource consumption SKUs (kWh/ton) (kWh/ton) (m3/ton) (ton/ton) Confectionery factory 130 539 1045 3.55 0.041 Chocolate product 9a 412b 701b 4.16b 0.020b category Sugar product category 8 a 642b 1570b 3.64b 0.057b Chocolate biscuit 3a 714b 1081b 2.22b 0.070b product category a Major SKUs
b Estimated based on average SKU
Int J Life Cycle Assess (2018) 23:1744–1760 1753 Table 5 Environmental aspects
of retail in ambient conditions, for Scale Electricity Natural gas Water Solid waste different scales (kWh/m2 day) (kWh/m2 day) (m3/m2 day) (ton/m2 day) Superstore 0.0944 0.0267 1.53 × 10 −4 6.02 × 10⁻⁶ Supermarket 0.0419 0.0113 7.12 × 10 −5 5.21 × 10⁻⁶ Warehouse 0.021 0.00877 8.77 × 10 −5 1.42 × 10⁻⁵
point to collect data was from retailers but it was unclear if th
o ifsa manufacturing company to efficiently collect environ-
was the right choice given the diversity of customers. In order
mental data across the whole supply chain. For example, it
to navigate through the complexity, a literature review waswas found that Nestlé—a multinational food company—was
carried out to find different distribution channels for food able to harness the perceived power of the organisation and
products. The information collected was combined withtranslate into a supply chain leadership role to collect data. For
Nestlé data based on discussions with the marketing and salesexample, the involvement of more than 50 different people
teams to create a full and general representation of the entir a e
cross many divisions within the company was engaged to
customer portfolio for confectionery; see Fig. 6.
identify actors across the supply chain and to facilitate data
exchange. In comparison to existing approaches (Ramos et al.
3.5 Challenges encountered during primary data
2016; Jungbluth et al. 2016; Recchioni et al. 2015; Mistry collection
et al. 2016; Bellon-Maurel et al. 2014; Popp et al. 2013;
Finkbeiner et al. 2003; Pomper 1998), the collection of data
In the course of the LCI data collection process, Nestlé en h -
as been primarily on a voluntary basis where the implemen-
countered several challenges which are shown in Table 8 with
tation process is managed by a third party to drive the collec-
a range of recommendations proposed to resolve.
tion of data from different actors across the supply chain.
Another major benefit is the speed to collect primary data.
The application of the LCI process at a confectionery factory 4 Discussion
in the UK found that a company-led approach was able to
collect a portfolio of new environmental data in a relatively
4.1 Comparison with other data collection approaches
short period of 5 months. In total, 100 primary LCI datasets
were collected from 67 ingredients and packaging suppliers
A critical assessment of a novel integrated LCI data collection
across 13 countries. In comparison to other data collection
process and strategy has been presented from the perspective
approaches in the food industry (Ramos et al. 2016;
of a multinational food company. It is the first of its kind a J n u d
ngbluth et al. 2016; Milà i Canals et al. 2011), they do not
helps to fill an important gap in the existing knowledge on
provide an indication of the time involved to carry out data
alternative strategies for LCI data collection. One of the key
collection, especially for large amounts of data at different
features of the process is the ability to leverage the resources
scales of problems, e.g. single product, multi-products, factory 4.50 4.00 3.50 3.00 ) S 2.50 Q 2.00 cores(D 1.50 ualityS 1.00 ataQ D 0.50 0.00 1 3 5 7 9 11 13 15 17 19 21 23 25 27 29 31 33 35 37 39 41 43 45 47 49 51 53 55 57 59 61 63 65 67 69 71 73 75 77 79 81 83 85 87 89 91 93 95 97 99 101 103 105 107 109 111 113 115 117 119 121 123 LCIdataset
Fig. 3 A comparison the DQS for 129 LCI datasets collected 1754
Int J Life Cycle Assess (2018) 23:1744–1760 Table 6
DQSs for data collected categorised into high, medium an m
d ajority of primary data collected was found to be medium low data quality
quality whereas the secondary data varied from high-to-low Data Farm Raw
Factory Distribution Retail Disposal quality. However, the primary data had the potential to be high quality materials
quality but was limited due to the representativeness criteria group processing
since the data only represented one site and not the whole
market/country. Further statistical analysis showed the prima- High 2 0 0 0 0 0
ry data had the lowest variation based on the standard devia- Medium 1 96 4 0 0 0
tions of DQS whereas secondary data for disposal and farm Low 10 0 0 1 1 8
stage had the highest variation. For the retail and disposal
level, only partially completed LCI questionnaires were
returned. As such, data was sourced from the Ecoinvent data-
or even company level. Based on the experience gained, it i
b sase (Ecoinvent 2016). However, due to the generalised na-
expected that a second round of data collection could result itn
ure of LCI profiles in Ecoinvent, the quality was found to be
a shorter timeframe of a few months. For example, withl a
ow based on the ratings assigned on the pedigree matrix.
projected timeframe of 3 months, this could result in 400
Overall, the highest data quality was obtained for those com-
LCI datasets per year. Therefore, in addition to existing routes
panies that operate closer along the food supply chain to the
of data collection (Ramos et al. 2016; Mistry et al. 2016; Poppmultinational food company leading the data collection pro-
et al. 2013; Finkbeiner et al. 2003; Ecodesk 2015), the role ofcess. Hence, the critical stages of the supply chain requiring
companies can significantly create more LCI data which can
further research would be agricultural production (farm level)
benefit both companies, supply chain actors and wideron one side, and retailers and waste treatment companies on industry. the other side.
One other major benefit is the ability to create up-to-date One of the major limitations found in practice was the
and high-quality data. For example, the primary data collectedcollection of primary data at farm level. For the farm level, it
has resulted in 100 new LCI datasets where the majority of th w e
as found few suppliers manage and operate vertically inte-
LCI datasets are not found anywhere in the literature (NREL
grated operations from farm level to ingredient/packaging
2014; Quantis 2014). In addition, the LCI datasets are rela-manufacture. However, due to the complex nature of farms,
tively new where at the time of collecting, data were no mo t r
hey can perform multiple services/functions over various pe-
than 1 year old. Such data will be particularly useful for envi-
riods of time creating multiple outputs. As such, the collection
ronmental analysis in the confectionery industry which in theof primary data was out of scope as the timeframe to compile
EU alone comprises of over 11,000 confectionery manufac-an inventory of all the materials and energy consumed at a turers (CAOBISCO 2015).
farm level is much longer (e.g. months to years) compared to
Furthermore, another major benefit is the transparency inthe other life cycle stages. In addition, the infrastructure and
data collection to encourage high quality and reproducibility.technology required to collect data is less advanced for
For example, novel processes have been developed to visuallyfarmers and have limited resources in terms of knowledge
describe the rationalisation and identification of ingredients, and expertise. Therefore, data was sourced from secondary
suppliers and customers across the supply chain compared toLCI DBs such as WFLDB (Nemecek et al. 2014) and
previous approaches (Ramos et al. 2016; Jungbluth et al.AgriBalyse (Koch and Salou 2013; Colomb et al. 2015). To
2016; Recchioni et al. 2015; Mistry et al. 2016; Bellon- this extent, the pursuit of specific farm level data should only Maurel et al. 2014).
be for significant raw materials as there is a trade-off between
the volume of LCI data collected and resources expended in
4.2 Quality of data collected and gaps in data
terms of people’s time. Despite the inclusion of secondary
data, the LCI data collection process has shown that a multi-
The quality of data collected was found to vary considerably
national company can potentially engage and facilitate LCI
from both primary and secondary sources based on the pedi-data collection directly with farmers or indirectly through
gree matrix (Weidema and Wesnaes 1996). For example, thefirst-tier suppliers. Although, longer-term initiatives are
Table 7 Statistical analysis of DQS Farm Raw materials Factory Distributiona Retaila Disposal processing Average 3.23 2.74 2.78 n/a n/a 3.97 Standard deviation 0.95 0.08 Negligible n/a n/a 0.17 a One dataset only available
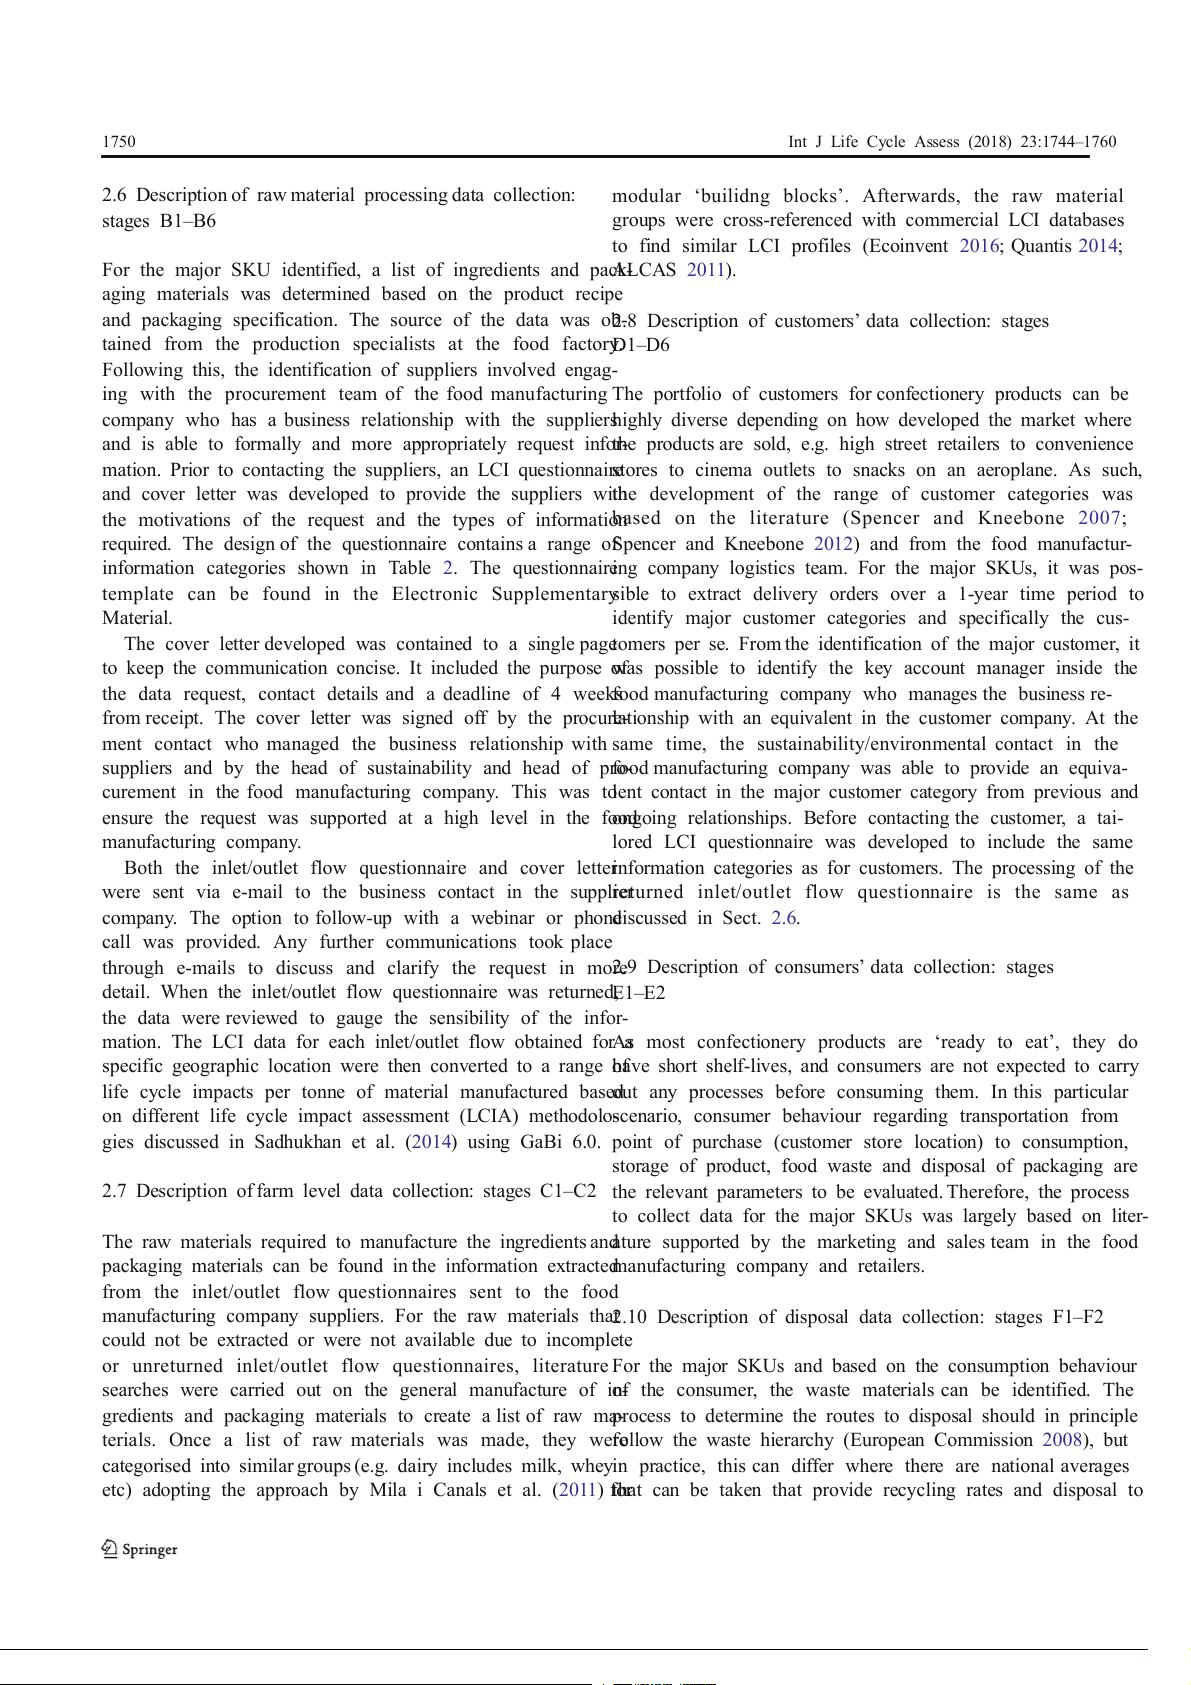
Int J Life Cycle Assess (2018) 23:1744–1760 1755 Fig. 4 Assessment of the
effectiveness of tools deployed
required to establish environmental training through formal4.3 Effectiveness of tools and processes
partnerships (e.g. TESCO 2015; Nestlé 2015a, b, c) to support
and reduce the environmental impact at farms.
An assessment of the different tools and processes applied dur-
Overall, several recommendations are proposed to resolveing the LCI data collection is shown in Fig. 4. Although such
data gaps and ensure the highest quality level for incomplete
ools and processes are found in the general literature (UNEP
datasets, outdated data and data using proxies (Sadhukhan2011; European Commission 2010; EPA 1993, 199 , 5 2014), we
et al. 2014). For incomplete datasets, only sections whichave presented for the first time an assessment of what was
are completed and provide meaningful information are recom-effective from the implementation experience on a two-axis
mended. For outdated data, the pursuit of recent data is en
g -raph showing the effectiveness to collect data with the effort
couraged. For data using proxies, an investigation of the repr-equired. It was found that the most effective process was the
resentation in terms of correlation and relevance should befollow-up calls/e-mails with read receipts to data providers.
assessed. In addition, the role of external LCA experts shouldHowever, such an approach was rather intensive and repetitive
be sought to provide additional quality assurances on the coma-s records were kept to track communications.
piled dataset. For example, possible explanations of anomalies Another effective process was the regular meetings with
in data and verification of expected results.
Nestlé personnel to review progress, identify any problems
Fig. 5 Two ingredients map showing how suppliers were reduced from start to end 1756
Int J Life Cycle Assess (2018) 23:1744–1760
Fig. 6 Customer distribution channels and customer categories for confectionery products
and provide support. In comparison, Ramos et al. (2016)company-led LCI data collection process. For example,
found a web-based tool was effective to bring large numbertshe data collected within the company, there was a major
of companies together (e.g. 23 food small medium enterprises
challenge of conflict of interest since the data collector
(SMEs)) on a single digital platform. Such a tool could be
manager, data provider and data exchange facilitator all
integrated within a company-led approach but would requirework for the same company. Although this may be the
an initial capital expenditure to develop.
case, the process to ensure robust datasets still remains
by keeping records of data at different stages of transfor-
4.4 Challenges encountered during implementation
mation, validating data with experts in the company and
pursuing data which is of high quality based on the pedi-
Over the course of the data collection process, several chal-
gree data quality matrix. Further checks on the quality of
lenges were encountered as listed in Table 8. In compari-data can be carried out by comparing data with similar
son to the challenges found in the literature (UNEP 2011;
materials/products and independently reviewing the data
European Commission 2010; EPA 2014), the major differ- by a third party.
ence is the comprehensive overview with recommenda-
Another major challenge was the lack of engagement from
tions to resolve in the context of implementing asupply chain actors, in particular ingredients and packaging
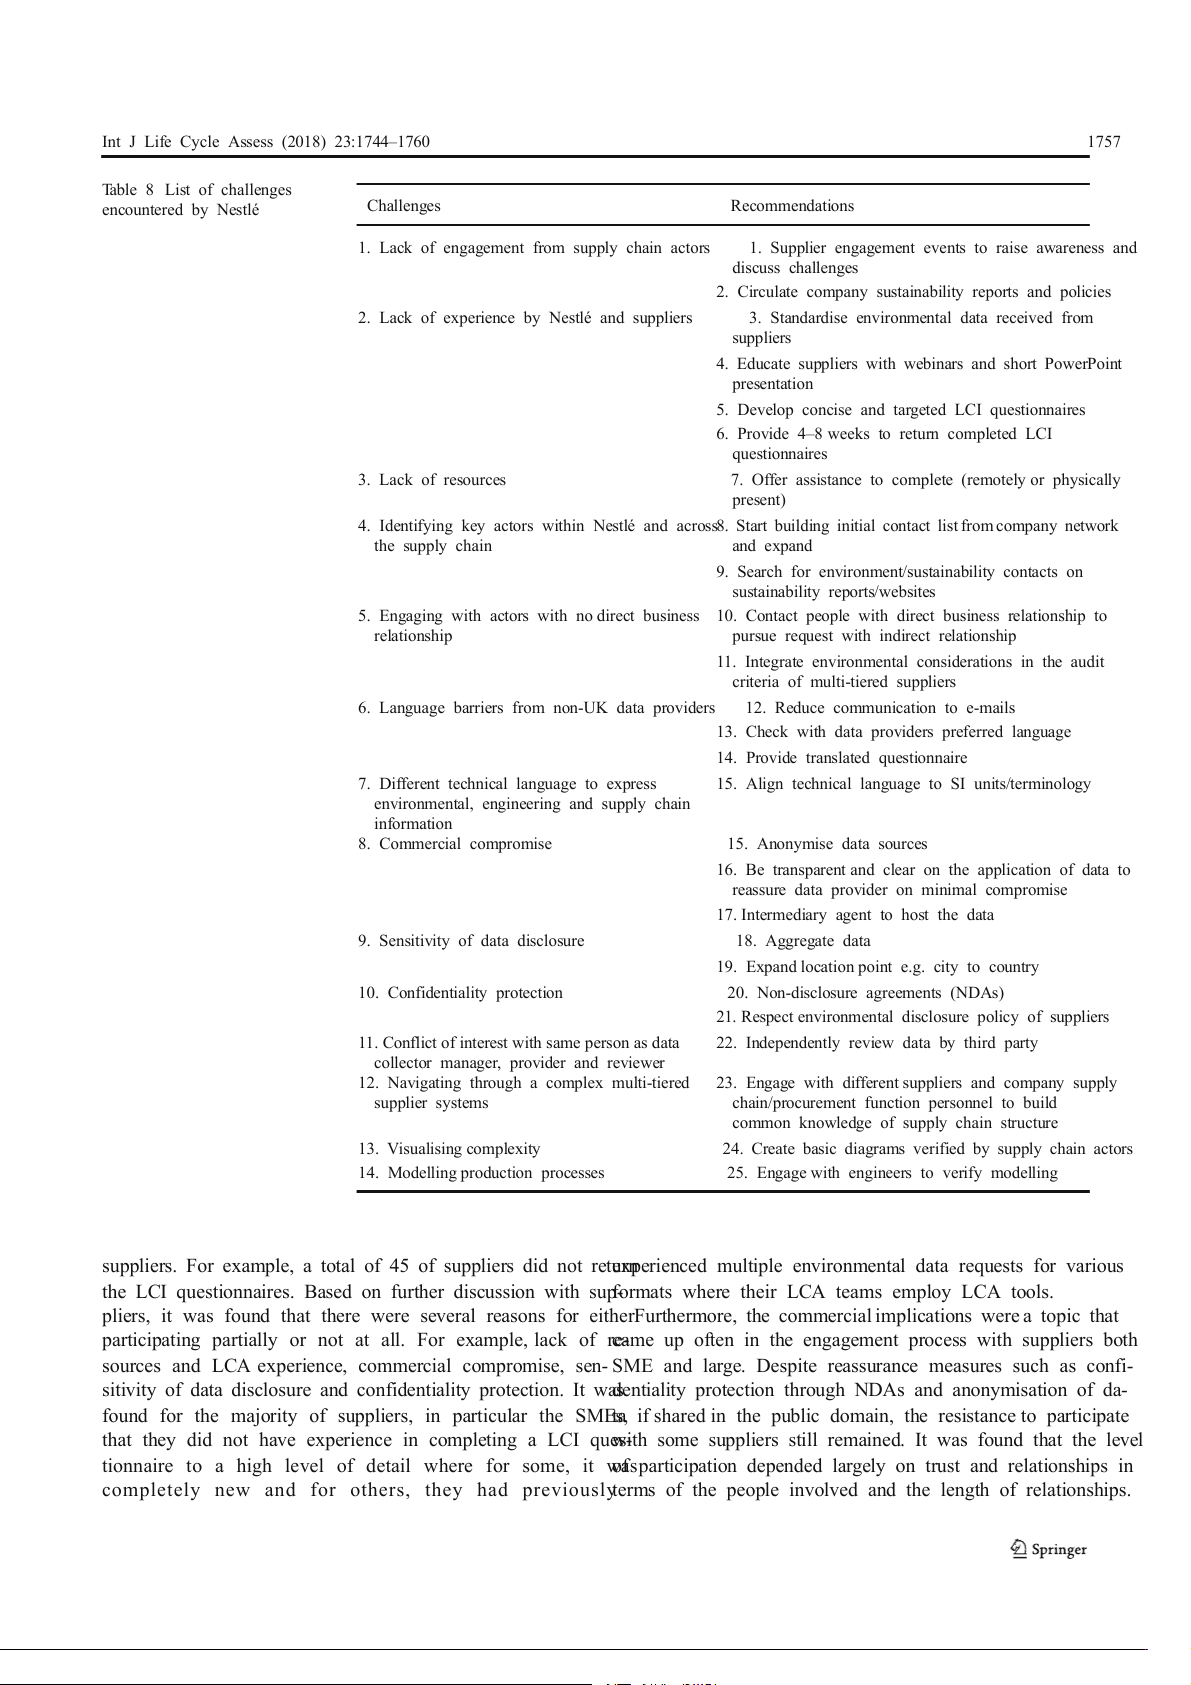
Int J Life Cycle Assess (2018) 23:1744–1760 1757 Table 8 List of challenges encountered by Nestlé Challenges Recommendations
1. Lack of engagement from supply chain actors
1. Supplier engagement events to raise awareness and discuss challenges
2. Circulate company sustainability reports and policies
2. Lack of experience by Nestlé and suppliers
3. Standardise environmental data received from suppliers
4. Educate suppliers with webinars and short PowerPoint presentation
5. Develop concise and targeted LCI questionnaires
6. Provide 4–8 weeks to return completed LCI questionnaires 3. Lack of resources
7. Offer assistance to complete (remotely or physically present)
4. Identifying key actors within Nestlé and across8. Start building initial contact list from company network the supply chain and expand
9. Search for environment/sustainability contacts on
sustainability reports/websites
5. Engaging with actors with no direct business 10. Contact people with direct business relationship to relationship
pursue request with indirect relationship
11. Integrate environmental considerations in the audit
criteria of multi-tiered suppliers
6. Language barriers from non-UK data providers
12. Reduce communication to e-mails
13. Check with data providers preferred language
14. Provide translated questionnaire
7. Different technical language to express
15. Align technical language to SI units/terminology
environmental, engineering and supply chain information 8. Commercial compromise 15. Anonymise data sources
16. Be transparent and clear on the application of data to
reassure data provider on minimal compromise
17. Intermediary agent to host the data
9. Sensitivity of data disclosure 18. Aggregate data
19. Expand location point e.g. city to country 10. Confidentiality protection
20. Non-disclosure agreements (NDAs)
21. Respect environmental disclosure policy of suppliers
11. Conflict of interest with same person as data
22. Independently review data by third party
collector manager, provider and reviewer
12. Navigating through a complex multi-tiered
23. Engage with different suppliers and company supply supplier systems
chain/procurement function personnel to build
common knowledge of supply chain structure 13. Visualising complexity
24. Create basic diagrams verified by supply chain actors
14. Modelling production processes
25. Engage with engineers to verify modelling
suppliers. For example, a total of 45 of suppliers did not retuern
xperienced multiple environmental data requests for various
the LCI questionnaires. Based on further discussion with sup-
formats where their LCA teams employ LCA tools.
pliers, it was found that there were several reasons for eitherFurthermore, the commercial implications were a topic that
participating partially or not at all. For example, lack of rec-ame up often in the engagement process with suppliers both
sources and LCA experience, commercial compromise, sen- SME and large. Despite reassurance measures such as confi-
sitivity of data disclosure and confidentiality protection. It was
dentiality protection through NDAs and anonymisation of da-
found for the majority of suppliers, in particular the SMEs
t ,a if shared in the public domain, the resistance to participate
that they did not have experience in completing a LCI ques-
with some suppliers still remained. It was found that the level
tionnaire to a high level of detail where for some, it wa
ofsparticipation depended largely on trust and relationships in
completely new and for others, they had previouslyterms of the people involved and the length of relationships. 1758
Int J Life Cycle Assess (2018) 23:1744–1760
4.5 Motivations for companies to participate
food company. It represents one of the very first such studies
of its type to critically assess the role and effectiveness of a
Despite the challenges, several motivating factors were multinational food company on collecting LCI data across
found for encouraging data providers to participate in thethe supply chain. For example, the application at a multi-
company-led LCI data collection process as part of theirproduct confectionery factory in the UK has resulted in a
overarching Corporate Social Responsibility (CSR) strategy portfolio of 100 new environmental LCI datasets from the
(Dahlsrud 2008). For example, the opportunity to collabo-interaction with 67 ingredients and packaging suppliers
rate with Nestlé (e.g. strengthen relationship, ways of work-
across the globe and several food retailers. However, the
ing and partnerships), opportunity to learn about the envi-majority of primary data collected was from ingredients
ronmental impact of their organisation/product in Nestlé’s and packaging suppliers, food factory and partial data for
products and opportunity to develop learning experience ofretailers and waste disposal providers with no data at the
LCI data request. However, in total, only 55% of suppliersfarm level. In addition, several challenges were encountered
returned the LCI questionnaire. A surprising finding was the
during implementation from the lack of experience, identi-
lack of implementation from some companies who publical-fying key actors, confidentiality protection and complexity
ly advocated sustainability improvements and supplier en-of multi-tiered supplier systems. Despite this, by using the
gagement both at an SME and (multinational corporation)internal resources, business relationships and influence of a
MNC level as part of their CSR strategy. Despite this, the
multinational food company, it was found that a multination-
role of CSR can be a strong motivator for companies to
al company can play a critical role, especially in engagement
participate as it was generally found that the sustainabilityand facilitation by transforming latent data found within
commitments by different companies helped companies ini-companies or reported publically across the supply chain
tially participate. As such, it is recommended that a range o t f owards expansion of LCI data.
initiatives are developed to encourage efficient LCI data col- Furthermore, in order to encourage the reproducibility for
lection by the company (i.e. Nestle). Such initiatives willother multinational companies, it is recommended the pro-
aim to bring supply chain actors together to develop a mu-
posed LCI data collection process serves as a foundation to
tual understanding on promoting sustainable supply chains.contribute towards a standardised procedure, in particular for
For example, workshops to discuss strategies to improvefood products. The specific features which can contribute to-
supply chain sustainability, specific partnerships with sup-wards a standardised procedure includes (1) process flow di-
pliers on key ingredients and LCA/environmental awarenessagram of LCI data collection, (2) identification and role of training in the food industry.
actors in the company and across the supply chain, (3) supply
chain maps, (4) processes to manage gaps in data and data
4.6 Towards a standardised procedure in the food sector
quality and (5) LCI questionnaire. Overall, the key benefits
of the proposed LCI data collection process includes (1) the
The LCI data collection process has the potential to transition
ability to leverage the resources of a manufacturing company
towards a standardised procedure for the food sector subject to
t efficiently collect environmental data across the whole sup-
further application and consensus of stakeholders across theply chain, (2) the speed to collect primary data, (3) the ability
food industry. However, not all food companies have the abil-to create up to date and medium to high quality data and (4)
ity to lead an LCI data collection process across the supplty
he increased transparency in data collection. However, further
chain since these companies are either SMEs or do not mane-ngagement with different food companies and applications
ufacture finished products. As such, in this context, these coma-cross food categories would be required to develop a robust
panies can have a different role in which they can supposrttandardised procedure, especially supported by research in-
organisations seeking to lead an LCI data collection processtitutes and NGOs.
across the supply chain. Alternatively, such companies can
group together to initiate an LCI data collection process for Acknowledgements
We wish to gratefully acknowledge and thank the
common materials shared between the companies. DespiteEPSRC and Nestlé UK Ltd. for their assistance and support in funding
this, the LCI data collection process and strategy provides an
this research as part of the Engineering Doctorate on Sustainability for
initial basis for other companies to further design their respec
E-ngineering and Energy Systems (EngD SEES) at the University of
tive data collection strategies.
Surrey. We would also like to thank two anonymous reviewers for their
suggestions and comments on previous versions.
Open Access This article is distributed under the terms of the Creative 5 Conclusions
Commons Attribution 4.0 International License (htt p://
creativecommons.org/licenses/by/4.0/), which permits unrestricted use,
distribution, and reproduction in any medium, provided you give
This paper has presented a novel LCI data collection process
appropriate credit to the original author(s) and the source, provide a link
developed, managed and implemented by a multinationalto the Creative Commons license, and indicate if changes were made.
Int J Life Cycle Assess (2018) 23:1744–1760 1759 References
European Commission (2008) Directive 2008/98/EC of the European
Parliament and of the Council of 19 November 2008 on waste and
repealing certain Directives. http://eur-lex.europa.eu/legal-content/
Agri-footprint gouda (2014) Agri-footprint methodology and basic prin-
EN/TXT/?uri=CELEX:32008L0098. Accessed 28/09/2017
ciples version 1.0. http://www.agri-footprint.com/assets/Agri- European Commission (2010) Joint Research Centre—Institute for
Footprint-Part1-Methodologyandbasicprinciples-Version1.0.pdf.
Environment and Sustainability: International Reference Life Accessed 02/03/2016
Cycle Data System (ILCD) Handbook—general guide for life cycle
ALCAS (2011) AusLCI datasets. http://alcas.asn.au/AusLCI/index.php/
assessment—detailed guidance. First edition March 2010. EUR Datasets. Accessed 12/04/2015
24708 EN. Luxembourg. Publications Office of the European Union
ALCAS (2014) Requirements for the development of AusLCI data sets.European Commission (2013) Roadmap for the European Platform on
http://alcas.asn.au/AusLCI/Documents/AUSLCI_Requirements_
life cycle assessment: facilitating data collection and sustainability 30.pdf. Accessed 04/03/2015
assessments for policy and business. In: Fazio S, Recchioni M,
Almeida MI, Dias AC, Demertzi M, Arroja L (2015) Contribution to the
Camillis C, Mathieux F, Pennington D, Allacker K, Ardente F,
development of product category rules for ceramic bricks. J Clean
Benini L, Goralczyk M, Mancini L, Pant R, Sala S, Schau E. Prod 92:206–215
European Commission, Joint Research Centre, Institute for
Ang CT, Morad N, Ismail N (2014) Challenges and possible drivers of Environment and Sustainability. http://publications.jrc.ec.europa.
LCA implementation in small and medium enterprises (SMEs) in
eu/repository/bitstream/JRC85205/roadmap%20td%202%202%
Malaysia: a review. Pertanika J Soc Sci Hum 22:335–347
20%20awp%202013%20ensure_final.pd. Accessed 25/09/2017
Bare J (2011) TRACI 2.0: the tool for the reduction and assessment of
Finkbeiner M, Krinke S, Oschmann D, Saeglitz T, Schaper S, Schmidt W-
chemical and other environmental impacts 2.0. Clean Technol
P, Schnell R (2003) Data collection format for life cycle assessment Environ 13:687–696
of the German association of the automotive industry (VDA). Int J
Bellon-Maurel V, Short MD, Roux P, Schulz M, Peters GM (2014) Life Cycle Assess 8:379–381
Streamlining life cycle inventory data generation in agriculture using Finnveden G, Hauschild MZ, Ekvall T, Guinee J, Heijungs R, Hellweg S,
traceability data and information and communication technolo-
Koehler A, Pennington D, Suh S (2009) Recent developments in life
gies—part I: concepts and technical basis. J Clean Prod 69:60–66
cycle assessment. J Environ Manag 91:1–21
Berkhout F, Howes R (1997) The adoption of life-cycle approaches by
Goedkoop M, Heijungs R, Huijbregts M, de Schryver A, Struijs J, van
industry: patterns and impacts. Resour Conserv Recy 20:71–94
Zelm R (2009) ReCiPe 2008. A life assessment method which com-
BONSAI (2016) Big Open Network for Sustainability Assessment
prises harmonised category indicators at the midpoint and the end-
Information. https://bonsai.uno. Accessed 04/03/2015
point level. Report I: characterisation. Ministry of Housing, Spatial
BSI PAS 2050 (2011) How to carbon your product footprint, identify
Planning and Environment, Amsterdam
hotspots and reduce your emission in the supply chain. In: The
Guinée JB, Gorrée M, Heijungs R, Huppes G, Kleijn R, de Koning A, van
Guide to PAS2050–2011. http://shop.bsigroup.com/upload/shop/
Oers L, Wegener Sleeswijk A, Suh S, Udo de Haes HA, de Bruijn H,
download/pas/pas2050.pdf. Accessed 28/09/2017
van Duin R, Huijbregts MAJ (2002) Handbook on life cycle assess-
CAOBISCO (2015) CAOBISCO annual report. http://caobisco.eu/
ment. Operational guide to the ISO standards. Kluwer Academic
public/images/page/caobisco-31032016102825-CAOBISCO-2015- Publishers, Dordrecht
Annual-Report-WEB.pdf. 05/03/2016
IPCC (2006) IPCC guidelines for National Greenhouse Gas Inventories.
Colomb V, Amar SA, Mens CB, Gac A, Gaillard G, Koch P, Mousset J, Intergovernmental panel on climate change, Geneva
Salou T, Tailleur A, Werf HMG (2015) Oilseeds & fats crops and lipds. 22. D104
Islam S, Ponnambalam SG, Lam HL (2016) Review on life cycle inven-
Corporate Register (2017) Stats. http://www.corporateregister.com/stats.
tory: methods, examples and applications. J Clean Prod Part B 136: Accessed 30/04/2017 266–278
Credit 360 (2015) About Us. http://www.credit360.com/credit/site/en/ ISO (2006) ISO 14044, environmental management—life cycle assess-
about_us.acds. Accessed 04/03/2016
ment—requirements and guidelines, Geneva
Dahlsrud A (2008) How corporate social responsibility is defined: anJimenez-Gonzalez C, Kim S, Overcash M (2000) Methodology for de-
analysis of 37 definitions. Corp Soc Responsib Environ Manag
veloping gate-to-gate life cycle inventory information. Int J Life 15:1–13 Cycle Assess 5:153–159
Dong YH, Ng T, Kwan AHK, Wu SK (2015) Substituting local data fo
J rolliet O, Saade-Sbeih M, Shaked S (2015) Environmental life cycle
overseas life cycle inventories – a case study of concrete products in
assessment. CRC Press, Boca Raton
Hong Kong. J Clean Prod 87:414–422
Jungbluth N, Keller R, König A (2016) ONE TWO WE—life cycle
Dowson M, Grogan M, Birks T, Harrison D, Craig S (2012) Streamlined
management in canteens together with suppliers, customers and
life cycle assessment of transparent silica aerogel made by supercrit-
guests. Int J Life Cycle Assess 21(5):646–653
ical drying. Appl Energ 97:396–404
Kellens K, Dewulf W, Overcash M, Hauschild M, Duflou JR (2011)
EA (2014) National Packaging Waste Database. https://npwd.
Methodology for systematic analysis and improvement of
environment-agency.gov.uk/Public/PublicSummaryData.aspx.
manufacturing unit process life cycle inventory (UPLCI) part 1: Accessed 04/03/2016
methodology description. Int J Life Cycle Assess 17:69–78
Ecodesk (2015) About Us. https://www.ecodesk.com/aboutus. Accessed Kim DB, Shin S-J, Shao G, Brodsky A (2015) A decision-guidance 04/03/2016
framework for sustainability performance analysis of manufacturing
Ecoinvent (2016) The ecoinvent database. http://www.ecoinvent.org/
processes. Int J Adv Manuf Tech 78:1455–1471 database/. Accessed 12/04/2016
Koch P, Salou T (2013) Agribalyse: methodology version 1.1. http://
EPA (1993) Life-cycle assessment: inventory guidelines and principles.
www.ademe.fr/sites/default/files/assets/documents/agribalyse_
http://www.epa.gov/nscep/index.html. Accessed 04/03/2016
methodology_report_v1.1.pdf. Accessed: 01/03/2015
EPA (1995) Guidelines for assessing the quality of life-cycle inventory
Lesage P, Samson R (2016) The Quebec life cycle inventory database
analysis. http://www.epa.gov/nscep/index.html. Accessed 04/03/
project—using the ecoinvent database to generate, review, integrate, 2015
and host regional LCI data. Int J Life Cycle Assess 21:1282–1289
EPA (2014) Life cycle assessment (LCA). http://www.epa.gov/nrmrl/std/ Meinrenken CJ, Sauerhaft BC, Garvan AN, Lackner KS (2014)
lca/lca.html. Accessed 04/03/2015
Combining life cycle assessment with data science to inform 1760
Int J Life Cycle Assess (2018) 23:1744–1760
portfolio-level value-chain engineering—a case study at PepsiCo Rebitzer G, Ekvall T, Frischknecht R, Hunkler D, Norris G, Rydberg T, Inc. J Ind Ecol 18:641–651
Schmidt W-P, Suh S, Weidema BP, Pennington DW (2004) Life
Miah JH, Griffiths A, McNeill R, Poonaji I, Martin R, Morse S, Yang A, cycle assessment. Part 1: framework, goal and scope definition,
Sadhukhan J (2015a) Creating an environmentally sustainable food
inventory analysis, and applications. Environ Int 30:701–720
factory: a case study of the lighthouse project at Nestlé. ProcediaRecchioni M, Blengini GA, Fazio S, Mathieux F, Pennington D (2015) CIRP 26:229–234
Challenges and opportunities for web-shared publication of quality-
Miah JH, Griffiths A, McNeill R, Poonaji I, Martin R, Morse S, Yang A, assured life cycle data: the contributions of the life cycle data net-
Sadhukhan J (2015b) A small-scale transdisciplinary process to
work. Int J Life Cycle Assess 20(7):895–902
maximising the energy efficiency of food factories: insights andResta B, Gaiardelli P, Pinto R, Dotti S (2016) Enhancing environmental
recommendations from the development of a novel heat integration
management in the textile sector: an organisational-life cycle assess-
framework. Sustain Sci 10(4):621–637
ment approach. J Clean Prod 135:620–632
Mila i Canals L, Sim S, Garcia-Suarez T, Neuer G, Herstein K, Kerr C,
Roches A, Nemecek T, Gailard G, Plassmann K, Sim S, King H, Canals
Rigarlsford G, King H (2011) Estimating the greenhouse gas foot-
LM (2010) MEXALCA: a modular method for the extrapolation of
print of Knorr. Int J Life Cycle Assess 16:50–58
crop LCA. Int J Life Cycle Assess 15:842–854
Mistry M, Gediga J, Boonzaier S (2016) Life cycle assessment of nickel
Sadhukhan J, Ng KS, Hernandez EM (2014) Biorefineries and chemical
products. Int J Life Cycle Assess 21:1559–1572
processes. Design, integration and sustainability analysis. Wiley,
Nemecek T, Bengoa X, Lansche J, Mouron P, Rossi V, Humbert S (2014) UK
Methodological guidelines for the life cycle inventory of agriculturalScanlon KA, Cammarata C, Siart S (2013) Introducing a streamlined life
products. Version 2.0, July 2014. World Food LCA Database
cycle assessment approach for evaluating sustainability in defense
(WFLDB). Quantis and Agroscope, Lausanne
acquisitions. Environ Syst Decis 33:209–223
Nestlé (2013) Insight: how we’re further building sustainability into our
product design process. http://www.nestle.com/media/
Skone TJ, Curran MA (2005) LCAccess—global directory of LCI re-
newsandfeatures/ecodex-insight-blog. Accessed 04/03/2016
sources. J Clean Prod 13:1345–1350
Nestlé (2015a) Nestlé in society (full report). http://www.nestle.com/Spencer S, Kneebone M (2007) FoodMap: a comparative analysis of
asset-library/documents/library/documents/corporate_social_
Australian food distribution channels. http://www.agriculture.gov.
responsibility/nestle-csv-full-report-2014-en.pdf. Accessed 12/05/
au/SiteCollectionDocuments/ag-food/food/national-food-plan/ 2016
submissions-received/foodmap-an-analysis-of-the-australian-food-
Nestlé (2015b) The Nestlé Cocoal Plan. http://www.nestlecocoaplan.
supply-chain-30-july.pdf. Accessed 04/03/2016 com/. Accessed 12/12/2016
Spencer S,Kneebone M (2012) FOODmap: an analysis of the Australian
Nestlé (2015c) The Nescafe Plan. http://www.nescafe.com/
f o o d s u p p l y c h a i n . h t t p : / / w w w. a g r i c u l t u r e . g o v. a u /
sustainability_en_com.axcms. Accessed 04/03/2016
SiteCollectionDocuments/ag-food/food/national-food-plan/
Ning S-K, Chang N-B, Hung M-C (2013) Comparative streamlined life
submissions-received/foodmap-an-analysis-of-the-australian-food-
cycle assessment for two types of municipal solid waste incinerator.
supply-chain-30-july.pdf. Accessed 04/03/2016 J Clean Prod 53:56–66
Stoessel F, Juraske R, Pfsiter S, Hellweg S (2012) Life cycle inventory
NREL (2014) Data Discovery. https://www.lcacommons.gov/nrel/search.
and carbon and water foodprint of fruits and vegetables: application Accessed 04/03/2016
to a swiss retailer. Environ Sci Technol 46:3253–3262
PEF World Forum (2013) Product Environmental Footprint (PEF) Guide.Suh S, Huppes G (2005) Methods for life cycle inventory of a product. J
http://www.pef-world-forum.org/wp-content/uploads/2013/10/ Clean Prod 13:687–697
PEF_Guide.pdf. Accessed 12/04/2016
TESCO (2015) Milk & cream. http://realfood.tesco.com/our-food/milk/
Pennington D, Wolf MA, Bersani R, Pretato U (2007) Overcoming bar-
our-milk.html. Accessed 04/03/2016
riers to the broader implementation of life cycle thinking in business
Testa F, Nucci B, Tessitore S, Iraldo F, Daddi T (2016) Perceptions on
and public administration. Int J Life Cycle Asses 12:458–460
LCA implementation: evidence from a survey on adopters and
PlasticsEurope (2015) Eco-profile. http://www.plasticseurope.org/
nonadopters in Italy. Int J Life Cycle Assess 21:1501–1513
plasticssustainability/eco-profiles.aspx. Accessed 12/04/2016
UNEP (2011) Global guidance principles for life cycle assessment data-
Pomper SD (1998) Managing LCI data gathering. SAE technical paper
bases—a basis for Greener Processes and Products. http://www. series, p 1–6
unep.org/pdf/Global-Guidance-Principles-for-LCA.pdf. Accessed
Popp JS, Thoma GJ, Mulhern J, Jaeger A, LeFranc L, Kemper N (2013) 04/03/2016
Collecting comprehensive farm level data through a collaborativeWeidema BP, Wesnaes MS (1996) Data quality management for life cycle
approach: a framework developed for a life cycle assessment of fluid
inventories—an example of using data quality indicators. J Clean
milk production in the US. Int Dairy J 31:S15–S20 Prod 4:167–174
Quantis (2014) World Food LCA Database. http://www.quantis-intl.com/ Weidema BP, Bauer Ch, Hischier R, Mutel Ch, Nemecek T, Reinhard J, wfldb/. Accessed 04/03/2016
Vadenbo CO, Wernet G (2013) The ecoinvent database: overview
Ramos S, Larrinaga L, Albinarrate U, Jungbluth N, Ingolfsdottir GM,
and methodology, data quality guideline for the ecoinvent database
Yngvadottir E, Landquist B, Woodhousee A, Olafsdottir G, Esturo
version 3. www.Ecoinvent.Org. Accessed 20/05/2016
A, Zufía J, Perez-Villareal B (2016) SENSE tool: easy-to-use web-
based tool to calculate food product environmental impact. Int J LifeWFLDB (2014) Methodological guidelines for the life cycle inventory of Cycle Assess 21(5):710–721
agricultural products. http://www.quantis-intl.com/files/2714/0626/
Rebitzer G, Buxmann K (2005) The role and implementation of LCA
8848/WFLDB_MethodologicalGuidelines_20140723_v2.0.pdf.
within life cycle management at Alcan. J Clean Prod 13:1327–1335 Accessed 04/03/2016
Tài liệu liên quan:
-
Tiểu luận Phân Tích Giá Trái Cây 2023 | Kinh tế vĩ mô | Trường Đại học kinh tế Thành Phố Hồ Chí Minh
19 10 -
Bộ câu hỏi trắc nghiệm - Kinh tế học thị trường và cầu cung | Kinh tế vĩ mô | Trường Đại học kinh tế Thành Phố Hồ Chí Minh
19 10 -
Câu Hỏi Ôn Tập Phần Thị Trường | Kinh tế vĩ mô | Trường Đại học kinh tế Thành Phố Hồ Chí Minh
24 12 -
Kinh Tế Vi Mô: Câu Hỏi và Đáp Án Quan Trọng | Kinh tế vĩ mô | Trường Đại học kinh tế Thành Phố Hồ Chí Minh
22 11 -
Tiểu luận Món Huế và Thị Trường F&B Việt Nam | Kinh tế vĩ mô | Trường Đại học kinh tế Thành Phố Hồ Chí Minh
17 9