AAPL Industry Overview: Tech Advancements & Consumer Behavior Insights | Môn Derivatives and Risk Management - Trường Đại học Quốc tế, Đại học Quốc gia Thành phố Hồ Chí Minh
The advancement of technology in the industry 4.0 era is greatly influencing consumer behavior and expectations. Tài liệu được sưu tầm gồm 4 trang, giúp bạn ôn tập tốt hơn. Mời các bạn đón xem.
Môn: Derivatives and Risk Management 7 tài liệu
Trường: Trường Đại học Quốc tế, Đại học Quốc gia Thành phố Hồ Chí Minh 2 K tài liệu
Tác giả:

Preview text:
lOMoAR cPSD| 23136115
II. INDUSTRY AND COMPANY OVERVIEW 1. Apple Inc. (AAPL)
The advancement of technology in the industry 4.0 era is greatly influencing consumer
behavior and expectations. Beginning with the introduction of the "First touchscreen phone",
advancements in sophisticated software and applications at each phase have played a role in
encouraging consumer behavior regarding the purchase of such electronic devices. This is
likewise the driving force for major global technology companies like Apple, Samsung,
Microsoft, Sony, etc., to persistently compete against one another, innovating new products for
market sale to achieve greater revenue than the prior year. Focusing on the subject of "Operating
Systems," iOS is preferred over Android, which contributed to Apple ranking as the world's
third-largest technology company in 2023, with sales reaching $385.1 billion, according to a report by Forbes.
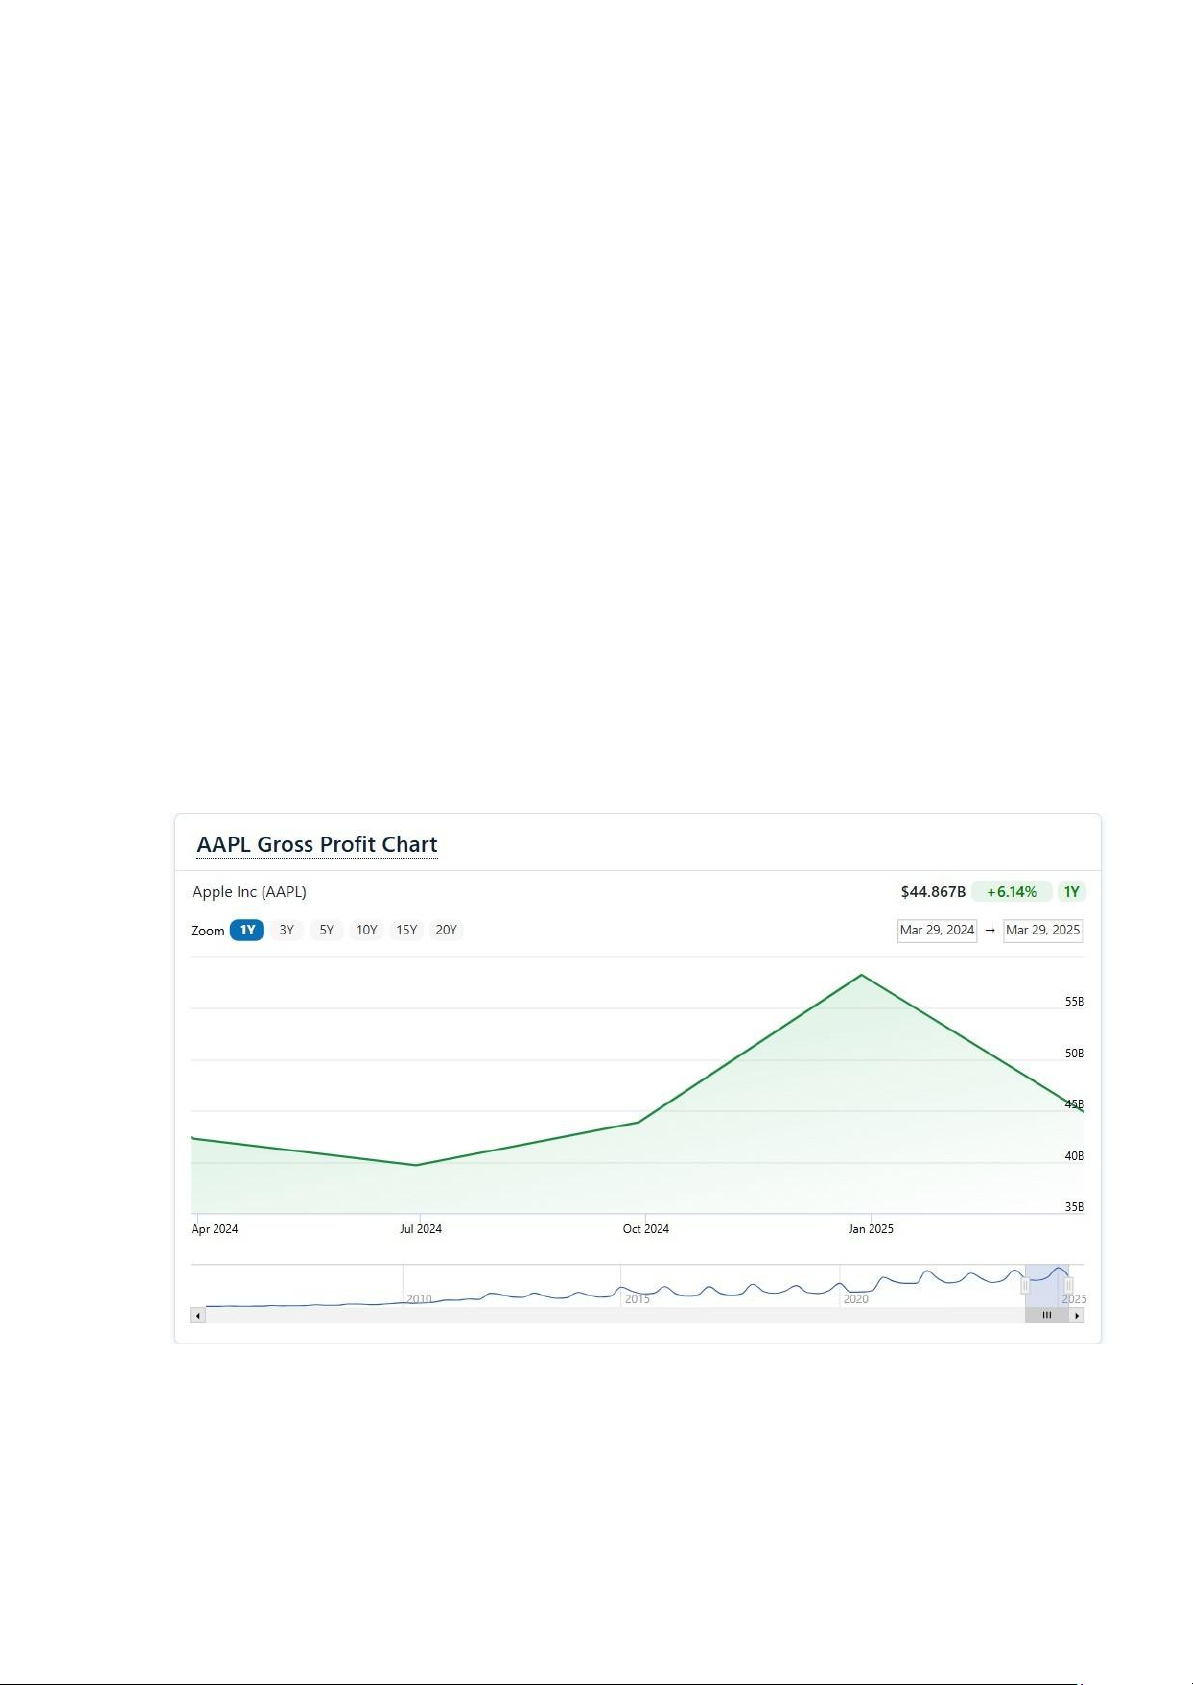
AAPL Gross Profit Margin Chart 2024 (Source: Finance Charts, 2025)
In the fiscal year ending March 29, 2025, Apple (AAPL) records a gross profit of $44.87
billion, up 6.14% year-over-year. The chart shows a slight decline in gross profit in mid-2024 but lOMoAR cPSD| 23136115
a sharp rebound in the first quarter of 2025, driven by strong holiday sales and the launch of
products like the iPhone 16 and MacBook M4. Services continue to be a major contributor to
profit margins, helping Apple maintain steady growth despite supply chain and manufacturing cost fluctuations.
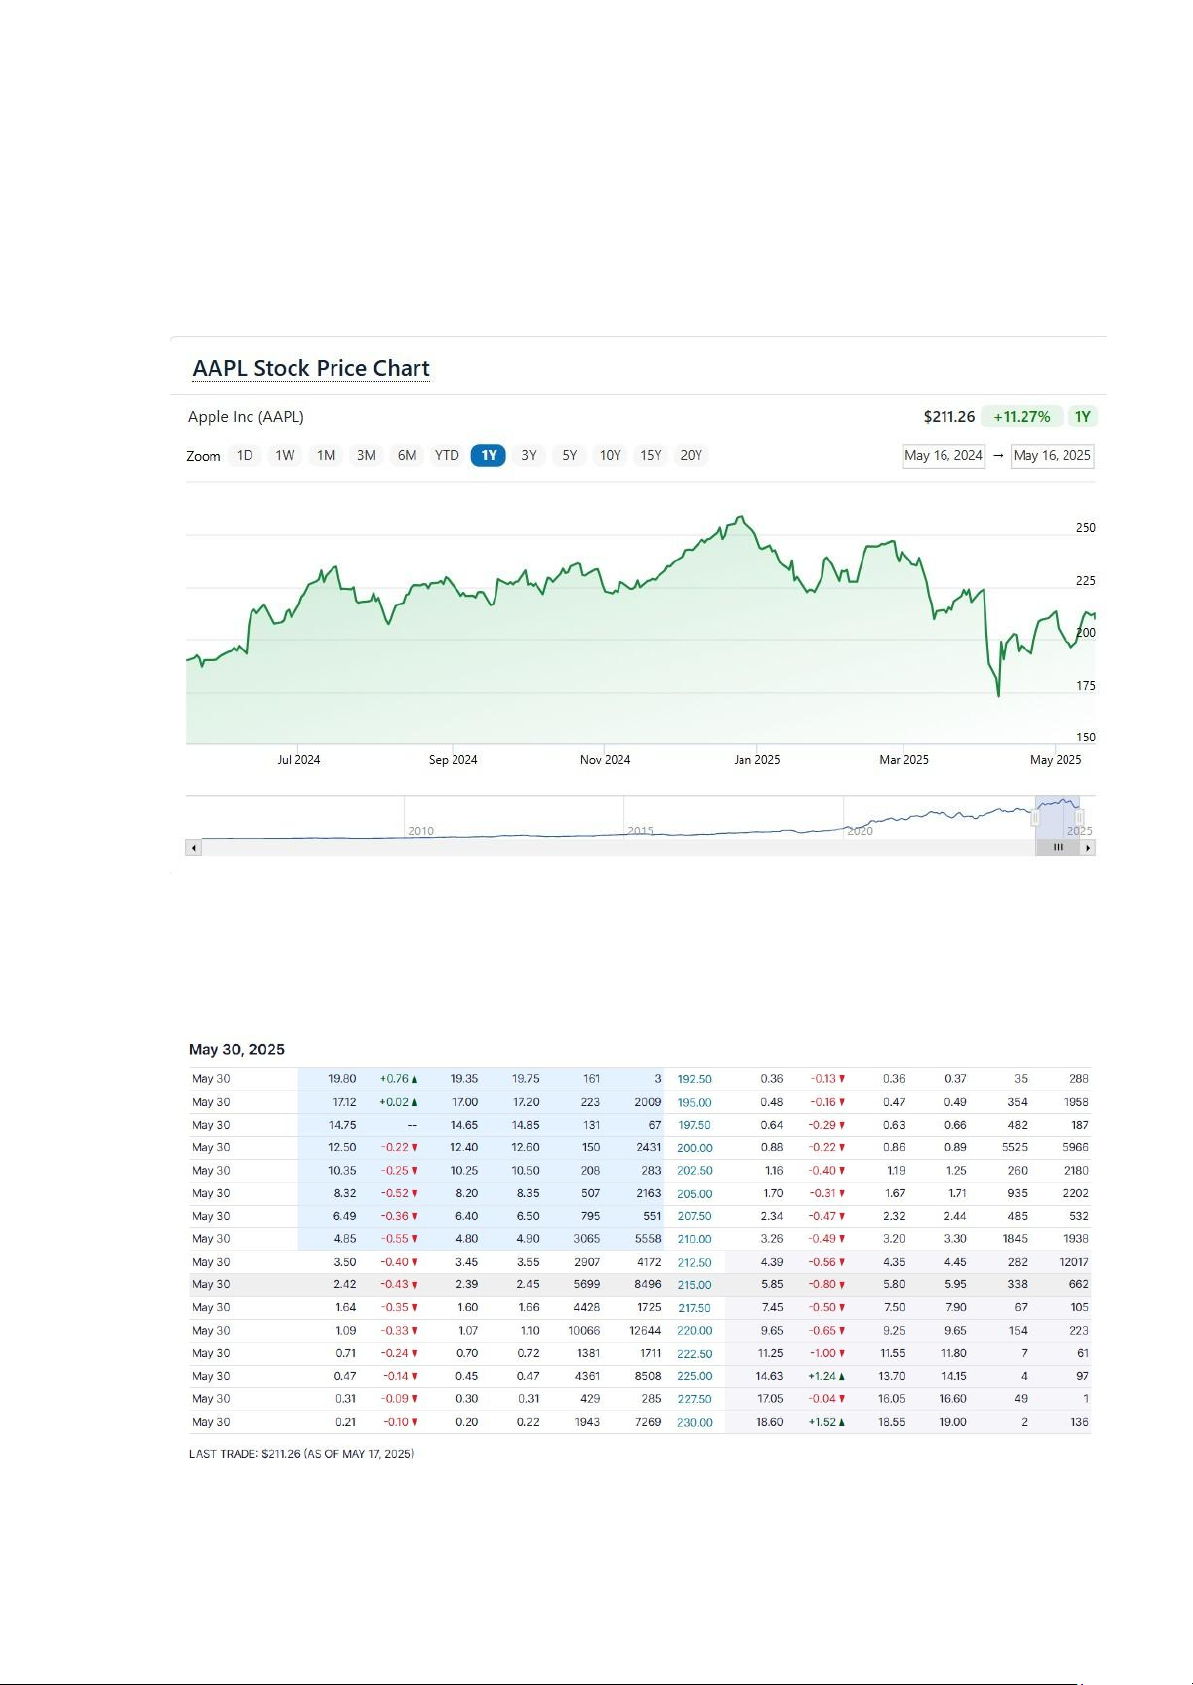
AAPL Stock Sprice Chart 2024 (Source: Finance Charts, 2024)
III. PORTFOLIO CONSTRUCTION: lOMoAR cPSD| 23136115
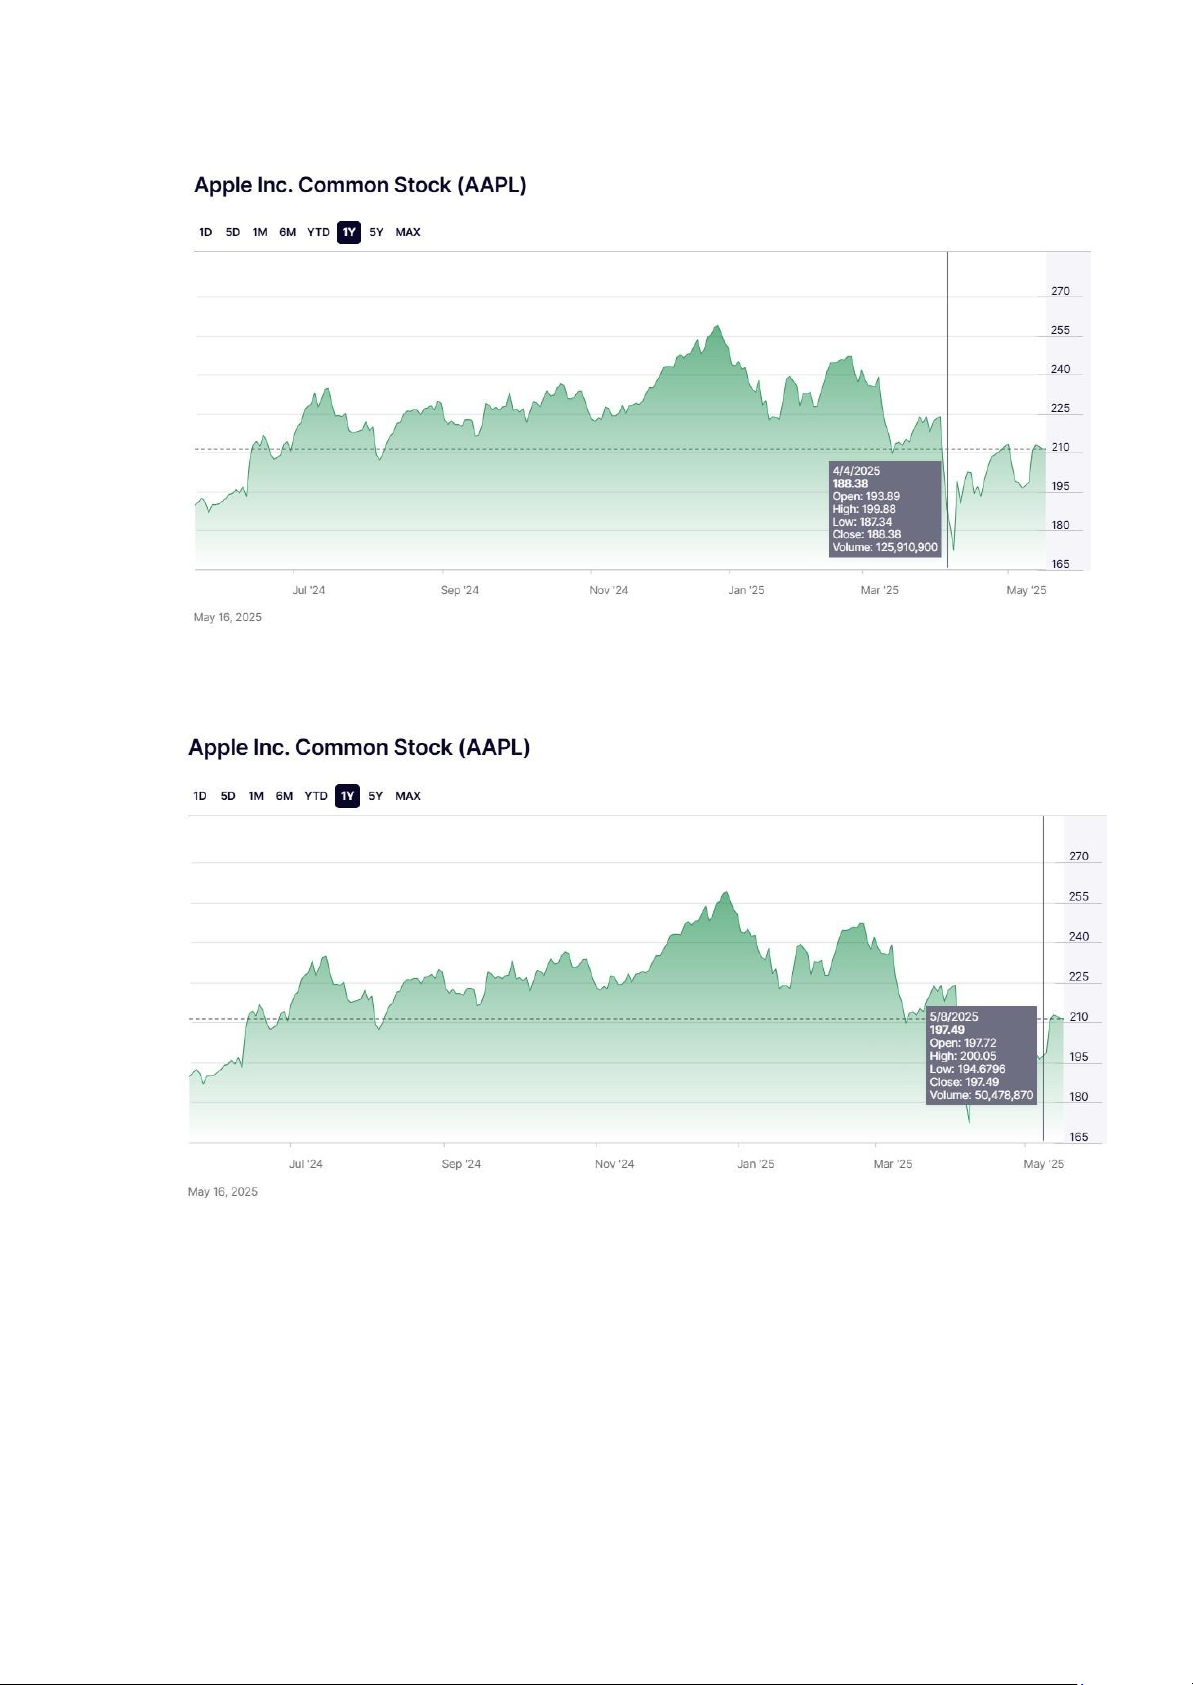
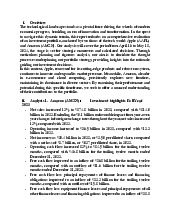
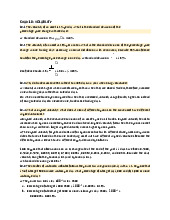
AAPL Option Chain Table Price on 04/04/2025 Price on 08/05/2025
On 4th of April, the AAPL’s close price was $188.38. With the expectation that AAPL’s stock
price would be increase by 8th of May, we decided to exercise by following the “Covered Call
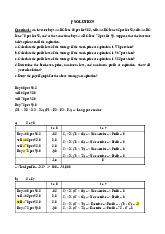
Strategy”. We purchased 100 shares at $188.38 and sold 1 AAPL $210 Call option expiring on 8th of May at the price of $0.04 lOMoAR cPSD| 23136115 Transaction 04/04 08/05 ST < X (197.49 < 210) Do not Excercise
Long 1 AAPL Stock at $188.38 -188.38 197.49
Short 1 AAPL Call $210 at +0.04 0 $0.04 Net Cashflow -188.34 197.49 -188.34 x 1 x 100 = -18,834 197.49 x 1 x 100 = 19,749 Total profit $19,749 – $18,834 = $915
On May 8th, AAPL’s closee price was at $197.49, which is lower than the strike price of
$210. Therefore, we did not exercise anything more. After calculating for the initial cost of the
shares and saving for the call option, this strategy generated a profit of $915
IV. PORTFOLIO EVALUATION: Stock Stock Stock Price
Profit/ Loss from Stock Profit/ Loss from Price on on 13/12 Option Strategies 18/11 AAPL $188.38 $197.49 ($197.49 - $188.38) x 19,749 - 18,834 = $915 100 = $911 TOTAL
Tài liệu liên quan:
-
Investment Portfolio Analysis: Amazon (AMZN) & Apple (AAPL) Insights | Môn Derivatives and Risk Management - Trường Đại học Quốc tế, Đại học Quốc gia Thành phố Hồ Chí Minh
123 62 -
Homework Review: Key Concepts in Volatility and Risk Management | Môn Derivatives and Risk Management - Trường Đại học Quốc tế, Đại học Quốc gia Thành phố Hồ Chí Minh
129 65 -
Final Exam Môn Derivatives and Risk Management | Trường Đại học Quốc tế, Đại học Quốc gia Thành phố Hồ Chí Minh
135 68 -
Tài liệu ôn tập chap 5 | Môn Derivatives and Risk Management - Trường Đại học Quốc tế, Đại học Quốc gia Thành phố Hồ Chí Minh
122 61