Investment Portfolio Analysis: Amazon (AMZN) & Apple (AAPL) Insights | Môn Derivatives and Risk Management - Trường Đại học Quốc tế, Đại học Quốc gia Thành phố Hồ Chí Minh
The technological landscape stands as a pivotal force driving the wheels of modern economic progress, heralding an era of innovation and transformation. Tài liệu được sưu tầm gồm 5 trang, giúp bạn ôn tập tốt hơn. Mời các bạn đón xem.
Môn: Derivatives and Risk Management 7 tài liệu
Trường: Trường Đại học Quốc tế, Đại học Quốc gia Thành phố Hồ Chí Minh 2 K tài liệu
Tác giả:


Preview text:
lOMoAR cPSD| 23136115 I. Overview
The technological landscape stands as a pivotal force driving the wheels of modern
economic progress, heralding an era of innovation and transformation. In the quest
to navigate this dynamic terrain, this report embarks on a comprehensive evaluation
of an investment portfolio, anchored by two titans of the tech world: Apple (AAPL)
and Amazon (AMZN). Our analysis will cover the period from April 16 to May 15,
2024, the stage is set for strategic maneuvers and calculated decisions. Through
meticulous planning and rigorous analysis, our aim is to elucidate the thought
processes underpinning our portfolio strategy, providing insights into the rationale
guiding our investment decisions.
In this context, Apple, renowned for its cutting-edge products and robust ecosystem,
continues to innovate and expand its market presence. Meanwhile, Amazon, a leader
in e-commerce and cloud computing, persistently explores new frontiers,
maintaining its dominance in diverse sectors. By examining their performance and
potential during this specific timeframe, we seek to offer a nuanced understanding
of their contributions to the portfolio. II.
Analysis 1. Amazon (AMZN)
Investment highlights Full Year 2023
- Net sales increased 12% to $574.8 billion in 2023, compared with $514.0
billion in 2022. Excluding the $0.1 billion unfavorable impact from year-over-
year changes in foreign exchange rates throughout the year, net sales increased 12% compared with 2022.
- Operating income increased to $36.9 billion in 2023, compared with $12.2 billion in 2022.
- Net income was $30.4 billion in 2023, or $2.90 per diluted share, compared
with a net loss of $2.7 billion, or $0.27 per diluted share, in 2022.
- Operating cash flow increased 82% to $84.9 billion for the trailing twelve
months, compared with $46.8 billion for the trailing twelve months ended December 31, 2022.
- Free cash flow improved to an inflow of $36.8 billion for the trailing twelve
months, compared with an outflow of $11.6 billion for the trailing twelve
months ended December 31, 2022.
- Free cash flow less principal repayments of finance leases and financing
obligations improved to an inflow of $32.2 billion for the trailing twelve
months, compared with an outflow of $19.8 billion.
- Free cash flow less equipment finance leases and principal repayments of all
other finance leases and financing obligations improved to an inflow of $35.5 lOMoAR cPSD| 23136115
billion for the trailing twelve months, compared with an outflow of $12.8 billion. In Mar. 2024
- Amazon.com's annualized Net Income for the quarter that ended was $41,724 Mil.
- Amazon.com's average Total Assets over the quarter that ended was $529,412 Mil.
- Therefore, Amazon.com's annualized ROA % for the quarter that ended was 7.88%.
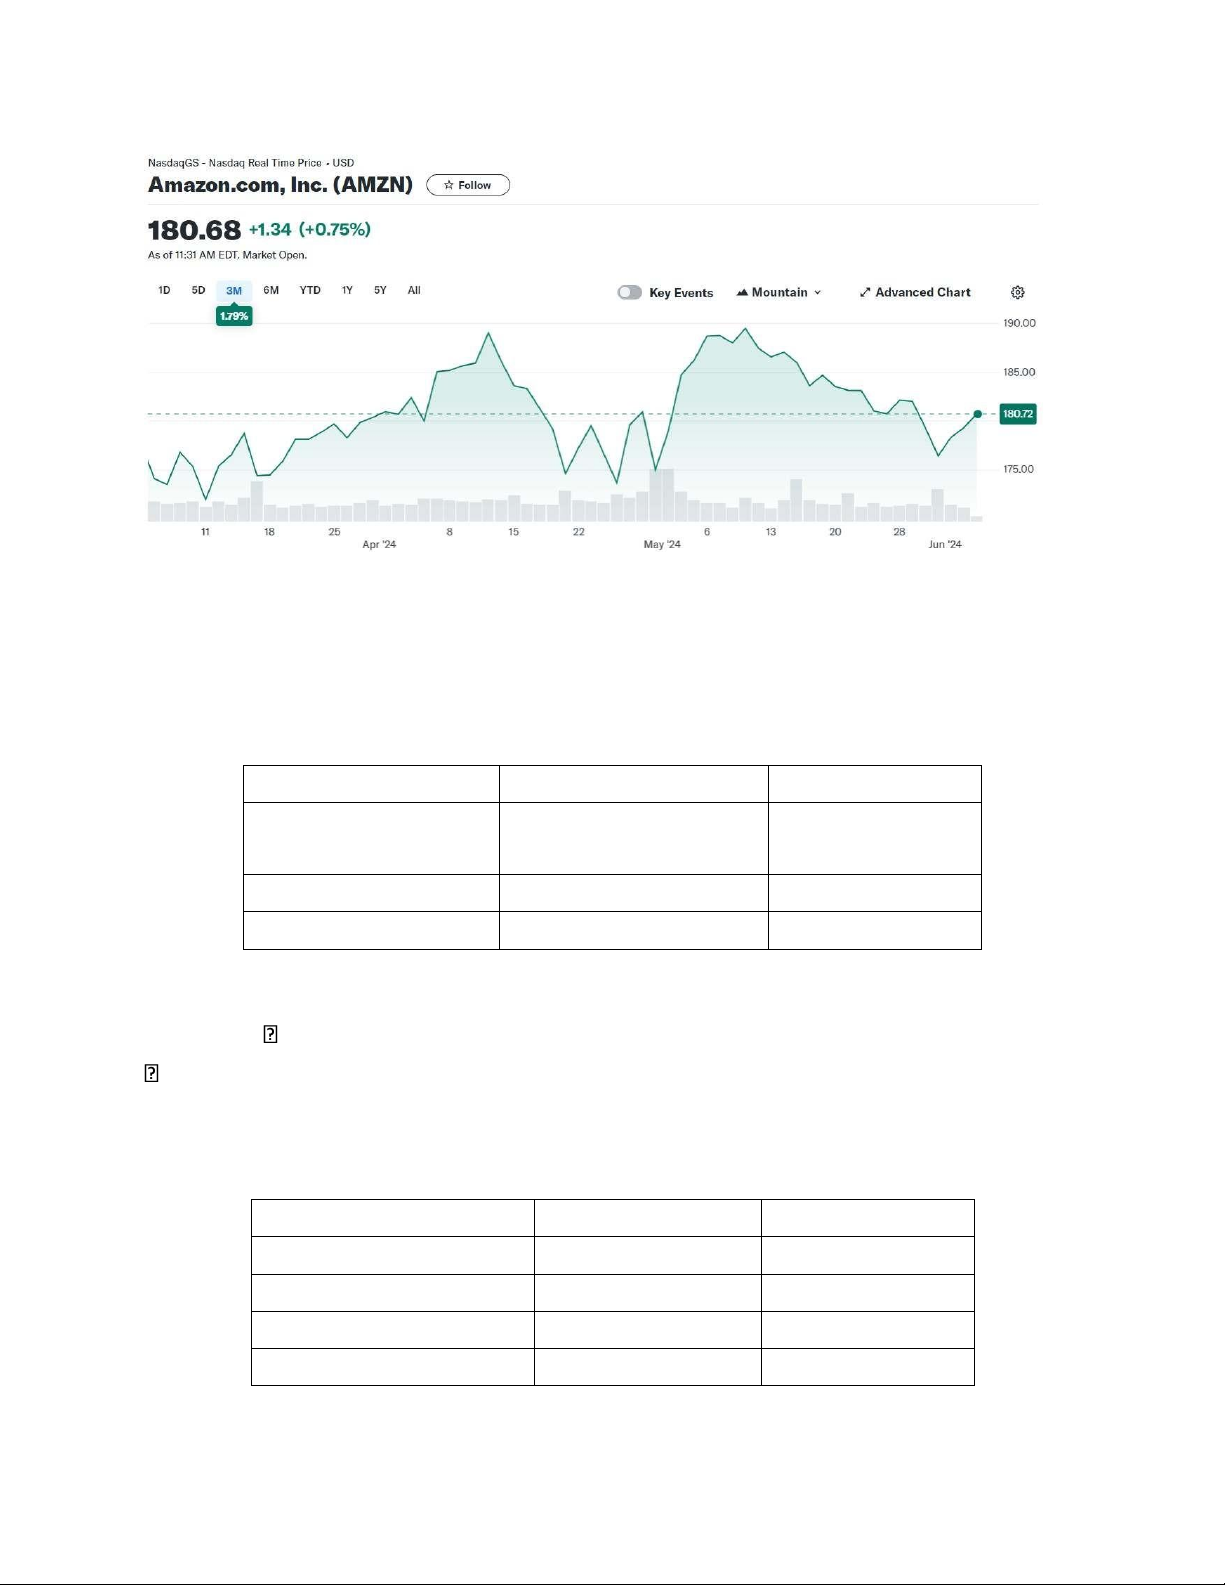
Analysis a. Performance of Amazon stock during the investing period
For Amazon stock, we chose the Protective Put strategy. We bought 100 shares of
AMZN at $185.32 on April 16th, 2024, with 100 Puts with a strike price of $225 and
an expiration date on May 15 at $40.50 per Put.
Amazon.com Inc (AMZN) saw options trading volume of 32,891,300 contracts on
April 16th, which is equivalent to 84.17% of the stock's average daily trading volume
of 39,073,798. This significant options activity suggests that investors are closely
watching and actively trading Amazon's stock.
The analysts at Argus Research and Barclays Capital have issued 12-month price targets for
Amazon (AMZN) stock over the past 3 months. The average target price they have
set is $220.93, with a high estimate of $246 and a low of $200. This indicates that lOMoAR cPSD| 23136115
the analysts are overall bullish on Amazon's stock and believe it is undervalued at its current price.
The fact that the average target price of $220.93 is significantly above Amazon's
current stock price, and the high estimate of $246 is even higher, suggests that the
analysts are confident in the company's future performance. They view Amazon's
shares as having the potential to appreciate by over 15% from the current stock price,
based on their analysis and projections.
Given this positive technical analysis and the analysts' price target projections, the
overall analyst recommendation on Amazon would be a "strong buy". The analysts
are strongly encouraging investors to purchase the stock based on their favorable
outlook and price target estimates.
The performance of Amazon (AMZN) stock has largely aligned with our initial
expectations. The AMZN stock price has experienced significant fluctuations,
ranging between $171.47 and $191.70. From the day we entered the market with a
long position on April 16th, the AMZN stock price has decreased from $183.32 to
$180.80 but remains on an overall upward trend. This suggests that our decision to
implement the Protective Put strategy may have been a prudent one, as it helps to
mitigate the downside risk while still allowing us to potentially benefit from the stock's upside potential.
In general, the combination of positive analyst perspective, attractive price target
estimates, and the ongoing fluctuations in the AMZN stock price indicate that our
investment in Amazon using the Protective Put strategy may prove to be a sound
decision, offering a balance of risk and potential reward. lOMoAR cPSD| 23136115
Source: Investing.com, Nasquad
b. Evaluation of Protective Put Strategy + At time 0:
We bought 100 AMZN share at $185.32/share and 100 put at $40.50/put (K=225, T= May 15th )
Netdebit=100×(185.32+40.50)=$22,582 Protective Put Quoted price Total price Buy 100 AMZN $185.32 $18,532 share Buy 100 AMZN Put $40.50 $4,050 Net Debit $225.82 $22,582 *Excluding
commission + At time T:
ST=185.99 Exercise Put because ST<K
Put payoff=100×(225−185.99)=$3,901
AMZNshare=100×185.99=$18,599
So, our total value at time T = $22,500
Ournet loss=22,582 –22,500=$ 82 Value Per share Total AMZN price at time T $185.99 $18,599 Payoff of Put $40.50 $4,050 Total gain at time T $225 $22,500 Net debit at time 0 -$225.82 -$22,582 lOMoAR cPSD| 23136115 Net loss at time T -$0.82 -$82 Reference:
https://www.gurufocus.com/term/roa/AMZN
https://ir.aboutamazon.com/news-release/news-release-details/2024/Amazon.com-
AnnouncesFourth-Quarter-Results/default.aspx
https://www.statmuse.com/money/ask/amazon-stock-price-in-june-2024
https://www.barrons.com/market-data/stocks/amzn/research-ratings?
fbclid=IwZXh0bgNhZW0CMTAAAR1Y2QKD1gTaihvMbURoF4D9IznlDya9-
AB6alV1IZCjRdP_RF7UvY7_INc_aem_AVqym8kt8xHSwn9XBOCl9lIZc5ceXz2 uAJWvDTjH
Y6uEYjicmd6Y_5eCdngKC_SQWVe9rMJHaxEPJvF5Iao28qwF
Tài liệu liên quan:
-
AAPL Industry Overview: Tech Advancements & Consumer Behavior Insights | Môn Derivatives and Risk Management - Trường Đại học Quốc tế, Đại học Quốc gia Thành phố Hồ Chí Minh
101 51 -
Homework Review: Key Concepts in Volatility and Risk Management | Môn Derivatives and Risk Management - Trường Đại học Quốc tế, Đại học Quốc gia Thành phố Hồ Chí Minh
129 65 -
Final Exam Môn Derivatives and Risk Management | Trường Đại học Quốc tế, Đại học Quốc gia Thành phố Hồ Chí Minh
135 68 -
Tài liệu ôn tập chap 5 | Môn Derivatives and Risk Management - Trường Đại học Quốc tế, Đại học Quốc gia Thành phố Hồ Chí Minh
122 61