Analyzing Market Supply and Demand Forces | Microeconomics | Trường Đại học Quốc tế, Đại học Quốc gia Thành phố Hồ Chí Minh
What factors affect buyers’ demand for goods? • What factors affect sellers’ supply of goods? • How do supply and demand determine the price of a good and the quantity sold? • How do changes in the factors that affect demand or supply affect the market price and quantity of a good? • How do markets allocate resources? Tài liệu được sưu tầm và soạn thảo dưới dạng file PDF để gửi tới các bạn cùng tham khảo, ôn tập đầy đủ kiến thức, chuẩn bị cho các buổi học thật tốt. Mời bạn đọc đón xem!
Môn: Microeconomics 613 tài liệu
Trường: Trường Đại học Quốc tế, Đại học Quốc gia Thành phố Hồ Chí Minh 1.9 K tài liệu
Tác giả:


Preview text:
N.GREGORYMANKIW PRINCIPLES OF ECONOMICS Eight Edition CHAPTER The Market Forces of Supply and Demand
© 2018 Cengage Learning®. May not be scanned, copied or duplicated, or posted to a publicly accessible website, in whole or in part, except for use
as permitted in a license distributed with a certain product or service or otherwise on a password-protected website or school-approved learning 1
management system for classroom use.
Look for the answers to these questions
• What factors affect buyers’ demand for goods?
• What factors affect sellers’ supply of goods?
• How do supply and demand determine the
price of a good and the quantity sold?
• How do changes in the factors that affect
demand or supply affect the market price and quantity of a good?
• How do markets allocate resources?
© 2018 Cengage Learning®. May not be scanned, copied or duplicated, or posted to a publicly accessible website, in whole or in part, except for use
as permitted in a license distributed with a certain product or service or otherwise on a password-protected website or school-approved learning 2
management system for classroom use. Markets and Competition • Market
– A group of buyers and sellers of a particular good or service – Buyers as a group
• Determine the demand for the product – Sellers as a group
• Determine the supply of the product
© 2018 Cengage Learning®. May not be scanned, copied or duplicated, or posted to a publicly accessible website, in whole or in part, except for use 3
as permitted in a license distributed with a certain product or service or otherwise on a password-protected website or school-approved learning
management system for classroom use. Markets and Competition • Competitive market
– Many buyers and many sellers, each has
a negligible impact on market price
• Perfectly competitive market
– All goods are exactly the same
– Buyers and sellers are so numerous that
no one can affect the market price, “Price takers”
© 2018 Cengage Learning®. May not be scanned, copied or duplicated, or posted to a publicly accessible website, in whole or in part, except for use 4
as permitted in a license distributed with a certain product or service or otherwise on a password-protected website or school-approved learning
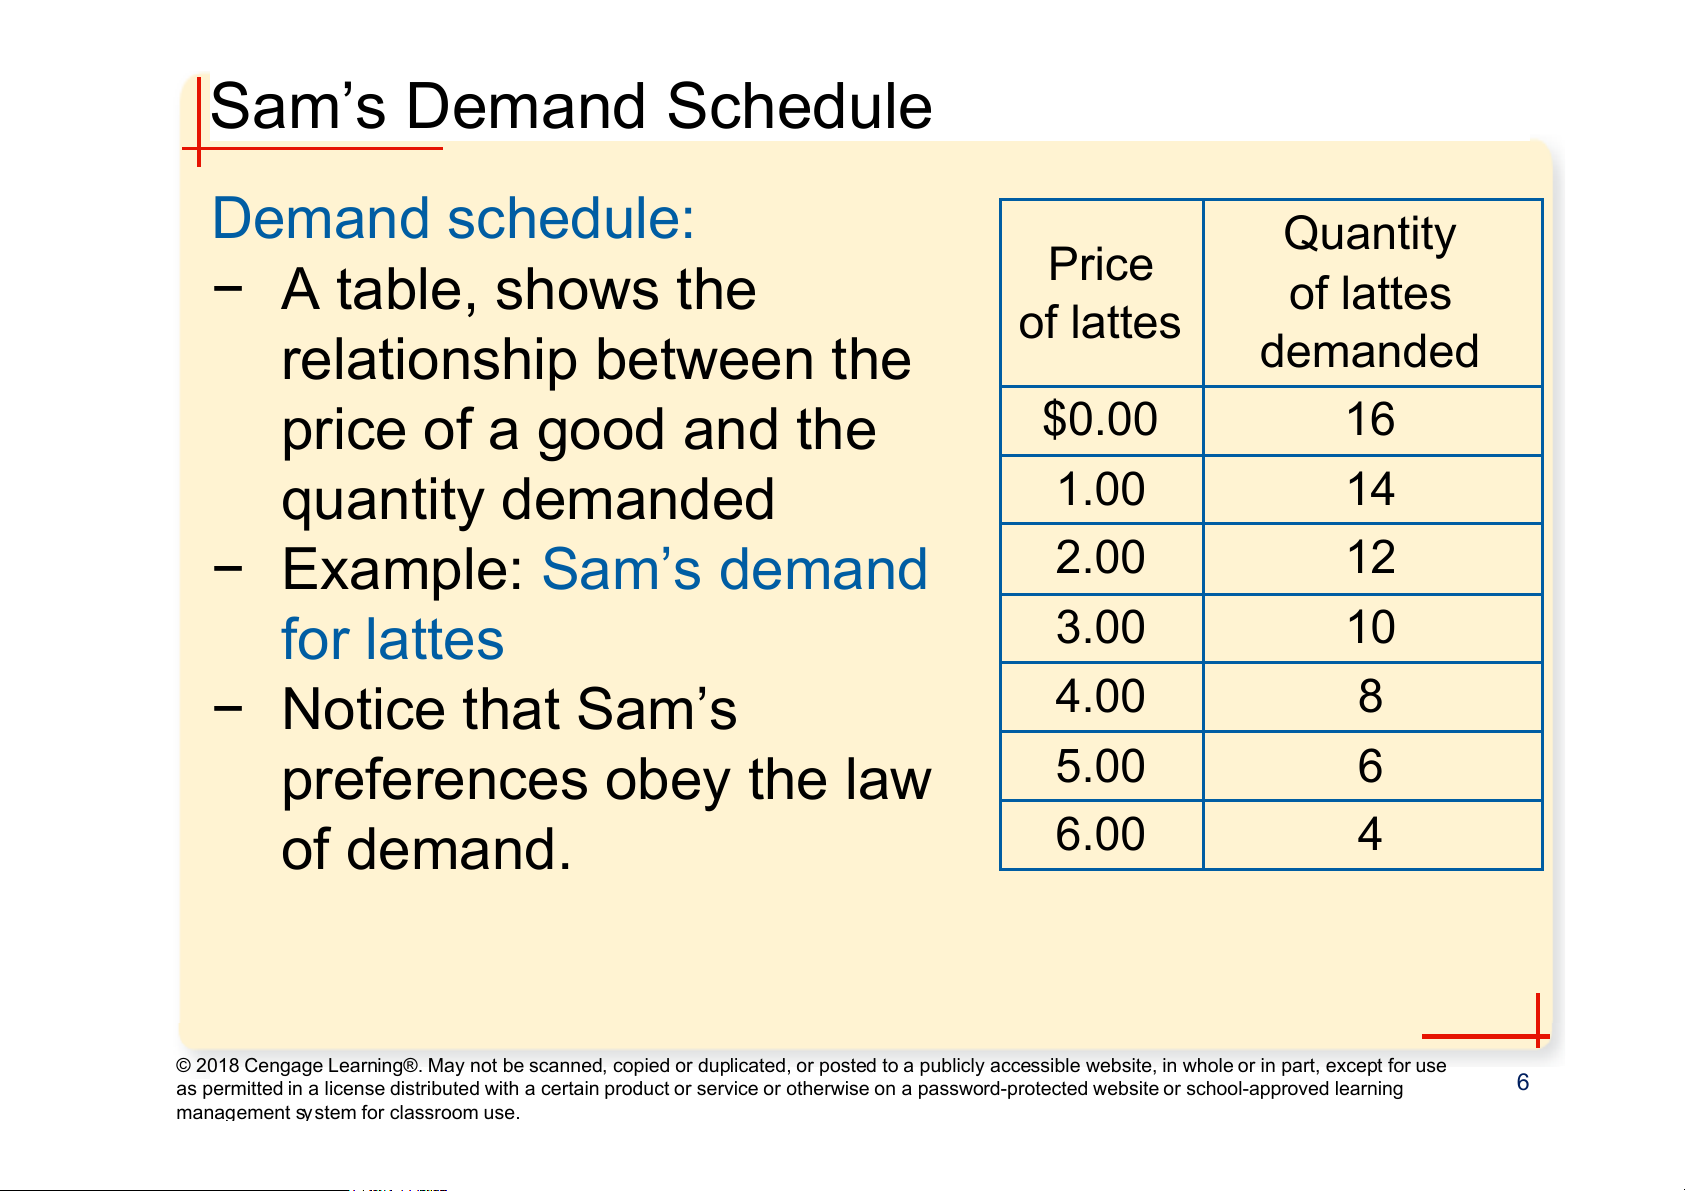
management system for classroom use. Demand • Quantity demanded
– Amount of a good that buyers are willing and able to purchase • Law of demand – Other things equal
– When the price of a good rises, the
quantity demanded of the good falls
– When the price falls, the quantity demanded rises
© 2018 Cengage Learning®. May not be scanned, copied or duplicated, or posted to a publicly accessible website, in whole or in part, except for use 5
as permitted in a license distributed with a certain product or service or otherwise on a password-protected website or school-approved learning
management system for classroom use. Sam’s Demand Schedule Demand schedule: Quantity − A table, shows the Price of lattes of lattes relationship between the demanded price of a good and the $0.00 16 quantity demanded 1.00 14 − Example: Sam’s demand 2.00 12 for lattes 3.00 10 − Notice that Sam’s 4.00 8 preferences obey the law 5.00 6 of demand. 6.00 4
© 2018 Cengage Learning®. May not be scanned, copied or duplicated, or posted to a publicly accessible website, in whole or in part, except for use 6
as permitted in a license distributed with a certain product or service or otherwise on a password-protected website or school-approved learning
management system for classroom use.
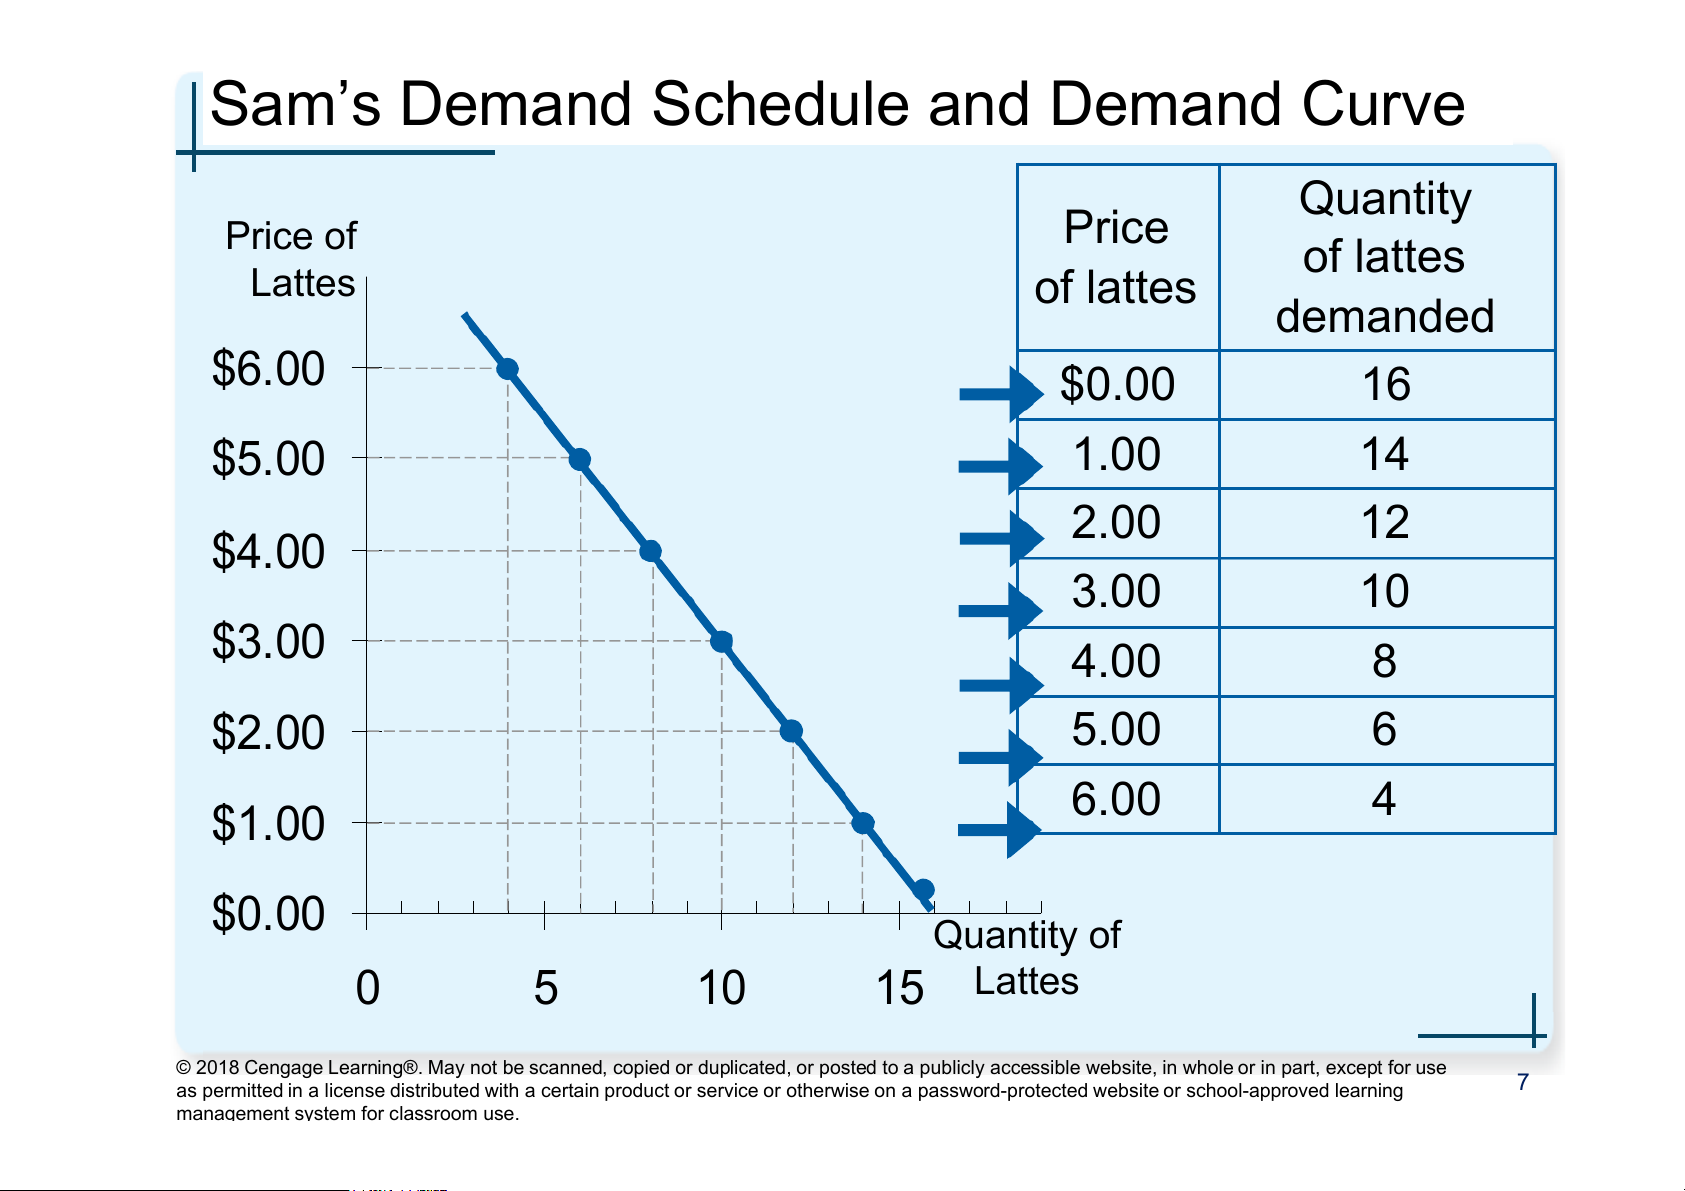
Sam’s Demand Schedule and Demand Curve Quantity Price of Price of lattes Lattes of lattes demanded $6.00 $0.00 16 $5.00 1.00 14 2.00 12 $4.00 3.00 10 $3.00 4.00 8 $2.00 5.00 6 6.00 4 $1.00 $0.00 Quantity of 0 5 10 15 Lattes
© 2018 Cengage Learning®. May not be scanned, copied or duplicated, or posted to a publicly accessible website, in whole or in part, except for use 7
as permitted in a license distributed with a certain product or service or otherwise on a password-protected website or school-approved learning
management system for classroom use. Demand • Market demand
– Sum of all individual demands for a good or service
– Market demand curve: sum the individual demand curves horizontally
• To find the total quantity demanded at any
price, we add the individual quantities
© 2018 Cengage Learning®. May not be scanned, copied or duplicated, or posted to a publicly accessible website, in whole or in part, except for use 8
as permitted in a license distributed with a certain product or service or otherwise on a password-protected website or school-approved learning
management system for classroom use.
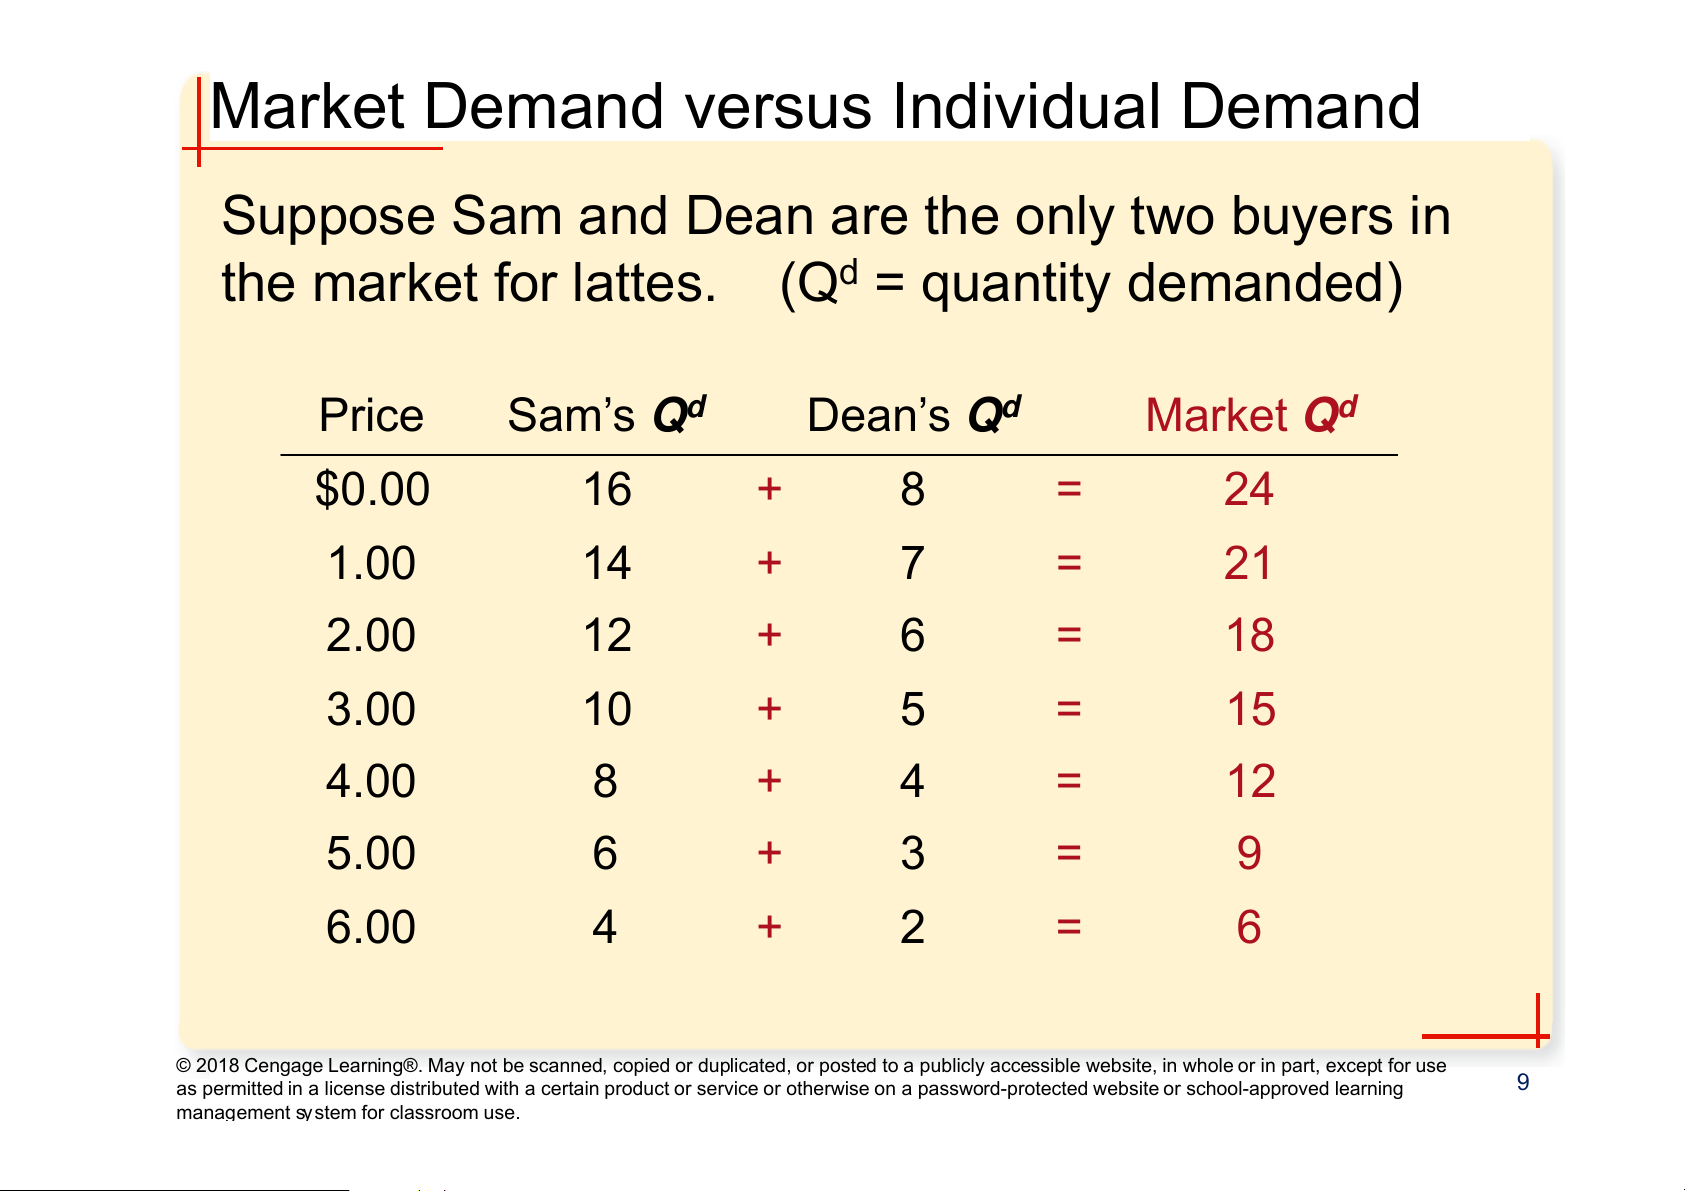
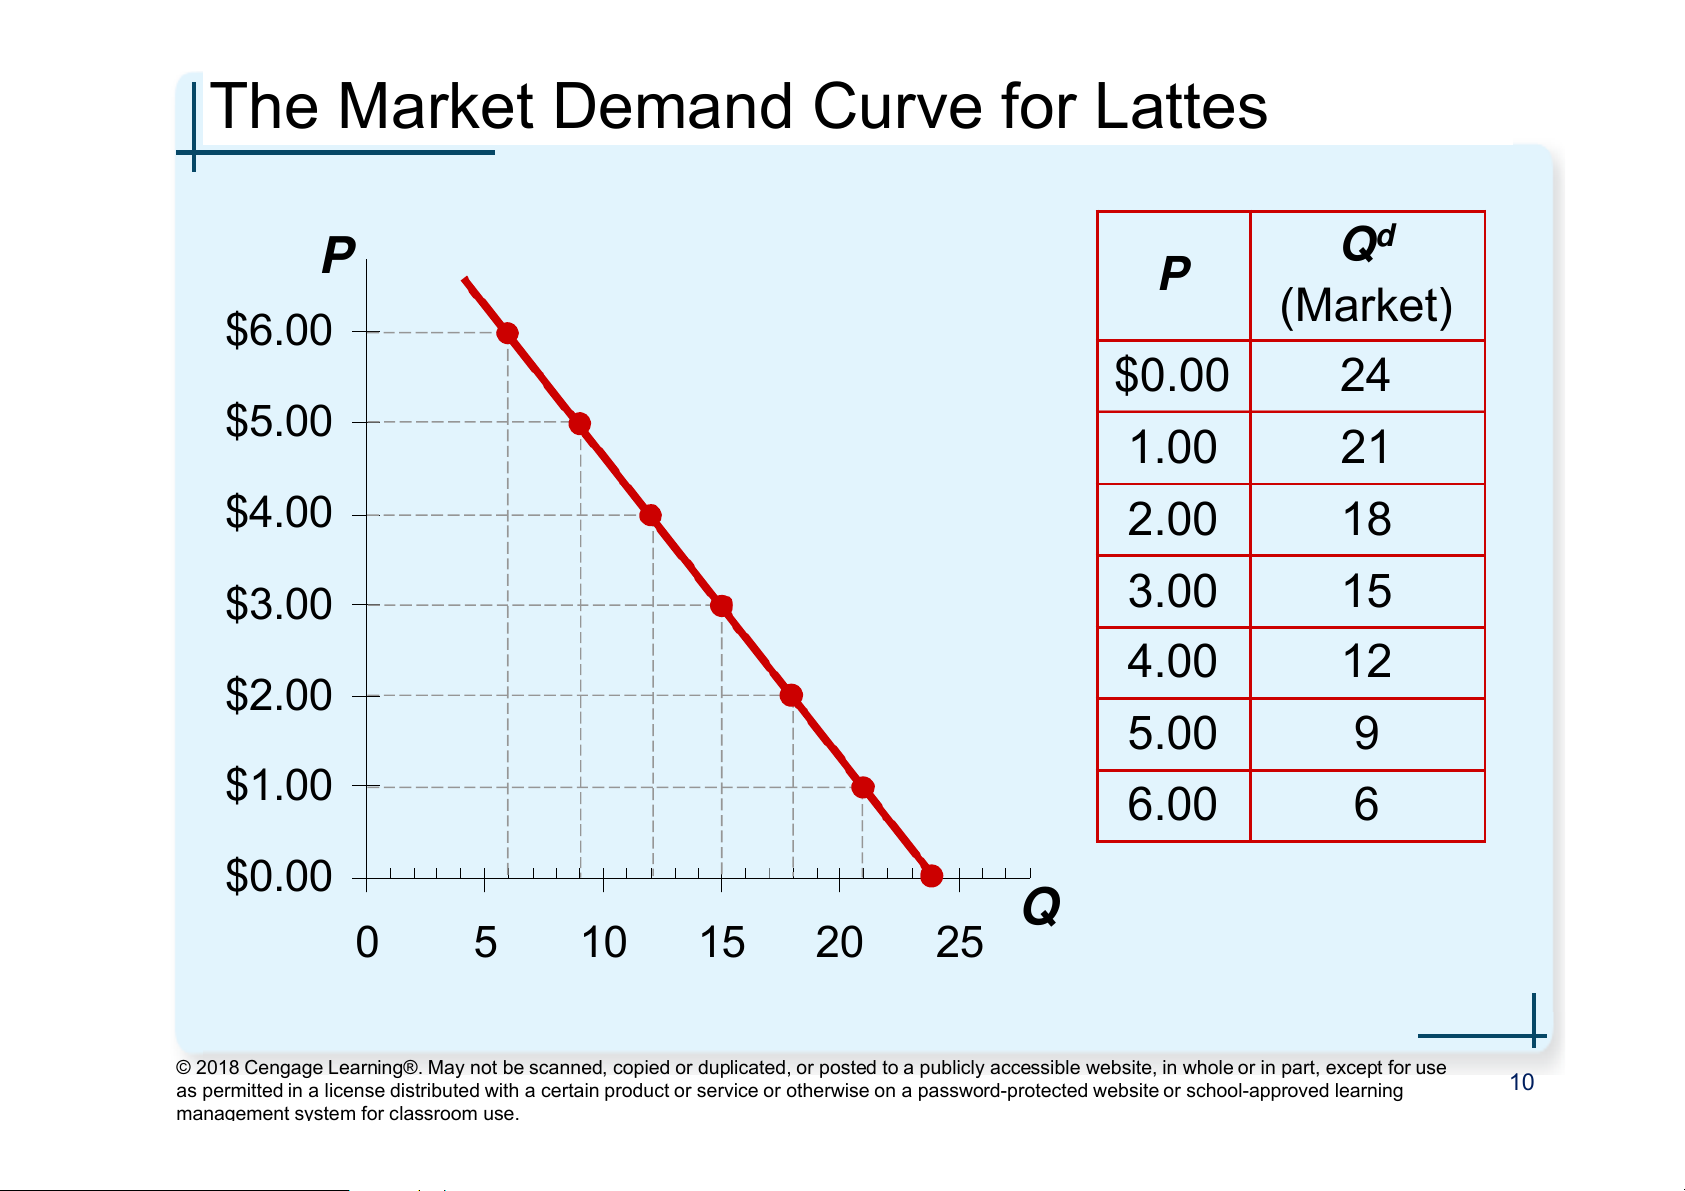
Market Demand versus Individual Demand
Suppose Sam and Dean are the only two buyers in
the market for lattes. (Qd = quantity demanded) Price Sam’s Qd Dean’s Qd Market Qd $0.00 16 + 8 = 24 1.00 14 + 7 = 21 2.00 12 + 6 = 18 3.00 10 + 5 = 15 4.00 8 + 4 = 12 5.00 6 + 3 = 9 6.00 4 + 2 = 6
© 2018 Cengage Learning®. May not be scanned, copied or duplicated, or posted to a publicly accessible website, in whole or in part, except for use 9
as permitted in a license distributed with a certain product or service or otherwise on a password-protected website or school-approved learning
management system for classroom use.
The Market Demand Curve for Lattes P P Qd (Market) $6.00 $0.00 24 $5.00 1.00 21 $4.00 2.00 18 $3.00 3.00 15 4.00 12 $2.00 5.00 9 $1.00 6.00 6 $0.00 Q 0 5 10 15 20 25
© 2018 Cengage Learning®. May not be scanned, copied or duplicated, or posted to a publicly accessible website, in whole or in part, except for use 10
as permitted in a license distributed with a certain product or service or otherwise on a password-protected website or school-approved learning
management system for classroom use. Demand Curve Shifters • The demand curve
– Shows how price affects quantity
demanded, other things being equal
• These “other things” are non-price determinants of demand
– Things that determine buyers’ demand for
a good, other than the good’s price
• Changes in them shift the D curve…
© 2018 Cengage Learning®. May not be scanned, copied or duplicated, or posted to a publicly accessible website, in whole or in part, except for use 11
as permitted in a license distributed with a certain product or service or otherwise on a password-protected website or school-approved learning
management system for classroom use. Demand Curve Shifters • Number of buyers – Increase in # of buyers
• Increases quantity demanded at each price
• Shifts D curve to the right – Decrease in # of buyers
• Decreases quantity demanded at each price • Shifts D curve to the left
© 2018 Cengage Learning®. May not be scanned, copied or duplicated, or posted to a publicly accessible website, in whole or in part, except for use 12
as permitted in a license distributed with a certain product or service or otherwise on a password-protected website or school-approved learning
management system for classroom use.
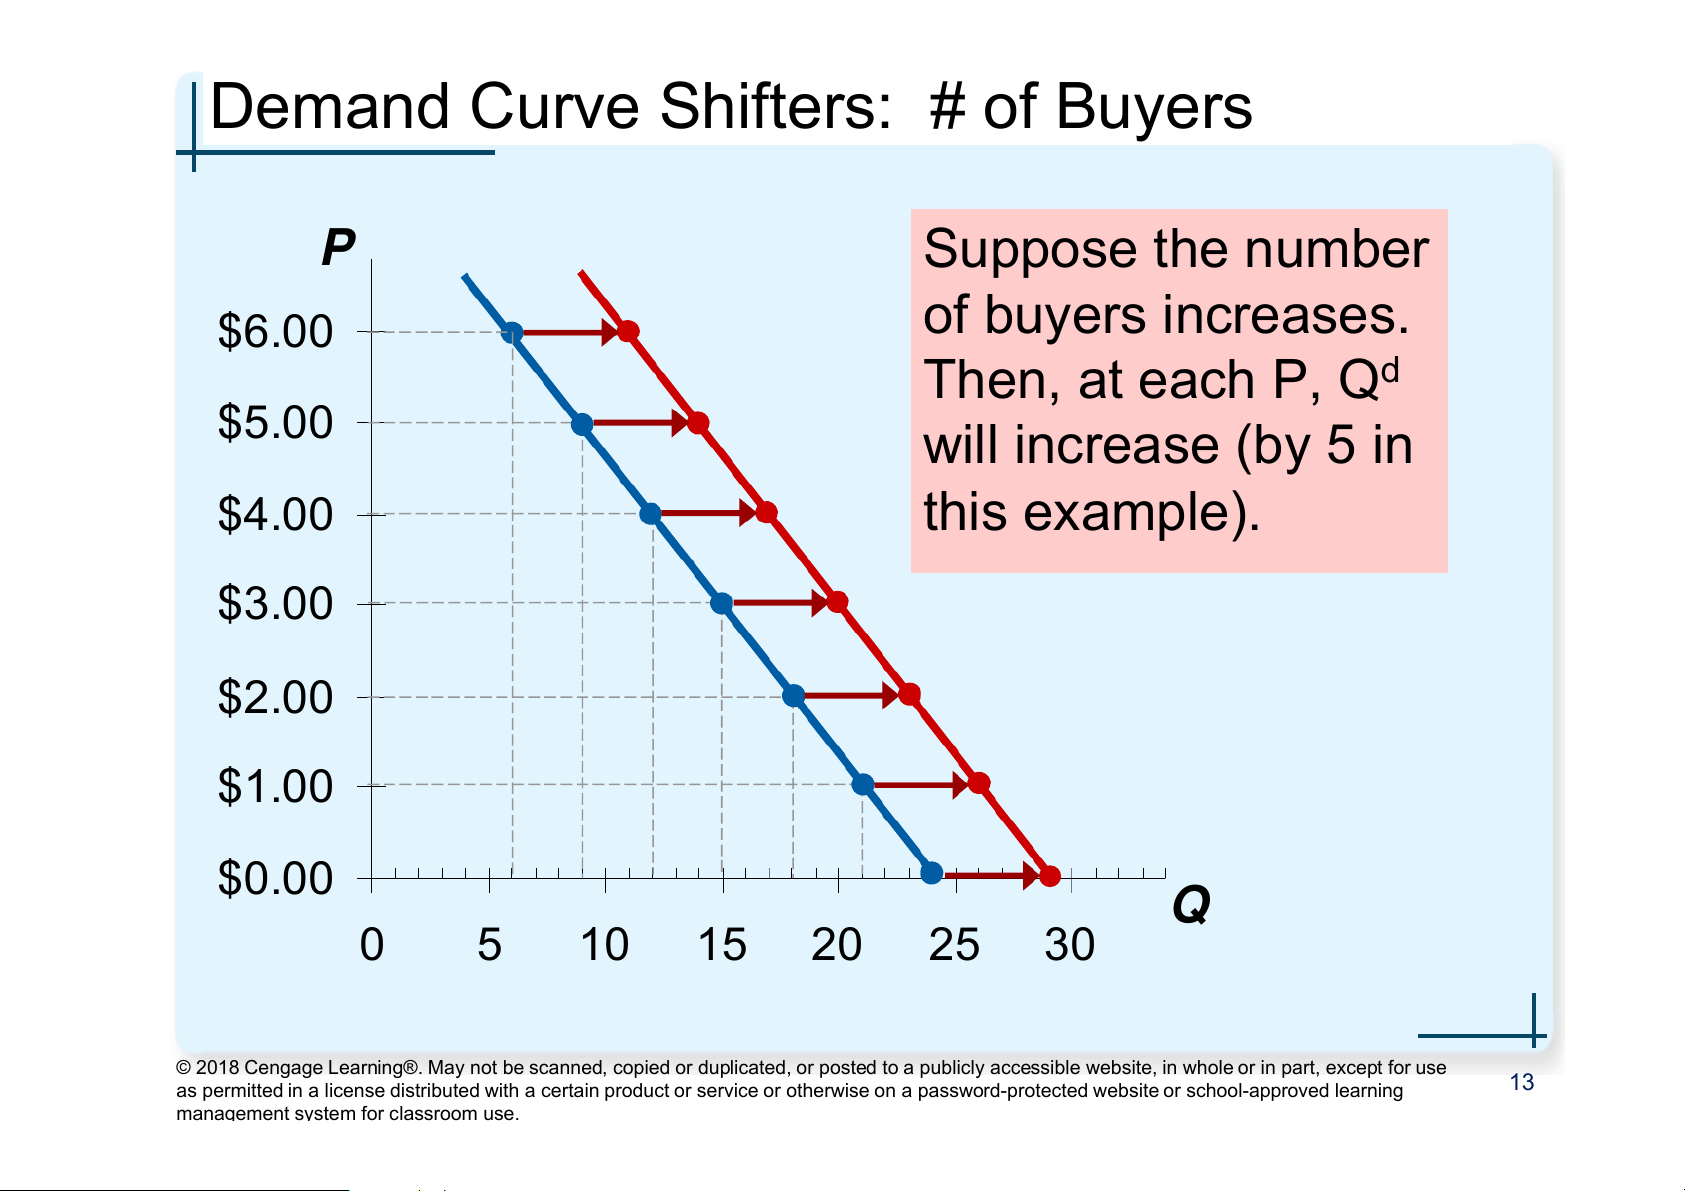
Demand Curve Shifters: # of Buyers P Suppose the number of buyers increases. $6.00 Then, at each P, Qd $5.00 will increase (by 5 in $4.00 this example). $3.00 $2.00 $1.00 $0.00 Q 0 5 10 15 20 25 30
© 2018 Cengage Learning®. May not be scanned, copied or duplicated, or posted to a publicly accessible website, in whole or in part, except for use 13
as permitted in a license distributed with a certain product or service or otherwise on a password-protected website or school-approved learning
management system for classroom use. Demand Curve Shifters • Income
– Normal good, other things constant
• An increase in income leads to an increase in
demand: Shifts D curve to the right
– Inferior good, other things constant
• An increase in income leads to a decrease in
demand: Shifts D curve to the left
© 2018 Cengage Learning®. May not be scanned, copied or duplicated, or posted to a publicly accessible website, in whole or in part, except for use 14
as permitted in a license distributed with a certain product or service or otherwise on a password-protected website or school-approved learning
management system for classroom use. Demand Curve Shifters
• Prices of related goods, substitutes
– Two goods are substitutes if
• An increase in the price of one leads to an
increase in the demand for the other
– Example: pizza and hamburgers
• An increase in the price of pizza increases
demand for hamburgers, shifting hamburger demand curve to the right – Other examples:
• Coke and Pepsi, laptops and tablets, music CDs and music downloads
© 2018 Cengage Learning®. May not be scanned, copied or duplicated, or posted to a publicly accessible website, in whole or in part, except for use 15
as permitted in a license distributed with a certain product or service or otherwise on a password-protected website or school-approved learning
management system for classroom use. Demand Curve Shifters
• Prices of related goods, complements
– Two goods are complements if
• An increase in the price of one leads to a
decrease in the demand for the other
– Example: computers and software
• If price of computers rises, people buy fewer
computers, and therefore less software; Software demand curve shifts left – Other examples:
• College tuition and textbooks, bagels and cream cheese, eggs and bacon
© 2018 Cengage Learning®. May not be scanned, copied or duplicated, or posted to a publicly accessible website, in whole or in part, except for use 16
as permitted in a license distributed with a certain product or service or otherwise on a password-protected website or school-approved learning
management system for classroom use. Demand Curve Shifters • Tastes
– Anything that causes a shift in tastes
toward a good will increase demand for
that good and shift its D curve to the right – Example:
• The Atkins diet became popular in the ’90s,
caused an increase in demand for eggs,
shifted the egg demand curve to the right
© 2018 Cengage Learning®. May not be scanned, copied or duplicated, or posted to a publicly accessible website, in whole or in part, except for use 17
as permitted in a license distributed with a certain product or service or otherwise on a password-protected website or school-approved learning
management system for classroom use. Demand Curve Shifters
• Expectations about the future
– Expect an increase in income, increase in current demand
– Expect higher prices, increase in current demand – Example:
• If people expect their incomes to rise, their D
for meals at expensive restaurants may increase now
© 2018 Cengage Learning®. May not be scanned, copied or duplicated, or posted to a publicly accessible website, in whole or in part, except for use 18
as permitted in a license distributed with a certain product or service or otherwise on a password-protected website or school-approved learning
management system for classroom use.
Summary: Variables That Influence Buyers
© 2018 Cengage Learning®. May not be scanned, copied or duplicated, or posted to a publicly accessible website, in whole or in part, except for use 19
as permitted in a license distributed with a certain product or service or otherwise on a password-protected website or school-approved learning
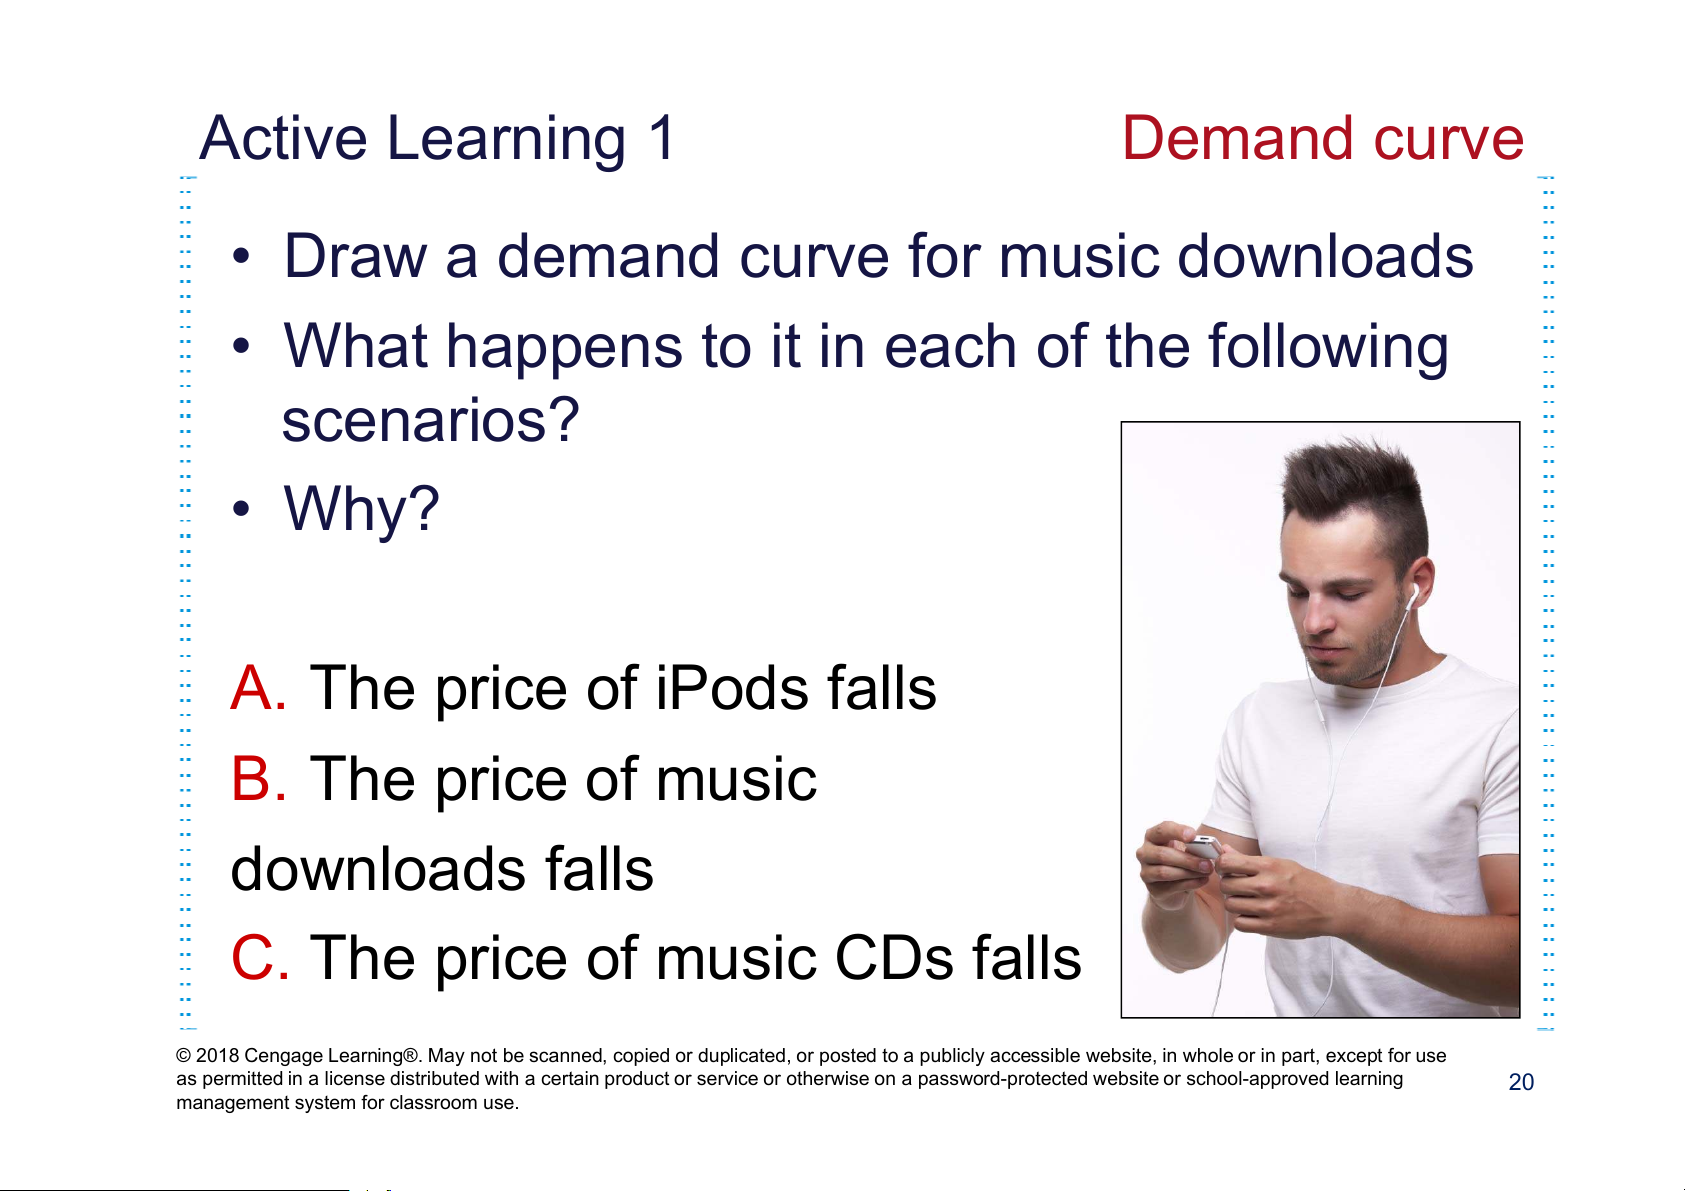
management system for classroom use. Active Learning 1 Demand curve
• Draw a demand curve for music downloads
• What happens to it in each of the following scenarios? • Why? A. The price of iPods falls B. The price of music downloads falls
C. The price of music CDs falls
© 2018 Cengage Learning®. May not be scanned, copied or duplicated, or posted to a publicly accessible website, in whole or in part, except for use
as permitted in a license distributed with a certain product or service or otherwise on a password-protected website or school-approved learning 20
management system for classroom use.
Tài liệu liên quan:
-
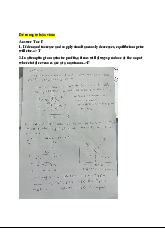
Tự Luận Vimo: Phân Tích Cung, Cầu và Thị Trường Cạnh Tranh| Microeconomics | Trường Đại học Quốc tế, Đại học Quốc gia Thành phố Hồ Chí Minh
5 3 -
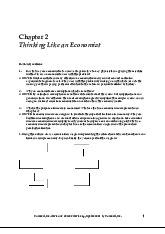
Review Questions: Thinking Like an Economist | Microeconomics | Trường Đại học Quốc tế, Đại học Quốc gia Thành phố Hồ Chí Minh
5 3 -
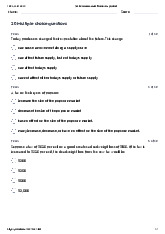
Final Exam Quizlet Questions & Answers | Microeconomics | Trường Đại học Quốc tế, Đại học Quốc gia Thành phố Hồ Chí Minh
5 3 -
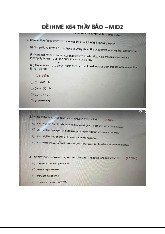
Đề thi giữa kỳ II | Microeconomics | Trường Đại học Quốc tế, Đại học Quốc gia Thành phố Hồ Chí Minh
5 3 -
Final Group Project_ The Beer Industry | Microeconomics | Trường Đại học Quốc tế, Đại học Quốc gia Thành phố Hồ Chí Minh
4 2