Assessing Climate Change Risks for Foreign Direct Investment (FDI) môn Marketing căn bản | Trường đại học Mở Hà Nội
This study deploys newly available data to examine the exposure ofmultinational companies’ overseas investments to physical climate risks. Globally, foreign investments are significantly exposed to lower physical climate risks, compared with local firms across countries. Within countries however, the differences of physical climate risks between foreign and local facilities are small. .Tài liệu giúp bạn tham khảo ôn tập và đạt kết quả cao. Mời bạn đọc đón xem!
Môn: Marketing căn bản (MCB1) 145 tài liệu
Trường: Viện Đại học Mở Hà Nội 1.7 K tài liệu
Tác giả:


Preview text:
lOMoAR cPSD| 47708777 ARTICLE OPEN
Assessing the climate change exposure of foreign direct investment ✉ ✉ Xia Li 1 & Kevin P. Gallagher 2
This study deploys newly available data to examine the exposure of multinational companies’
overseas investments to physical climate risks. Globally, foreign investments are significantly
exposed to lower physical climate risks, compared with local firms across countries. Within
countries however, the differences of physical climate risks between foreign and local facilities
are small. We also examine China, as it is fast becoming one of the largest sources of outward
foreign investment across the globe. We find that foreign direct investment from China is
significantly more exposed to water stress, floods, hurricanes and typhoon risks across countries,
compared with other foreign facilities. Within host countries however, once again the physical
climate risks of Chinese overseas facilities are comparable to those of nonChinese foreign investments.
hysical climate risks, defined as risks arising from the general17–20, little attention has been paid to physical climate risks
physical effects of climate change, increasingly affect and FDI.
Pfac ilities worldwide across industries1–6, including foreign This paper represents an initial foray into this neglected
assets, or foreign direct investment (FDI)7. For instance, research area and examines the physical climate risks of FDI. In
increased rainfall and flooding interrupted business at Toyota’s this study, we find that FDI is exposed to lower physical climate
manufacturing facilities in Southeast Asia8. Water shortage shut risks, compared with local firms across countries. Within host
down a Coca-Cola plant in India9. Risks from rising sea levels countries however, the differences of physical climate risks
affects some of Chinese infrastructure investments in Pakistan10. between overseas and local facilities are small. We also find that
Despite the increasing impact of physical climate risks on firms Chinese FDI is exposed to higher climate risk than non-Chinese
and facilities globally, little is known about how multinational FDI. Chinese FDI is exposed to higher water stress, floods, and
companies incorporate such risks into their overseas investment hurricanes and typhoon risks across host countries, compared
decisions. Previous literature related to FDI and the environment with non-Chinese overseas facilities. Within host countries,
focused on the theory of externalities, such as the extent to which however, the physical climate risks of Chinese overseas facilities
firms might locate to countries that have less stringent regulation are comparable to those of non-Chinese FDI.
that requires firms to internalize environmental externalities11,12;
how foreign companies may spread cleaner environmental
technologies or practices in host countries;13 or whether foreign Results
firms have better environmental performances than indigenous Incorporating physical climate risks into overseas investment
firms14. With respect to climate change, studies have primarily decisions. Foreign firms tend to shy away from countries with the
focused on the relationship between FDI and carbon higher levels of physical climate risks than do local firms (firms
emissions15,16. While the emerging literature on physical climate that are not multinational or multinationals operating in their
risk pays attention to the financial impact of climate change on headquarter country), which by their nature have less choice
firm performance, cost of capital, and asset value or price in
1 Questrom School of Business, Global Development Policy Center, Boston University, Boston, MA 02215, USA. 2 Pardee School of Global Studies, Global ✉
Development Policy Center, Boston University, Boston, MA 02215, USA. email: xiali7@bu.edu; kpg@bu.edu NA T U R E CO M M U N I C AT I O N S | ( 2 02 2 ) 1 3: 14 5 1 | ht t p s : / / d o i . or g /1 0 . 1 0 3 8 /s 4 1 4 6 7- 0 2 2 - 2 89 7 5 - 5 | ww w . n a t ur e . c o m /n at u r e c om m u n i c a t io n s 1
Content courtesy of Springer Nature, terms of use apply. Rights reserved lOMoAR cPSD| 47708777
ARTICLE NATURE COMMUNICATIONS | https://doi.org/10.1038/s41467-022-28975-5
regarding where they can locate their facilities. When firms to aggregate climate risks across countries and industries,
locate in particular countries, they take on similar levels of risk as compared to overseas facilities owned or operated by companies
do local firms. Chinese FDI on the other hand, is significantly more headquartered in other countries with high FDI outflow stock.
exposed to most physical climate risks than non-Chinese FDI Further, we estimate a set of fixed-effects cross-sectional models
across countries, but also is not significantly more exposed to based on our firm-host country-industry level climate risk data
such risks within the countries they choose to locate.
set. We find that overseas facilities owned or operated by
We begin by examining the physical climate risks of Chinese companies have higher water stress, flood, and
multinational companies’ overseas facilities across the globe. hurricane/typhoon risks across countries, compared to non-
Firms considering locations in areas that are susceptible to Chinese overseas facilities. Within host countries, however, the
physical climate risks will have to bear the costs of climate-
climate risks of Chinese overseas facilities are comparable to
related events if they occur. Firms’ decisions to locate facilities those of other FDI facilities. We also explore several potential
abroad involves considerations of the characteristics of the host mechanisms explaining why Chinese overseas facilities have
country (e.g., market attractiveness and inputs factors)21,22 and higher climate risks across host countries.
the firms’ own capabilities23–25. Compared with local firms,
Note that physical climate risks are different from carbon risks
foreign firms investing abroad are at disadvantage in a local or transition climate risks - that is, risks arising from transition to
market because they lack information about local conditions, a low carbon economy that affect a firms’ business34,35. A facility’s
face discrimination by host country stakeholders, and have physical climate risks are mainly determined by the facility’s
difficulty in responding to some local conditions26. To overcome location and the nature of its activities. A facility’s carbon risks
the burden of foreignness and enhance their long-term are mainly determined by its energy use, technology choice, and
competitiveness, foreign firms may be more cautious about risks a country’s carbon policy. In this paper we focus on physical
in host countries, including climate risks. It is therefore possible climate risks and the term “climate risks” refers to physical
that facilities owned by foreign firms have, on average, lower climate risks unless otherwise specified. Also, we use the term
physical climate risks than those owned by local firms.
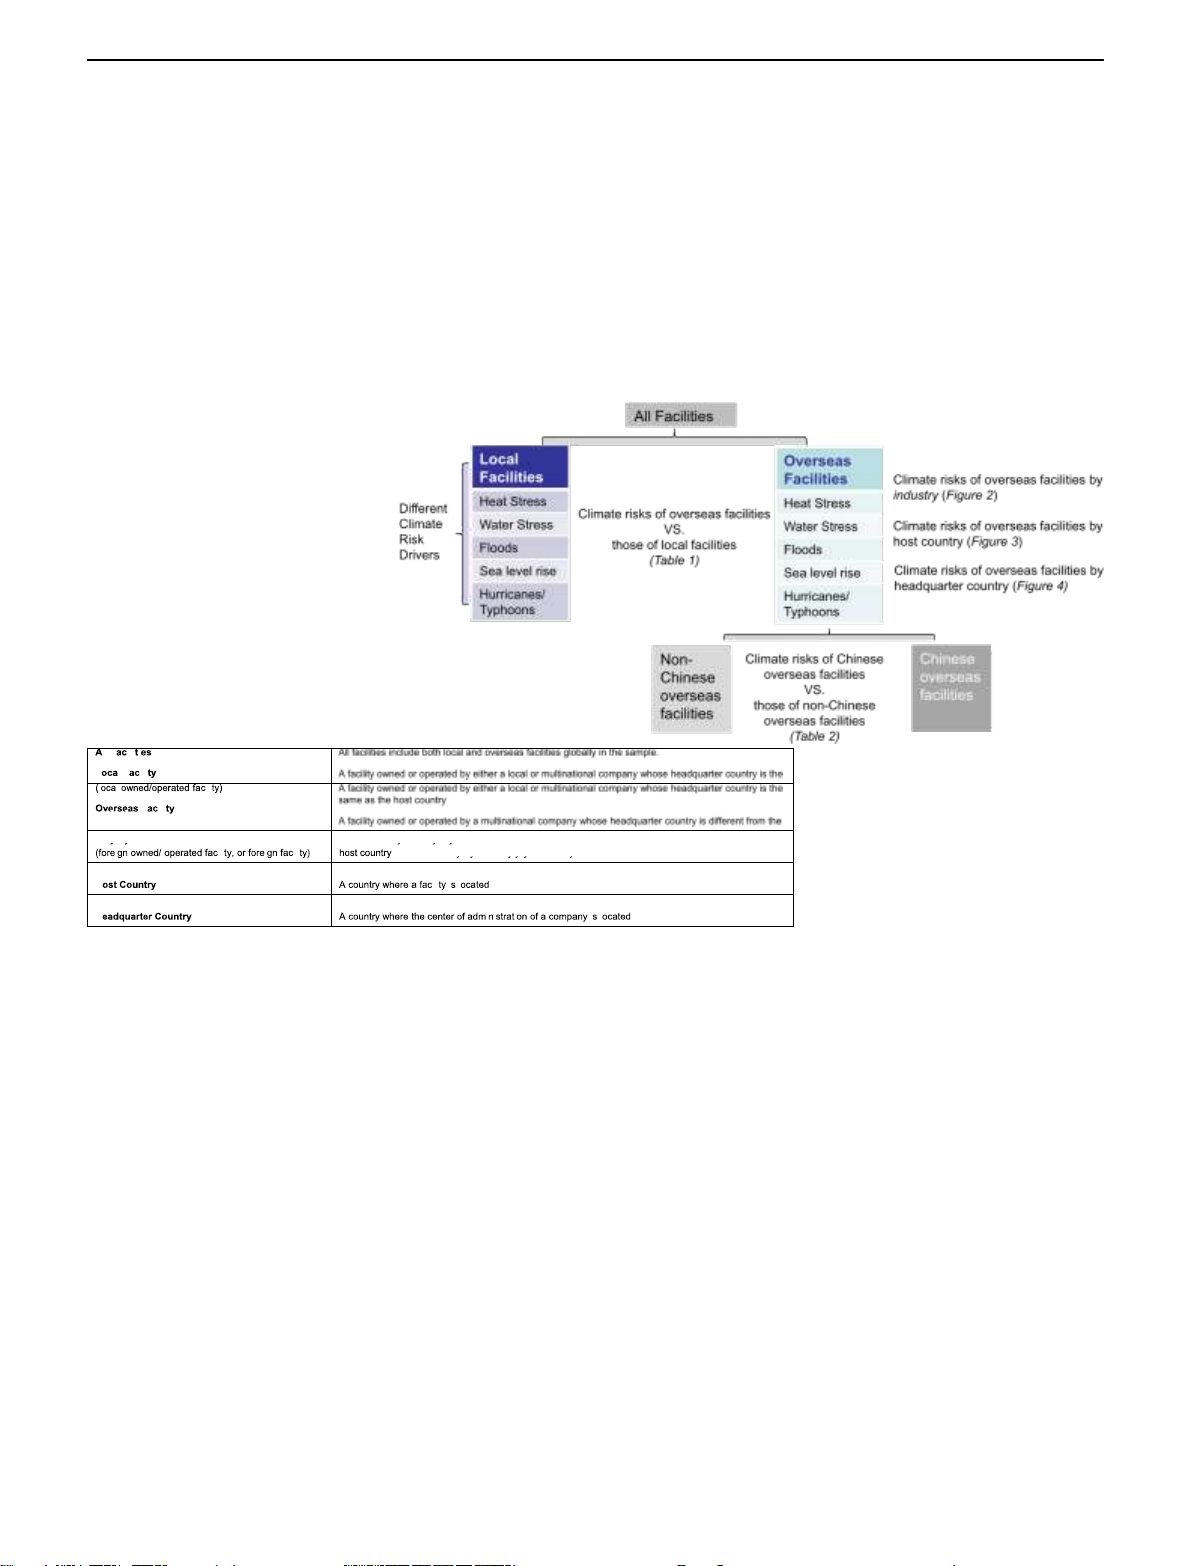
“country” and “jurisdiction” interchangeably. Figure 1 presents
We compare whether facilities owned or operated by foreign the structure of the paper and explains key terminologies.
companies are different from local firms by estimating a set of
fixed-effects cross-sectional models based on our firm-host
country-industry level climate risk dataset. We find that across
host countries, facilities owned by foreign companies have
significantly lower climate risks, particularly for floods, seas level
rise, and hurricanes/typhoons risks. Within host countries,
however, the differences are small and vary among different
climate risk drivers. Also, we find that the climate risks of firm’s
overseas facilities vary by industry, with agriculture and mining
industries having the highest aggregate climate risks. In addition,
overseas facilities in the Caribbean, the Middle East, and
Southeast Asia have the highest climate risks.
We then focus on the physical climate risks of Chinese overseas
facilities and examine whether they are different from those of
the non-Chinese overseas facilities. China is now among the
largest outward foreign investors globally27,28. Also, some Chinese
overseas investments have political and strategic considerations
(e.g., those under the Belt and Road Initiative umbrella) and are
not solely profit-seeking29,30. They may be more likely to locate in
countries with higher risks (including climate risks) if these
investments fit with the government’s strategy. Further, because
Chinese firms have expanded their overseas footprints only
recently, they may have had to invest in locations with higher
physical climate risks because the less-risky ones have already been taken31–33.
Descriptive statistics suggest that overseas facilities owned or
operated by mainland China and Hong Kong firms have higher 2 NA T U R E CO M MU N I C A T I ON S | ( 20 22 )1 3: 1 4 5 1 | ht t p s : / / d oi . o r g /1 0 . 1 0 3 8 /s 4 1 4 67 - 0 2 2 - 28 9 7 5 - 5 | ww w . n a t ur e . c o m/ n a tu r e c o m mu n i c a t i o n s
Content courtesy of Springer Nature, terms of use apply. Rights reserved lOMoAR cPSD| 47708777
NATURE COMMUNICATIONS | https://doi.org/10.1038/s41467-022-28975-5 ARTICLE
Global landscape of climate risks of public companies’ overseas facilities and those of local facilities. Although the differences for
facilities. We compare climate risks of facilities owned or some climate risk drivers, such as heat stress, water stress, and
operated by foreign multinational companies with all facilities in floods risk, are statistically significant, they are economically
the sample. The Methods section details the model specifications small (e.g., foreign ownership is associated with less than a 2
(Eqs. (1a) and (1b)) and explains the selection of control variables. percent standard deviation difference in heat stress). Also, there
We estimate Eq. (1a) (Model 1) to examine whether climate risks is variation amongst climate risk drivers: foreign facilities have
of foreign facilities are different from those of all facilities within higher water stress risk and lower heat stress and floods risk,
industry and across host countries, and estimate Eq. (1b) (Model compared with those of local facilities within host countries. This
2) to examine whether climate risks of overseas facilities are makes sense, as the climate risks of facilities, whether owned by
different from those of all facilities within industry and within local or foreign companies, are determined by their locations and
Fig. 1 Paper structure and terminology. Presents the structure of the study and explains key terminologies used in the paper.
host country. Outcome variables are physical climate risk scores the nature of their economic activities and are greatly influenced
for different climate risk drivers including heat stress, water by the host country’s climate. Foreign companies may be less
stress, floods, sea level rise, and hurricanes/typhoons. The likely to invest in countries with higher climate risks, but if they
explanatory variable Foreign is a dummy which equals to 1 if do, the climate risks they face are likely to be similar to the risks
facilities are owned or operated by foreign companies. of local companies.
As suggested in Table 1, foreign-owned/operated have lower
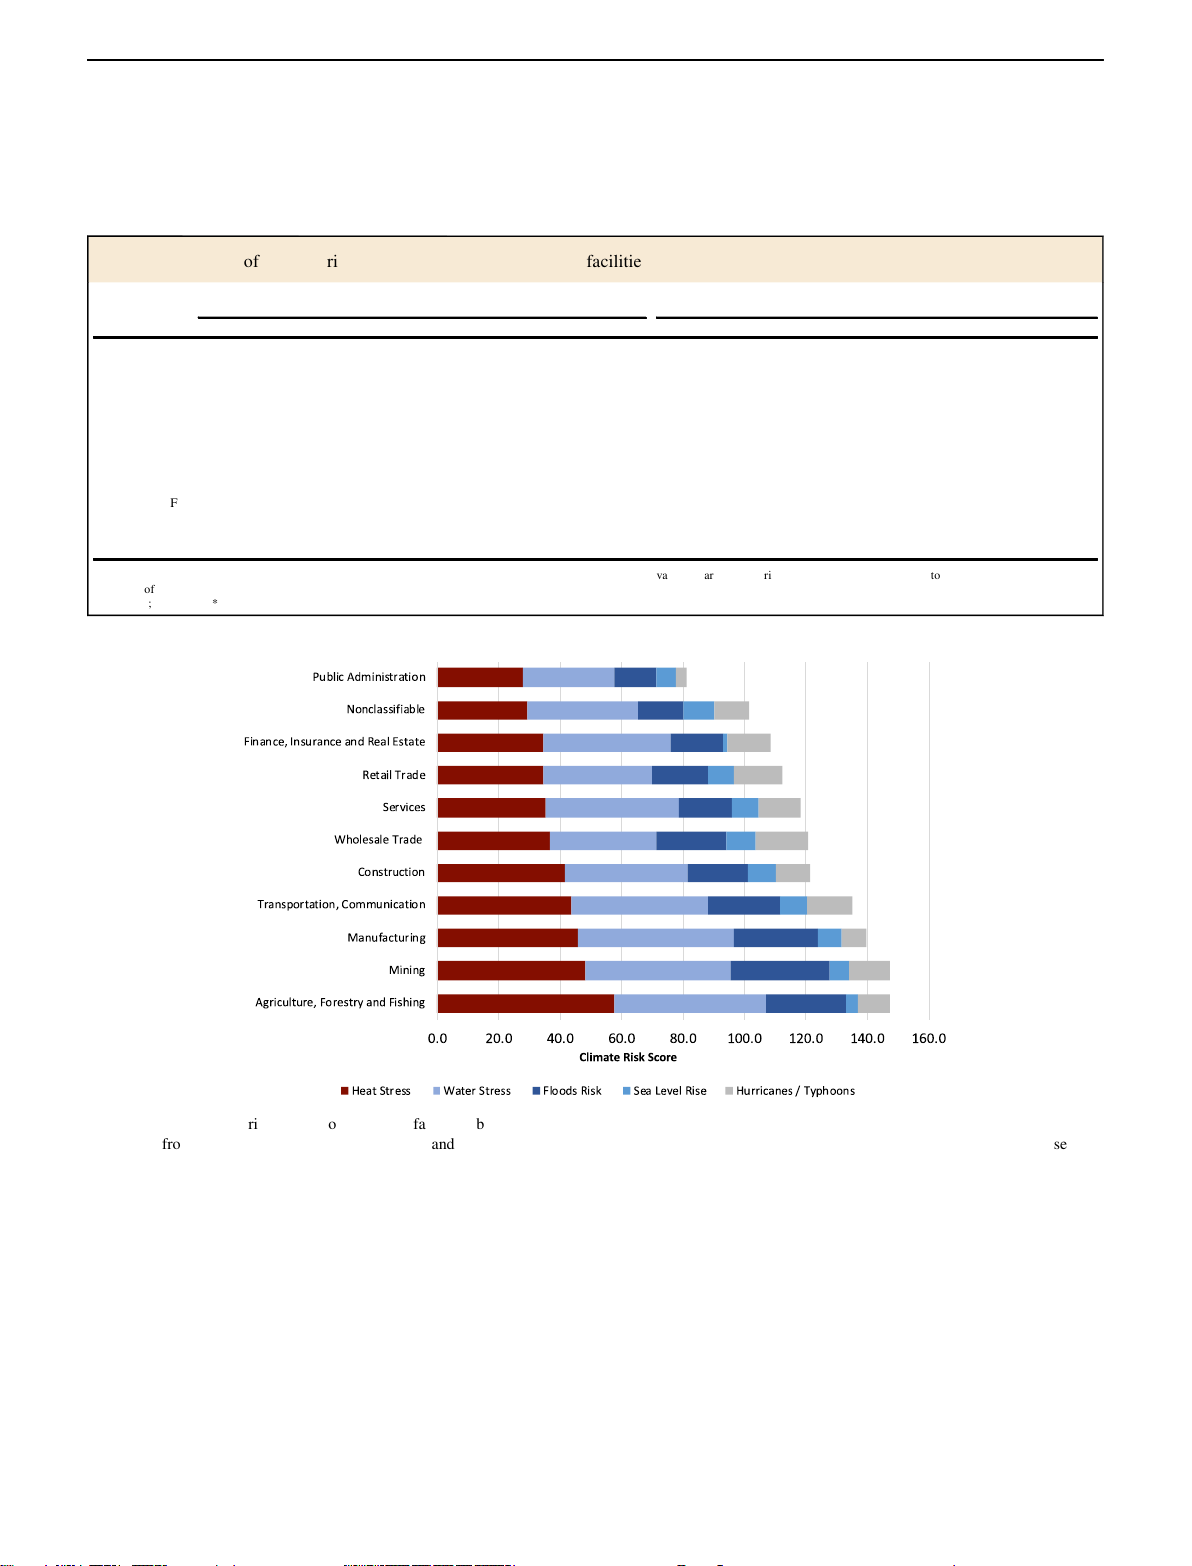
Figure 2 shows the climate risk scores of firms’ overseas
climate risks across host countries. Specifically, they have facilities by industry according to the SIC groups. On average,
significantly and substantially lower floods, seas level rise, and agriculture and mining industries have the highest aggregate
hurricanes/typhoons risks across host countries, compared with climate risk, while the public administration sector has the lowest
local facilities. This is probably because firms are more concerned climate risk. Specifically, the agriculture, forestry, and fishing
with host country risks, including climate risks, when investing industry has the highest heat stress risk; the manufacturing
abroad. They may face discrimination by host country industry has the highest water stress; the mining industry has the
stakeholders, receive more attention because they look different, highest floods risk; and the whole trade industry has the highest
and have difficulty in responding to some local conditions14,27. sea level rise and hurricane/typhoon risks. These findings make
Within host countries, however, we don’t find substantial sense as location-specific assets that are resource-intensive
differences between climate risks of foreign-owned/operated sectors such as agriculture, mining, and manufacturing with NA T U R E CO M M U N I C AT I O N S | ( 2 02 2 ) 1 3: 14 5 1 | ht t p s : / / d o i . or g /1 0 . 1 0 3 8 /s 4 1 4 6 7- 0 2 2 - 2 89 7 5 - 5 | ww w . n a t ur e . c o m /n at u r e c om m u n i c a t io n s 3
Content courtesy of Springer Nature, terms of use apply. Rights reserved lOMoAR cPSD| 47708777
ARTICLE NATURE COMMUNICATIONS | https://doi.org/10.1038/s41467-022-28975-5
dependent upon natural resources for inputs are more directly
affected by chronic risks36 such as heat and water stresses, while
trade and transportation sectors are more directly affected by
sea level rise and hurricane/typhoon risks, as their assets are usually near seaports.
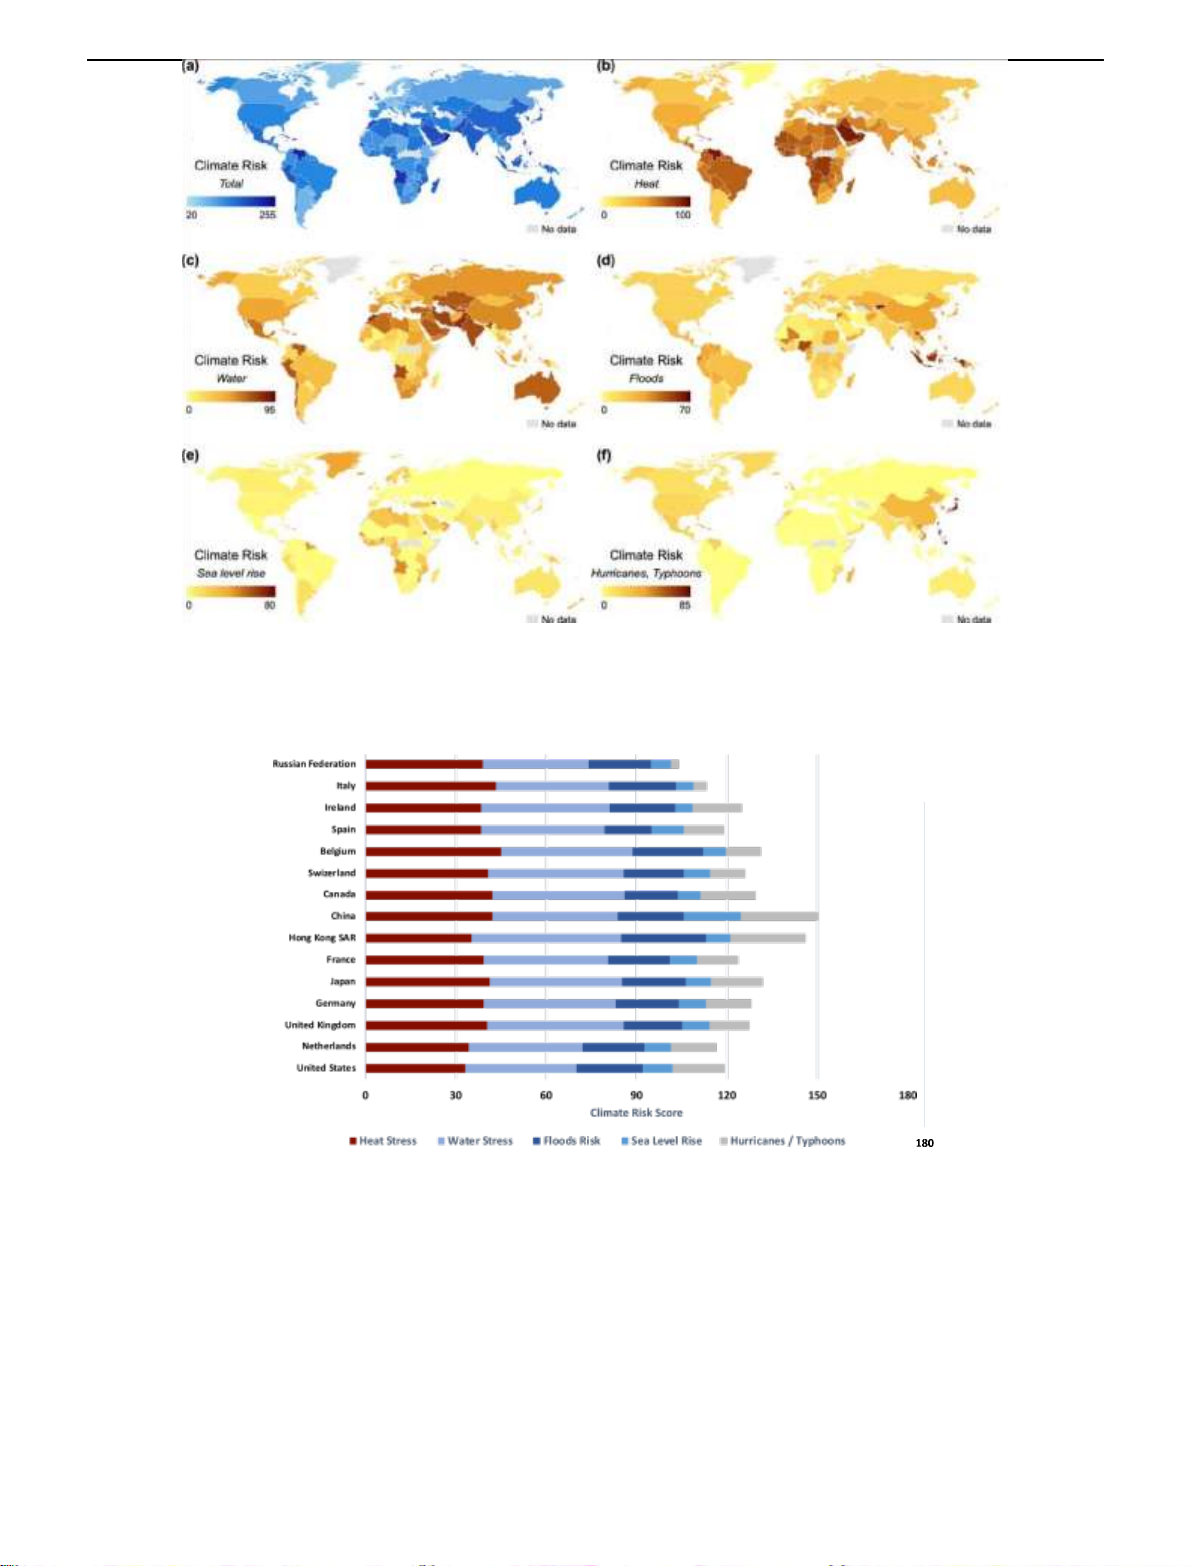
Figure 3 compares average climate risk scores of overseas
facilities in different countries. The descriptive statistics suggest
that overseas facilities in the Caribbean (e.g., Trinidad and
Tobago), the Middle East (e.g., Bahrain), and Southeast Asia ( e.g.,
the Philippines) have the highest climate risks. Facilities in Africa
(e.g., Rwanda), West Asia (e.g., Saudi Arabia), and South America
(e.g., Venezuela) have high heat stress. Facilities in the Middle
East (e.g., Bahrain) and central Asia (e.g., Tajikistan and Pakistan)
have high water stress. Facilities in Southeast Asia (e.g., Indonesia
and Laos) and Central Asia (e.g., Kyrgyzstan) have high floods risk.
Facilities on certain islands (e.g., the Faroe Islands and the
Solomon Islands) have high sea level rise risk. Facilities in East
Asia (e.g., Taiwan, Hong Kong SAR, and Japan) have high
hurricane and typhoon risk. Supplementary Fig. 1 in the
Supplementary Document summarizes climate risk scores of
overseas facilities in the 15 jurisdictions with the highest FDI
inflow stock between 1970 and 2019; among these jurisdictions,
overseas facilities in Hong Kong SAR have the highest aggregated climate risk.
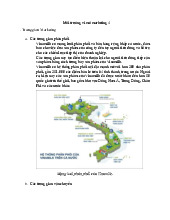
Climate risks of Chinese overseas facilities. Figure 4 summarizes
climate risk scores of overseas facilities owned by firms in the 15
jurisdictions with the highest FDI outflow stock between 1970
and 2019. Among those jurisdictions, facilities owned or operated
by firms headquartered in China have the highest climate risks
across industries and host countries among all foreign operating
multinationals. Overseas facilities owned by Hong Kong SAR firms
have the highest water stress and floods risks, while facilities
owned by mainland Chinese firms have the highest hurricanes/
typhoons and sea level rise risks. 4 NA T U R E CO M MU N I C A T I ON S | ( 20 22 )1 3: 1 4 5 1 | ht t p s : / / d oi . o r g /1 0 . 1 0 3 8 /s 4 1 4 67 - 0 2 2 - 28 9 7 5 - 5 | ww w . n a t ur e . c o m/ n a tu r e c o m mu n i c a t i o n s
Content courtesy of Springer Nature, terms of use apply. Rights reserved lOMoAR cPSD| 47708777
NATURE COMMUNICATIONS | https://doi.org/10.1038/s41467-022-28975-5 ARTICLE
The descriptive statistics above suggest that overseas facilities average of all FDI facilities. We estimate Eq. (2a) (Model 1) to
owned or operated by Chinese companies (including Hong Kong examine whether climate risks of Chinese-owned/operated Table 1 Diff
erence of climate risks of foreign-owned/operated facilities. Model 1 - across country Model 2 - within country Heat Water Floods
Sea level rise Hurricanes/Typhoons Heat Water Floods
Sea level rise Hurricanes/Typhoons Foreign − 0.023 − 0.014 − 0.244 − 0.238 − 0.569 − 0.019 0.036 − 0.059 − 0.046 − 0.013 [0.059] [0.026] [0.024]*** [0.066]*** [0.043]*** [0.007]** [0.013]** [0.012]*** [0.033] [0.009] Controls Cash − 0.449 − 0.415 0.515 0.480 − 0.369 − 0.079 0.345 − 0.018 0.299 − 0.077 [0.353] [0.365] [0.120]*** [0.348] [0.436] [0.034]** [0.169]* [0.022] [0.150]* [0.066] Size 0.034 0.056 − 0.017 − 0.024 − 0.053 − 0.006 − 0.004 0.008 0.041 0.004 [0.009]*** [0.019]** [0.008]* [0.009]** [0.021]** [0.006] [0.012] [0.006] [0.006]*** [0.003] ROA 1.785 1.421 − 1.216 − 1.457 − 0.936 − 0.103 − 0.299 − 0.084 − 0.057 − 0.013 [0.168]***
[0.328]*** [0.212]*** [0.140]*** [0.275]*** [0.196] [0.208] [0.121] [0.146] [0.040] Leverage 0.096 − 0.008 0.002 0.019 − 0.186 0.019 0.140 0.016 0.016 0.011 [0.190] [0.110] [0.119] [0.116] [0.247] [0.026] [0.030]*** [0.018] [0.017] [0.016] Host country FE N N N N N Y Y Y Y Y Industry FE Y Y Y Y Y Y Y Y Y Y N 51084 50665 50196 51084 51084 51084 50665 50196 51084 51084 r2 0.071 0.143 0.191 0.083 0.155 0.953 0.764 0.557 0.522 0.928
The unit of analysis is fi rm-host country-industry. Standard errors are clustered at the industry level. Outcome variables a
re climate r isk s cores and a re standardized to a mean of 0 and a s tandard deviation of 1. *** P < 0.01; ** P< 0. 05 ; * P < 0.1.
Fig. 2 Average climate risk scores of overseas facilities by industry. Analysis is based on climate risk scores and facility statistics of 2233 public companies from Twenty transportation, Four
Seven. Transportation and Communication sector includes service.
communications, electric, gas and sanitary
SAR) have the highest aggregate climate risks across host overseas facilities differ from those of the global FDI within
countries and industries. However, it is not clear whether the industry and across host countries, and estimate Eq. (2b) (Model
difference is statistically significant, considering industry factors 2) to examine whether climate risks of Chinese-owned/operated
and firm characteristics. We therefore estimate a baseline overseas facilities differ from the global FDI within industry and
specification to analyze whether the climate risks of host country. Outcome variables are physical climate risk scores
Chineseowned/operated overseas facilities differ from the for different climate risk drivers: heat stress, water stress, floods, NA T U R E CO M M U N I C AT I O N S | ( 2 02 2 ) 1 3: 14 5 1 | ht t p s : / / d o i . or g /1 0 . 1 0 3 8 /s 4 1 4 6 7- 0 2 2 - 2 89 7 5 - 5 | ww w . n a t ur e . c o m /n at u r e c om m u n i c a t io n s 5
Content courtesy of Springer Nature, terms of use apply. Rights reserved
Table 2 Difference of climate risks of Chinese-owned/operated overse as facilities. lOMoAR cPSD| 47708777
Model 1 - across country Model 2 - within country ARTICLE Heat Water Floods Sea Hurricanes/ Heat Water Floods Sea Hurricanes/
NATURE COMMUNICATIONS | https://doi.org/10.1038/s41467-022-28975-5 level rise Typhoons level rise Typhoons ChineseFDI −0.131 0.149 0.273 −0.039 0.503
−0.009 −0.088 −0.074 −0.150 −0.123 [0.087] [0.067]** [0.032]*** [0.092] [0.092]*** [0.027] [0.037]** [0.054] [0.097] [0.073] Controls GDPPerCapita −0.078 −0.047 0.010 0.031 −0.021 −0.006 0.010 0.004 0.028 0.002
[0.029]** [0.020]** [0.012] [0.013]** [0.016] [0.004] [0.007] [0.004] [0.008]*** [0.006]
CO2PerCapita −0.079 −0.047 −0.004 −0.040 0.055 0.000 −0.016 −0.012 −0.062 −0.003 [0.018]*** [0.027] [0.006] [0.017]** [0.035] [0.004] [0.017] [0.009] [0.015]*** [0.007] Cash 0.071 0.350 −0.030 0.340 −0.591 −0.076 0.310 −0.094 0.356 −0.163 [0.187] [0.191] [0.064] [0.162]* [0.158]*** [0.029]** [0.142]* [0.051]* [0.193]* [0.081]* Size 0.005 0.018 0.020 0.050 0.026 −0.004 0.000 0.017 0.054 0.000 [0.023] [0.018] [0.009]** [0.021]** [0.027] [0.005] [0.008] [0.008]* [0.017]*** [0.004] ROA −0.059 −0.302 0.171 −0.025 0.299 −0.087 −0.186 −0.077 0.137 0.104 [0.585] [0.373] [0.093]* [0.372] [0.179] [0.151] [0.167] [0.074] [0.287] [0.044]** Leverage −0.012 0.035 0.011 0.028 −0.111 −0.005 0.071 0.081 0.015 −0.014 [0.081] [0.043] [0.036] [0.052] [0.059]* [0.012] [0.024]** [0.016]*** [0.029] [0.020] FirmLocalExp 0.036 −0.090 0.015 0.024 0.090 0.011 0.013 0.006 0.006 −0.006 [0.015]** [0.019]*** [0.005]** [0.012]* [0.023]*** [0.005]* [0.007] [0.007] [0.010] [0.006] Host Country FE N N N N N Y Y Y Y Y Industry FE Y Y Y Y Y Y Y Y Y Y
N 40761 40365 39584 40761 40761 40761 40365 39584 40761 40761 r2 0.075 0.130 0.124 0.047 0.045 0.945 0.754 0.365 0.449 0.895
The unit of analysis is firm-host country-industry. Standard errors are clustered at the industry level. Outcome variables are climate risk scores and are standardized to a mean of 0 and a standard deviation of 1.
GDPPerCapita, CO2PerCatpita, and FirmLocalExperience are also standardized for easy interpretation.
sea level rise, and hurricanes/typhoons. The explanatory variable the top 15 FDI exporters (Supplementary Table 4); (c) change
ChineseFDI is a dummy which equals to 1 if overseas facilities
control variables (Supplementary Table 5); and (d) aggregate
are owned or operated by Chinese companies. Each analysis climate risk drivers at the firm level (Supplementary Table 6).
controls for headquarter countries’ economic development and
We further explore why Chinese overseas facilities have higher
carbon emissions and for a set of firm-level control variables. The climate risks across host countries. It may be that some Chinese
Methods section details the model specifications (Eqs. (2a) and companies are willing to invest in countries for political or
(2b)) and explains the selection of control variables.
strategic reasons, regardless of climate risks. For instance, the
Table 2 presents the results. The statistically significant positive Belt and Road Initiative (BRI) was launched in China in 2013 to
coefficients on ChineseFDI in Model 1 suggest that Chinese improve regional and transcontinental cooperation and
overseas facilities are exposed to higher water stress, flood, and connectivity through investments and trade37. As shown in Fig. 3,
hurricanes/typhoons risks across host countries (p-values <0.05) facilities in a lot of BRI countries (e.g., countries in Africa,
, compared to all other overseas facilities. The heat stress and sea Southeast Asia, and Latin America) face higher climate risks.
level rise risks of Chinese overseas facilities do not differ Second, Chinese companies started to invest overseas
statistically from those of non-Chinese FDI across countries. aggressively in the early 2000s and may therefore have had to
Results in Model 2 suggest that within a host country, the climate invest in
risks of Chinese-owned/operated facilities do not differ
***P < 0.01; **P < 0.05; *P < 0.1.
significantly from those of non-Chinese overseas facilities except
for water stress. Chinese overseas assets are associated with a 9
percent standard deviation decrease in water risk scores within locations with higher climate risks because the less-risky
host country (p-values <0.05). The results imply that the higher locations had already been taken32,33. Third, as suggested in Table
climate risks of Chinese overseas assets across host countries are 3, the climate risks of a firm’s headquarter country are positively
driven by the countries Chinese companies invest. In other associated with those of its overseas facilities. As facilities in
words, relative to other global public companies, Chinese China have relatively high climate risks (see Fig. 3), Chinese firms
companies locate facilities in host countries with higher climate are likely to take above-average climate risks when investing
risks. Within each host country and industry, Chinese facilities do overseas. This is consistent with previous research suggesting
not tend to be in areas with higher climate risks than are non-
that firms with local experience of high risks (e.g., natural Chinese foreign facilities.
disasters or political risks) are more likely to expand into other
The Supplementary Information includes robustness checks. countries posing such risks24,25.
Results are robust when we (a) remove resource-intensive
industries such as mining, transportation, communications,
electric, and gas (Supplementary Table 3); (b) focus on firms from 6 NA T U R E CO M MU N I C A T I ON S | ( 20 22 )1 3: 1 4 5 1 | ht t p s : / / d oi . o r g /1 0 . 1 0 3 8 /s 4 1 4 67 - 0 2 2 - 28 9 7 5 - 5 | ww w . n a t ur e . c o m/ n a tu r e c o m mu n i c a t i o n s
Content courtesy of Springer Nature, terms of use apply. Rights reserved lOMoAR cPSD| 47708777
NATURE COMMUNICATIONS | https://doi.org/10.1038/s41467-022-28975-5 ARTICLE Discussion
data on firms’ overseas projects in certain industries and examine
This paper fills a research gap by assessing climate risks of FDI. the extent to which climate risk is a factor in choosing locations.
We find that foreign investments have substantially and Second, there are inherent uncertainties in climate risk data
significantly lower climate risks—particularly flood, sea-level, and predicted by geospatial, historical, and projection models59,60, but
hurricane/typhoon—compared with all facilities across host for now they are the best data available. Lastly, the unit of
countries. The differences of climate risks of foreign facilities are analysis is the firm-host country-industry, but for some large
small within host countries. We also document the countries, such as the United States and China, climate risks vary
heterogeneities of the climate risks of overseas facilities across within the country (e.g., coastal versus inland areas; west versus
industries and countries. Further, we focus on China and explore east). It would be interesting for future research to disentangle
whether Chinese-owned/operated overseas facilities differ from such within-country differences.
those of the global FDI. Our findings suggest that Chinese FDI
have higher water, floods, and hurricanes/typhoons risks across
countries, compared to all overseas facilities. Within host Methods
countries, however, the climate risks of Chinese overseas Data. The assessment of firms’ physical climate risks requires climate models with
which to conduct forward-looking analysis, as climate risks cannot simply be
facilities are comparable with those of non-Chinese counterparts. calculated based on historical data. In this study, we use the physical climate risk
This study has several contributions. First, it is related to the
nascent but growing literature on physical climate risks. Most
recent research has focused on the financial impact of climate
risks on firm performance2,18,38, asset value39,40, and cost of
capital19. We expand this literature by systematically evaluating
the physical climate risks of firms’ FDI.
Second, the insights of this paper shed light upon the
multidisciplinary dialogue on FDI and the environment13–15,40,41 by
exploring the physical climate constraints on firms, rather than
firms’ environmental externalities. As firms are already being
affected by climate risks, they need to add those risks into their cost function.
Third, this paper contributes to the emerging literature on
Chinese overseas investment. While previous research focuses
on environmental and social impacts of Chinese firms investing
abroad such as carbon emissions, toxic pollutants, and ecological
effects42–45, this paper focuses on the climate risks of Chinese FDI
and compares it with the global average.
Finally, our research has policy implications. Governments,
investors, and communities are becoming more active in
addressing their climate risks46–51. For instance, the Task Force on
Climate-related Financial Disclosures was established in 2015 to
improve and increase reporting of climate-related financial
information52. The Network for Greening the Financial System
was established in 2017 to share climate-risk–management best
practices among central banks and supervisors53. The 2020
version of the Equator Principles incorporated climate risk
assessment into its guidelines and called for climate-resilient
infrastructure54. Understanding the climate risk baseline of firms’
global assets can help policymakers and international
organizations craft climate-related policies or guidelines55–58. For
instance, the Chinese government may want to take climate risks
into consideration when promoting BRI investments.
This study has limitations. First, the analysis is cross-sectional,
as time-specific information on when companies built or acquired
each facility was not available. Future research can collect panel NA T U R E CO M M U N I C AT I O N S | ( 2 02 2 ) 1 3: 14 5 1 | ht t p s : / / d o i . or g /1 0 . 1 0 3 8 /s 4 1 4 6 7- 0 2 2 - 2 89 7 5 - 5 | ww w . n a t ur e . c o m /n at u r e c om m u n i c a t io n s 7
Content courtesy of Springer Nature, terms of use apply. Rights reserved lOMoAR cPSD| 47708777
ARTICLE NATURE COMMUNICATIONS | https://doi.org/10.1038/s41467-022-28975-5
scores at the firm–industry–host-country level collected from Four Twenty Seven
than an office and, thus, will be more sensitive to the impacts of increasing
(currently Moody’s ESG Solutions). The sample covers 2233 public companies
temperature on energy usage. As a result, an office would receive a lower heat
Table 3 Climate risks in fi rms ’ headquarter countries and those of fi rms ’ FDI. Overseas heat Overseas water Overseas fl oods Overseas sealevel Overseas hurricanes HQHeat 0.241 [0.041]*** HQWater 0.158 [0.024]*** HQFloods 0.062 [0.012]*** HQSealevel 0.102 [0.024]*** HQHurricanes 0.222 [0.024]*** GDPPerCapita − 0.021 − 0.017 0.008 0.032 − 0.030 [0.011]* [0.013] [0.010] [0.012]** [0.021] CO2PerCapita 0.012 − 0.009 − 0.015 − 0.041 − 0.009 [0.024] [0.032] [0.008]* [0.021]* [0.036] Cash 0.210 0.358 − 0.029 0.291 − 0.599 [0.175] [0.157]** [0.062] [0.167] [0.137]*** Size 0.014 0.02 0.022 0.048 0.029 [0.023] [0.019] [0.011]* [0.019]** [0.025] ROA 0.416 − 0.074 0.173 − 0.136 0.446 [0.545] [0.345] [0.085]* [0.387] [0.229]* Leverage − 0.029 0.054 − 0.003 0.024 − 0.113 [0.088] [0.045] [0.050] [0.056] [0.056]* Industry FE Y Y Y Y Y N 40885 40488 39704 40885 40885 r2 0.070 0.126 0.120 0.045 0.037
The unit of analysis is fi rm-host country-industry. Standard errors are clustered at t he industry level. Out
come variables a re climate r isk s cores and are standardized to a mean of 0 and a standard
deviation of 1. GDPPerCapita ,CO2PerCatpita ,and FirmLocalExperience
are also standardized for easy interpretation. *** P < 0.01 ; ** P< 0.05 ; * P < 0.1.
headquartered in 47 jurisdictions with more than 1 million facilities across 200
stress score than a data center in the same area. The Supplementary Discussion
jurisdictions and 10 SIC groups. Around 28.8 percent of the facilities are outside
provides more details on how adjustments of climate risk scores are made based
the firm’s headquarter country (i.e., overseas facilities). Facility is defined as any
on facilities’ economic activities.
operational legal entity owned or operated by a company. This includes a wide
Raw indicators for each climate risk driver—heat stress, water stress, floods,
range of operating activities—such as factories, offices, ports, warehouses, and
sea level rise, and hurricanes/typhoons—are translated into a standardized score
stores—but does not include sites that are being developed and not yet
ranging from 0 to 100; higher scores reflect higher exposure. Four Twenty Seven
operational. Other entities, such as European Central Bank, also use Four Twenty
started to provide physical climate risk data in 2018. We use the 2019 data because
Seven data for climate risk analysis61.
it covers more public firms and facilities than the 2018 data. Also, because the
A facility’s climate risks of its direct operations are mainly determined by the
evaluation of climate risk is based on the mid-term climate projection ( e.g., 2030–
facility’s location and the nature of its activities. Four Twenty Seven evaluates
2040) and its difference with the historical baseline, facilities’ climate risk scores
climate risks using several geospatial, historical, and projection models based on
do not change much across years.
the specific locations of companies’ facilities. The criteria for analysis include
Like most climate projections, Four Twenty Seven’s climate risk scores have
detailed climate projections that measure the change in extreme events such as
limitations. First, its evaluation of future extreme weather does not necessarily
heavy rainfall, high temperatures, hurricanes, coastal flooding, drought, and water
capture the most severe weather events. Second, it uses multi-model means,
stress. Four Twenty Seven’s analysis focuses on extreme weather impacts (e.g.,
which may under-sample tail-end extreme events by missing processes below the
tropical cyclones) today and on other climate impacts at a mid-term projection
model’s resolution62. Third, there is uncertainty in modeling average shift in
period, 2030–2040. Supplementary Table 1 explains in greater detail the
climate, although Four Twenty Seven applies statistical validation methods to
methodology, including the spatial scale, baseline period, projection period, and
account for model uncertainties and to ensure practicable directional accuracy.
specific measurement for analyzing different climate risk drivers. Further, to factor
Firm financial data are constructed from Compustat. Size is the natural
the differential impacts of climate risk drivers on different economic activities, Four
logarithm of the book value of total assets. Return on assets (ROA) is the ratio of
Twenty Seven assigns a series of sensitivity factors to the facilities that they model
operating income before depreciation to the book value of total assets. Leverage
based on the nature of their activities. These factors vary by climate risk driver,
is the ratio of debt (long-term debt plus short-term debt) to the book value of total
reflecting the sensitivity and vulnerability of the company’s activities to the
assets. Cash holding is the ratio of cash and short-term investments to the book
corresponding risk factors. For example, a data center is more energy intensive
value of total assets. FirmLocalExp is a firm’s average climate risk in its 8 NA T U R E CO M MU N I C A T I ON S | ( 20 22 )1 3: 1 4 5 1 | ht t p s : / / d oi . o r g /1 0 . 1 0 3 8 /s 4 1 4 67 - 0 2 2 - 28 9 7 5 - 5 | ww w . n a t ur e . c o m/ n a tu r e c o m mu n i c a t i o n s
Content courtesy of Springer Nature, terms of use apply. Rights reserved lOMoAR cPSD| 47708777
NATURE COMMUNICATIONS | https://doi.org/10.1038/s41467-022-28975-5 ARTICLE
headquarter country, calculated from facility statistics from Four Twenty Seven. Data availability
FDI outflow and inflow and countrylevel GDP per capita are from the World Bank.
The data that support the findings of this study are available from Four Twenty Seven
Country-level CO2 emissions per capita are from Our World in Data’s CO2 and
(currently Moody’s ESG Solutions) but restrictions apply to the availability of these
Greenhouse Gas Emissions database. Supplementary Table 2 reports descriptive data.
statistics for different variables.
Data from Four Twenty Seven are proprietary and covered by Non-Disclosure
Agreement, and so are not publicly available. Data are however available from the
Model specifications. To assess the difference between the climate risks of
authors upon reasonable request and with permission of Four Twenty Seven.
overseas facilities and that of the global average across host countries, we estimate
Eq. (1a) for different climate risk drivers, using the sample of all overseas and local
facilities owned or operated by the 2233 public firms globally. Code availability
The STATA code used to run the regression analysis is available from the authors upon
ClimateRiskijc ¼ αj þ β1 ´ Foreign þγ0Controlsih þεijc ð1aÞ
request. Restrictions apply to the availability of the data underlying the analysis.
To assess the difference between the climate risks of overseas facilities and
the global average within the same host country, we estimate Eq. (1b) for
Received: 4 May 2021; Accepted: 16 February 2022;
different climate risk drivers.
ClimateRiskijc ¼ αj þαc þβ2 ´ Foreign þγ0 Controlsih þεijc ð1bÞ
To assess the difference of the climate risks of Chinese overseas facilities across
host countries, we estimate Eq. (2a) for different climate risk drivers, using the References
sample of all overseas facilities owned operated by the 2233 public firms globally
1. Carleton, T. & Hsiang, S. Social and economic impacts of climate. Science. 353, ClimateRisk aad9837 (2016).
ijc ¼ αj þβ3 ´ ChinesesFDI þγ0Controlsih þεijc ð2aÞ
2. Hong, H., Li, F. & Xu, J. Climate risks and market efficiency. J. Econ. 208, 265–
To assess the difference of the climate risks of overseas facilities owned or 281 (2019).
operated by Chinese companies within countries, we estimate Eq. (2b) for different
3. McKinsey Global Institute. Climate risk and response: Physical hazard and climate risk drivers:
socioeconomic impacts. https://www.mckinsey.com/~/media/mckinsey/
business%20functions/sustainability/our%20insights/climate%20risk%20and
ClimateRiskijc ¼ αj þαc þβ4 ´ ChinesesFDI þγ0Controlsih þεijc ð2bÞ %
where i indexes firm, j indexes industry, c indexes host country, and h indexes
20response%20physical%20hazards%20and%20socioeconomic%20impacts/ headquarter country. α
mgi-climate-risk-and-response-full-report-vf.pdf (2020), accessed July 2020.
j are industry fixed effects. αc are host country-fixed effects. ε
4. New York Times. Companies See Climate Change Hitting Their Bottom Lines
ijc is the residual. The unit of analysis is firm-host country-industry. The regression
is estimated by analytical weighted least squares, where the weight is the total in the Next 5 Years,
facility count of a firm’s operation in one industry and in one host country.
https://www.nytimes.com/2019/06/04/climate/companiesclimate-change-
Standard errors are clustered at the industry level.
financial-impact.html (2019), accessed September 2020.
In Eqs. (1a) and (1b), the coefficients of interest are β1 and β2, which measure
5. Byers, E. A. et al. Drought and climate change impacts on cooling water
the association of foreign ownership and climate risks of facilities. In Eqs. (2a) and
shortages and electricity prices in Great Britain. Nat. Commun. 11, 2239
(2b), the coefficients of interest are β3 and β4, which measure the association (2020).
between Chinese ownership and climate risks of overseas facilities. Equations (1a)
6. Kearney. Entering the storm: Anticipating risk in an uncertain world: The 2020
and (2a) include the industry-fixed effects which account for the unobserved
FDI Confidence Index, https://www.kearney.com/foreign-directinvestment-
heterogeneity of the industry. Equations (1b) and (2b) have both the industry fixed
confidence-index/2020-full-report (2020).
effects and host country fixed effects, which accounts for the unobserved
7. Pachauri R. K., Meyer L. A. (eds) IPCC AR5 synthesis report: Climate change
heterogeneity of the industry and the host country.
2014 (IPCC, Geneva, 2014).
Outcome variables are physical climate risk scores for different climate risk
8. Nikkei Asian Review. Storm clouds loom for Asian companies unready for
drivers: heat stress, water stress, floods, sea level rise, and hurricanes/typhoons. climate change,
https://asia.nikkei.com/Spotlight/Asia-Insight/Storm-
The climate risk scores are standardized to a mean of 0 and a standard deviation
cloudsloom-for-Asian-companies-unready-for-climate-change (2018),
of 1 for easy interpretation. The inclusion of control variables mitigates the accessed September 2020.
possibility that our findings are driven by some firm- or country- level omitted
9. CNBC. Water shortage shuts Coca-Cola plant in India, https://
variables. For example, it could be that larger companies have higher climate risks;
www.cnbc.com/2014/06/20/water-shortage-shuts-coca-cola-plant-
controlling for firm size and cash holdings addresses this potential confounding
inindia.html (2014), accessed December 2020.
influence. Similarly, the other controls account for differences in performance
10. South China Morning Post. China’s Belt and Road projects face climate change
(ROA and market-to-book), and in financing policies (leverage and cash holdings) challenges,
https://www.scmp.com/news/china/diplomacy/article/
that may correlate with a firm’s investment decisions. We also control for the
3130902/chinas-belt-and-road-projects-face-climate-change-challenges?
firm’s climate risk in its headquarter country (FirmLocalExp) because firms with
module=perpetual_scroll&pgtype=article&campaign=3130902 (2021) ,
experience of high-impact disasters maybe more likely to expand into countries accessed in August 2021.
experiencing such disasters26. We control for GDP per capita of the headquarter
11. Cole, M. A. Trade, the pollution haven hypothesis and the environmental
country because that country’s economic development level may affect firms’
Kuznets curve: examining the linkages. Ecol. Econ. 48, 71–81 (2004).
overseas location choices. We also control for CO2 emissions per capita of the
12. Stern, D. The rise and fall of the environmental Kuznets curve. World Dev. 32,
headquarter country because it may be associated with FDI and sovereign risks15,63. 1419–1439 (2004). NA T U R E CO M M U N I C AT I O N S | ( 2 02 2 ) 1 3: 14 5 1 | ht t p s : / / d o i . or g /1 0 . 1 0 3 8 /s 4 1 4 6 7- 0 2 2 - 2 89 7 5 - 5 | ww w . n a t ur e . c o m /n at u r e c om m u n i c a t io n s 9
Content courtesy of Springer Nature, terms of use apply. Rights reserved lOMoAR cPSD| 47708777
ARTICLE NATURE COMMUNICATIONS | https://doi.org/10.1038/s41467-022-28975-5
13. Zarsky L. Havens, halos and spaghetti: Untangling the evidence about foreign
35. TCFD. Recommendations of the task force on climate-related financial
direct investment and the environment. In Foreign direct investment and the disclosures.
https://assets.bbhub.io/company/sites/60/2020/10/FINAL-
environment, 47–74 (OECD, Paris, France, 1999).
2017TCFD-Report-11052018.pdf (2017).
14. King, A. A. & Shaver, J. Are aliens green? Assessing foreign establishments’ 36. TCFD. 2019 status report.
environmental conduct in the United States. Strategic Manag. J. 22, 1069–
https://assets.bbhub.io/company/sites/60/2020/10/ 2019-TCFD-Status- 1085 (2001).
Report-FINAL-0531191.pdf (2019).
15. Nguyen D. K., Huynh T. L. D., Nasir M. A. Carbon emissions determinants and
37. Coenen, J., Bager, S., Meyfroidt, P., Newig, J. & Challies, E. Environmental
forecasting: evidence from G6 countries. J. Environ. Manag. 285, https://
governance of China’s belt and road initiative. Environ. Policy Gov. 31, 3–17
doi.org/10.1016/j.jenvman (2021). (2020).
16. Omri, A., Nguyen, D. K. & Rault, C. Causal interactions between CO2
38. Choi, D., Gao, Z. & Jiang, W. Attention to global warming. Rev. Financial Stud.
emissions, FDI, and economic growth: evidence from dynamic 33, 1112–1145 (2020).
simultaneousequation models. Economic Model. 42, 382–389 (2014).
39. Baldauf, M., Garlappi, L. & Yannelis, C. Does climate change affect real estate
17. Addoum J. M., Ng D. T., Ortiz-Bobea A. Temperature shocks and industry
prices? Only if you believe in it. Rev. Financial Stud. 33, 1256–1295 (2020).
earnings news. https://ssrn.com/abstract=3480695 (2021).
40. Gallagher, K. P. Economic globalization and the environment. Annu. Rev.
18. Bernstein, A., Gustafson, M. & Lewis, R. Disaster on the horizon: the price
Environ. Resour. 34, 279–304 (2009).
effect of sea level rise. J. Financial Econ. 132, 253 –272 (2018).
41. Ameli, N. et al. Higher cost of finance exacerbates a climate investment trap
19. Kling, G., Volz, U., Murinde, V. & Ayas, S. The impact of climate vulnerability
in developing economies. Nat. Commun. 12, å4046 (2021).
on firms’ cost of capital and access to finance. World Dev. 137, 1–11 (2021).
42. Chen, X., Gallagher, K. P. & Mauzerall, D. L. Chinese overseas development
20. Huang, H., Kerstein, J. & Wang, C. The impact of climate risk on firm
financing of electric power generation: a comparative analysis. One Earth 3,
performance and financing choices: an international comparison. J. Int. Bus. 491–503 (2020).
Stud. 49, 633–656 (2018).
43. Springer C. H. et al. An empirical analysis of the environmental performance
21. Wheeler, D. & Mody, A. International investment location decisions: the case
of China’s overseas coal plants. Environ. Res. Lett. https://doi.org/10.1088/
of U.S. firms. J. Int. Econ. 33, 57–76 (1992). 1748-9326/abf287 (2021).
22. Makusen J. R., Maskus K. E. Discriminating among alternative theories of the
44. Zhang, N., Liu, Z., Zheng, X. & Xue, J. Carbon footprint of China’s belt and road.
multinational enterprise. NBER Working Paper 7164, 1–28, ( NBER,
Science 357, 1107–1107 (2017). Cambridge, MA, 1999).
45. Zhang, J. & Fu, X. FDI and environmental regulations in China. J. Asia Pac.
23. Henisz, W. J. & Macher, J. T. Firm- and country-level trade-offs and
Econ. 13, 332–353 (2008).
contingencies in the evaluation of foreign investment: the semiconductor
46. World Economic Forum. The global risks report. https://www.weforum.org/
industry, 1994–2002. Organ. Sci. 15, 537–554 (2004).
reports/the-global-risks-report-2020 (2020), accessed October 2020.
24. Martin, X. & Salomon, R. Tacitness, learning and international expansion: a
47. Financial Times. Investors urge European companies to include climate risks
study of foreign direct investment in a knowledge-intensive industry. Organ. in accounts.
https://www.ft.com/content/dd01aacd-85a0-4577-
Sci. 17, 297 –311 (2003).
970026f1d6fb26b3?desktop=true&segmentId=dd5c99e9-30be-ddd0-
25. Oetzel, J. & Oh, C. H. Learning to carry the cat by the tail: Firm experience,
c634ff3a0c2b738f#myft:notification:daily-email:content (2020), accessed
disasters, and multinational subsidiary entry and expansion. Organ. Sci. 25, November 2020. 732–756 (2014).
48. Flammer C., Toffel M., Viswanathan K. Shareholder activism and firms’
26. Hymer S. The international operations of national firms: A study of direct
voluntary disclosure of climate change risks. Strat. Manag. J. https://doi.org/
foreign investment (MIT Press, Cambridge, MA, 1976). 10.1002/smj.3313 (2021).
27. UNCTAD. Handbook of Statistics, (United Nations Conference on Trade and
49. Krueger, P., Sautner, Z. & Starks, L. T. The importance of climate risks for Development, Geneva, 2020).
institutional investors. Rev. Financial Stud. 33, 1067–1111 (2020).
28. Gallagher, K. S., Qi Q. Policies governing China’s overseas development
50. Wall Street Journal. Show us your climate risks, investors tell companies.
finance: Implications for climate change (Center for International
https://www.wsj.com/articles/show-us-your-climate-risks-investors-
Environment and Resource Policy, The Fletcher School, Tufts University,
tellcompanies-11551349800 (2019), accessed December 2020. 2018).
51. Krueger, P., Sautner, Z. & Starks, L. T. The importance of climate risks for
29. Lee, C. K. The spectre of global China. New Left Review, 89 https://
institutional investors. Rev. Financial Stud. 33, 1067–1111 (2020).
newleftreview.org/issues/ii89/articles/ching-kwan-lee-the-spectre-of-
52. TCFD. Recommendations of the task force on climate-related financial globalchina (2014). disclosures.
https://assets.bbhub.io/company/sites/60/2020/10/FINAL-
30. Li Z., Gallagher K. P., Mauzerall D. L. China’s global power: estimating Chinese
2017TCFD-Report-11052018.pdf (2017).
foreign direct investment in the electric power sector. Energy Policy 136,
53. NGFS. Origin of the Network for Greening the Financial System. https://
https://doi.org/10.1016/j.enpol.2019.111056 (2020).
www.ngfs.net/en/about-us/governance/origin-and-purpose, accessed
31. Hofman, I. & Ho, P. China’s “developmental outsourcing”: a critical January (2021).
examination of Chinese global “land grabs” discourse. J. Peasant Stud. 39, 1–
54. The Equator Principles. https://equator-principles.com/wp-content/uploads/ 48 (2012).
2020/01/The-Equator-Principles-July-2020.pdf (2020), accessed October
32. Ullah, S., Wang, Z., Stokes, P. & Xiao, W. Risk perceptions and risk 2020.
management approaches of Chinese overseas investors: an empirical
55. Pinchot A., Zhou L., Christianson G., McClamrock J., Sato I. Assessing physical
investigation. Res. Int. Bus. Financ. 47(C), 470–486 (2019).
risks from climate change: do companies and financial organizations have
33. Luo, L., Qi, Z. & Hubbard, P. Not looking for trouble: Understanding largescale
sufficient guidance? https://www.wri.org/publication/physical-riskguidance
Chinese overseas investment by sector and ownership. China Economic Rev. (2021). 46(C), 142–164 (2017).
56. Demski, C., Capstick, S. & Pidgeon, N. Experience of extreme weather affects
34. Görgen, M. et al. Carbon risk. Available at SSRN: https://ssrn.com/
climate change mitigation and adaptation responses. Climatic Change 140, abstract=2930897 (2020). 149–164 (2017). 10 NA T U R E CO M MU N I C A T I ON S | ( 20 22 )1 3: 1 4 5 1 | ht t p s : / / d oi . o r g /1 0 . 1 0 3 8 /s 4 1 4 67 - 0 2 2 - 28 9 7 5 - 5 | ww w . n a t ur e . c o m/ n a tu r e c o m mu n i c a t i o n s
Content courtesy of Springer Nature, terms of use apply. Rights reserved lOMoAR cPSD| 47708777
NATURE COMMUNICATIONS | https://doi.org/10.1038/s41467-022-28975-5 ARTICLE
57. Kunreuther, H. et al. Risk management and climate change. Nat. Clim. Change © The Author(s) 2022 5, 447–450 (2013).
58. United Nations Environment Programme (UNEP). Adaptation gap report 2020. (UNEP, Nairobi, 2021).
59. Fiedler, T. et al. Business risk and the emergence of climate analytics. Nat.
Clim. Change 11, 87–94 (2021).
60. Keenan, J. M. A climate intelligence arms race in financial markets. Science 365, 1240–1243 (2019).
61. Financial Times. ECB stress test reveals economic impact of climate change.
https://www.ft.com/content/7b734848-1287-4106-b866-7d07bc9d7eb8 (2021).
62. Tebaldi, C. & Knutti, R. The use of the multi-model ensemble in probabilistic
climate projections. Philos. Trans. R. Soc. 365, 2053–2075 (2007).
63. Chaudhry, S. M., Ahmed R., Shafiullah M., Huynh T. L. D. The impact of carbon
emissions on country risk: Evidence from the G7 economies. J. Environ.
Manag. 265, 110533 (2020). Acknowledgements
The authors acknowledge the funding support of the ClimateWorks Foundation (191494, K.P.G.). Author contributions
X.L. conceived the study and performed the analysis K.P.G. supervised the project and
oversaw the research design. X.L. and K.P.G. discussed results and edited the manuscript at all stages. Competing interests
The authors declare no competing interests. Additional information
Supplementary information The online version contains supplementary material
available at https://doi.org/10.1038/s41467-022-28975-5.
Correspondence and requests for materials should be addressed to Xia Li or Kevin P. Gallagher.
Peer review information Nature Communications thanks Ulf Moslener and the other,
anonymous, reviewer(s) for their contribution to the peer review of this work. Peer
reviewer reports are available.
Reprints and permission information is available at http://www.nature.com/reprints
Publisher’s note Springer Nature remains neutral with regard to jurisdictional claims in
published maps and institutional affiliations.
Open Access This article is licensed under a Creative Commons
Attribution 4.0 International License, which permits
use, sharing, adaptation, distribution and reproduction in any medium or format, as long
as you give appropriate credit to the original author(s) and the source, provide a link to
the Creative Commons license, and indicate if changes were made. The images or other
third party material in this article are included in the article’s Creative Commons license,
unless indicated otherwise in a credit line to the material. If material is not included in
the article’s Creative Commons license and your intended use is not permitted by
statutory regulation or exceeds the permitted use, you will need to obtain permission
directly from the copyright holder. To view a copy of this license, visit
http://creativecommons.org/ licenses/by/4.0/. NA T U R E CO M M U N I C AT I O N S | ( 2 02 2 ) 1 3: 14 5 1 | ht t p s : / / d o i . or g /1 0 . 1 0 3 8 /s 4 1 4 6 7- 0 2 2 - 2 89 7 5 - 5 | ww w . n a t ur e . c o m /n at u r e c om m u n i c a t io n s 11
Content courtesy of Springer Nature, terms of use apply. Rights reserved lOMoAR cPSD| 47708777
ARTICLE NATURE COMMUNICATIONS | https://doi.org/10.1038/s41467-022-28975-5
Fig. 3 Average climate risk scores of overseas facilities by host country. Analysis based on climate risk scores and facility statistics of 2233 public companies
from Four Twenty Seven. The map images are created by the authors using ArcGIS. (a) Aggregate climate risk score, (b) heat stress score, (c) water stress score,
(d) floods score, (e) sea level rise score, (f) hurricanes/typhoons score.
Fig. 4 Average climate risk scores of overseas facilities by headquarters country: top 15 countries by FDI outflow stock, 1970–2019. Analysis based on climate
risk scores and facility statistics of 2233 public companies from Four Twenty Seven. FDI outflow stocks based on World Bank data. 12 NA T U R E CO M MU N I C A T I ON S | ( 20 22 )1 3: 1 4 5 1 | ht t p s : / / d oi . o r g /1 0 . 1 0 3 8 /s 4 1 4 67 - 0 2 2 - 28 9 7 5 - 5 | ww w . n a t ur e . c o m/ n a tu r e c o m mu n i c a t i o n s
Content courtesy of Springer Nature, terms of use apply. Rights reserved lOMoAR cPSD| 47708777 Terms and Conditions
Springer Nature journal content, brought to you courtesy of Springer Nature Customer Service Center GmbH (Spri nger Nature).
Springer Nature supports a reasonable amount of sharing of research papers by authors, subscribers and authorised users (Users), for smallscale
personal, non-commercial use provided that all copyright, trade and service marks and other proprietary notices are maintained. By accessing,
sharing, receiving or otherwise using the Springer Nature journal content you agree to these terms of use (Terms). For these purposes, Springer
Nature considers academic use (by researchers and students) to be non-commercial.
These Terms are supplementary and will apply in addition to any applicable website terms and conditions, a relevant site licence or a personal
subscription. These Terms will prevail over any conflict or ambiguity with regards to the relevant terms, a site licence or a personal subscription
(to the extent of the conflict or ambiguity only). For Creative Commons-licensed articles, the terms of the Creative Commons license used will apply.
We collect and use personal data to provide access to the Springer Nature journal content. We may also use these personal data internally within
ResearchGate and Springer Nature and as agreed share it, in an anonymised way, for purposes of tracking, analysis and reporting. We will not
otherwise disclose your personal data outside the ResearchGate or the Springer Nature group of companies unless we have your permission as
detailed in the Privacy Policy.
While Users may use the Springer Nature journal content for small scale, personal non-commercial use, it is important to note that Users may not:
1. use such content for the purpose of providing other users with access on a regular or large scale basis or as a means to circumvent access control;
2. use such content where to do so would be considered a criminal or statutory offence in any jurisdiction, or gives rise to civil liability, or is otherwise unlawful;
3. falsely or misleadingly imply or suggest endorsement, approval , sponsorship, or association unless explicitly agreed to by Springer Nature in writing;
4. use bots or other automated methods to access the content or redirect messages
5. override any security feature or exclusionary protocol; or
6. share the content in order to create substitute for Springer Nature products or services or a systematic database of Springer Nature journal content.
In line with the restriction against commercial use, Springer Nature does not permit the creation of a product or service that creates revenue,
royalties, rent or income from our content or its inclusion as part of a paid for service or for other commercial gain. Springer Nature journal content
cannot be used for inter-library loans and librarians may not upload Springer Nature journal content on a large scale into their, or any other, institutional repository.
These terms of use are reviewed regularly and may be amended at any time. Springer Nature is not obligated to publish any information or content
on this website and may remove it or features or functionality at our sole discretion, at any time with or without notice. Springer Nature may revoke
this licence to you at any time and remove access to any copies of the Springer Nature journal cont ent which have been saved.
To the fullest extent permitted by law, Springer Nature makes no warranties, representations or guarantees to Users, either express or implied with
respect to the Springer nature journal content and all parties disclaim and waive any implied warranties or warranties imposed by law, including
merchantability or fitness for any particular purpose.
Please note that these rights do not automatically extend to content, data or other material published by Springer Nature that may be licensed from third parties.
If you would like to use or distribute our Springer Nature journal content to a wider audience or on a regular basis or in any other manner not
expressly permitted by these Terms, please contact Springer Nature at
onlineservice@springernature.com
Downloaded by Anh Tr?n (trananh1307@gmail.com)
Tài liệu liên quan:
-

Chương 3 Môi trường Marketing môn Marketing căn bản | Trường đại học Mở Hà Nội
209 105 -
Tìm hiểu về Môi trường Vi mô Marketing & Phân phối của Vinamilk môn Marketing căn bản | Trường đại học Mở Hà Nội
186 93 -
Ngân hàng câu hỏi ôn thi môn Marketing căn bản | Trường đại học Mở Hà Nội
215 108 -

Marketing Định Hướng Bán Hàng: Chiến Lược Để Thuyết Phục Khách Hàng môn Marketing căn bản | Trường đại học Mở Hà Nội
164 82 -

Viral Marketing - MKTCB: Chiến Lược và Đặc Điểm Thực Hiện môn Marketing căn bản | Trường đại học Mở Hà Nội
165 83