Assignment 3: Effects of Hurricane Katrina on Housing Demand | Microeconomics | Trường Đại học Quốc tế, Đại học Quốc gia Thành phố Hồ Chí Minh
The need for housing rises as Baton Rouge's population grows, moving the demand curve to the right. From $130,000 (point a), the equilibrium price rose to $156,000 (point b). Levee breaks and a storm surge caused by Hurricane Katrina caused most of New Orleans to be flooded and severely damaged, displacing 250,000 residents to the nearby city of Baton Rouge. Tài liệu được sưu tầm và soạn thảo dưới dạng file PDF để gửi tới các bạn cùng tham khảo, ôn tập đầy đủ kiến thức, chuẩn bị cho các buổi học thật tốt. Mời bạn đọc đón xem!
Môn: Microeconomics 613 tài liệu
Trường: Trường Đại học Quốc tế, Đại học Quốc gia Thành phố Hồ Chí Minh 1.9 K tài liệu
Tác giả:

Preview text:
ASSIGNMENTS TOPIC 3: Exercise 1:
a. Explain the effects of Hurricane Katrina to demand for housing in Baton Rouge and to the price and
quantity of housing there. Use a graph to explain. b.
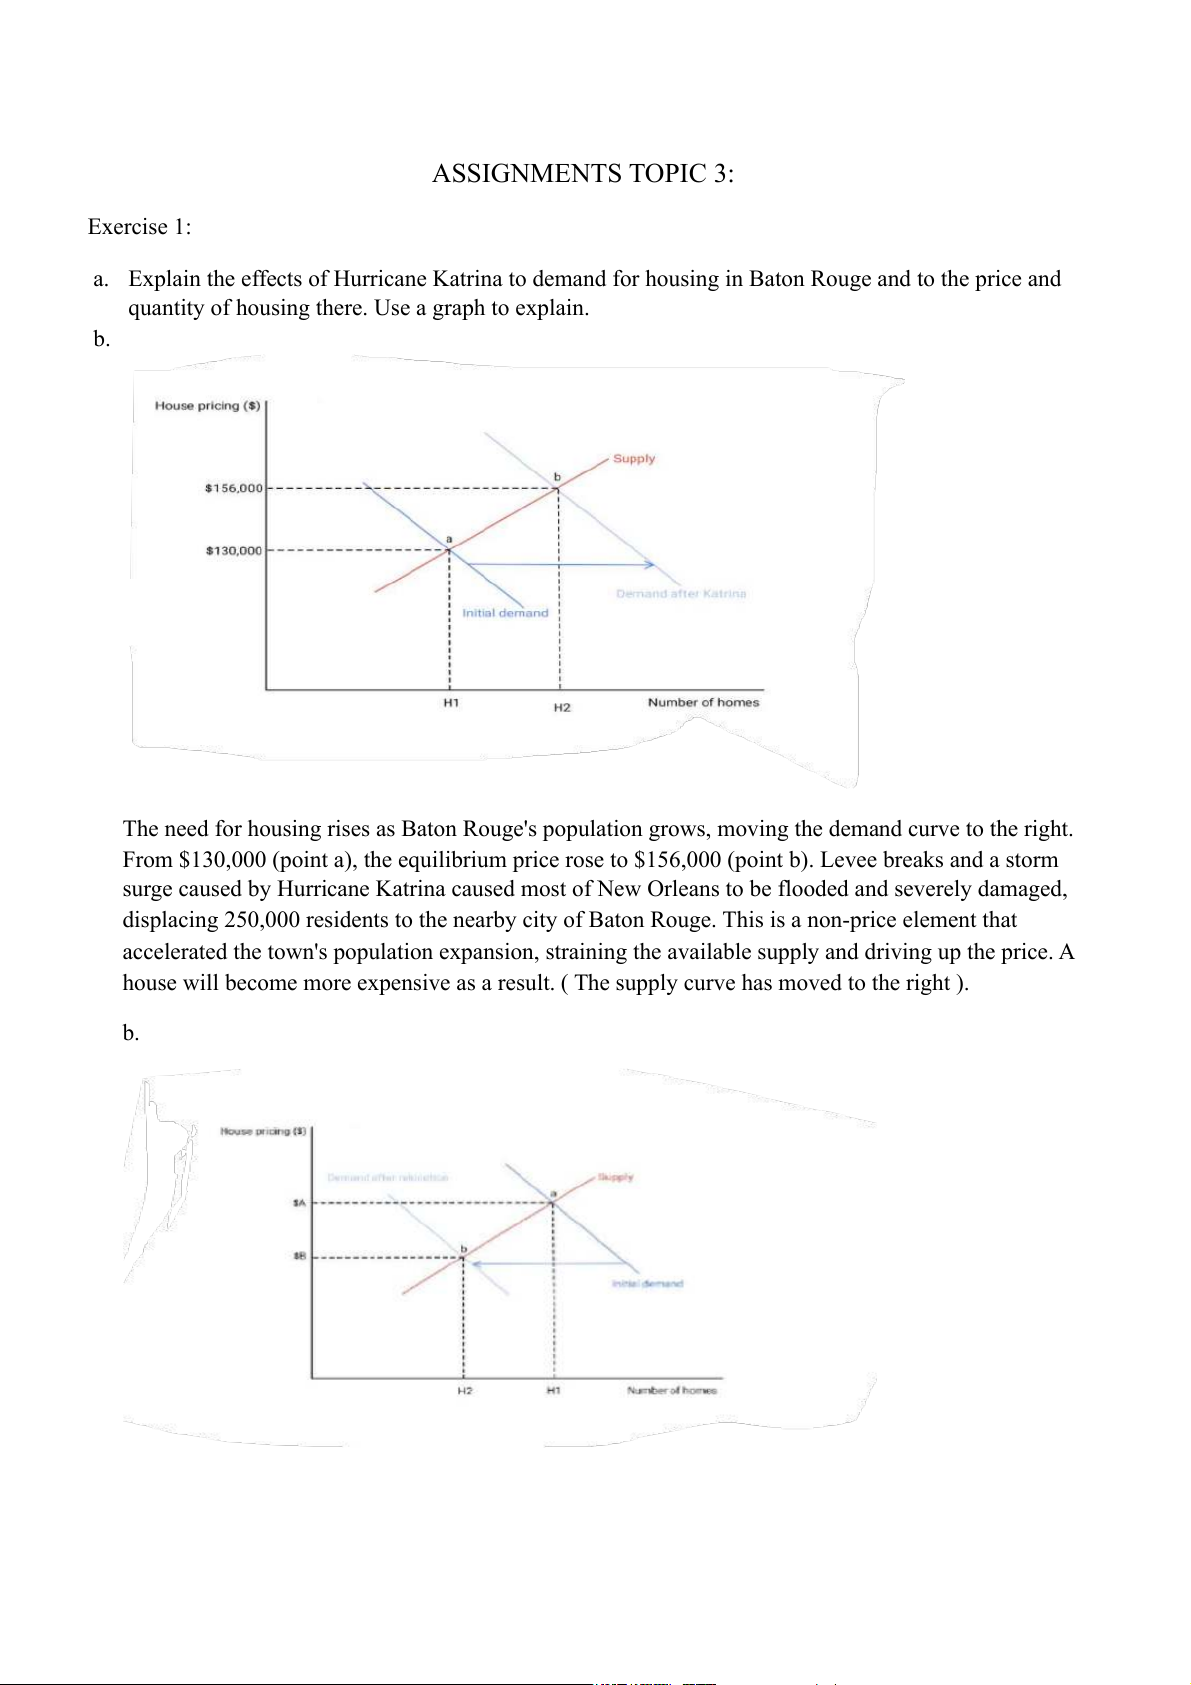
The need for housing rises as Baton Rouge's population grows, moving the demand curve to the right.
From $130,000 (point a), the equilibrium price rose to $156,000 (point b). Levee breaks and a storm
surge caused by Hurricane Katrina caused most of New Orleans to be flooded and severely damaged,
displacing 250,000 residents to the nearby city of Baton Rouge. This is a non-price element that
accelerated the town's population expansion, straining the available supply and driving up the price. A
house will become more expensive as a result. ( The supply curve has moved to the right ). b.
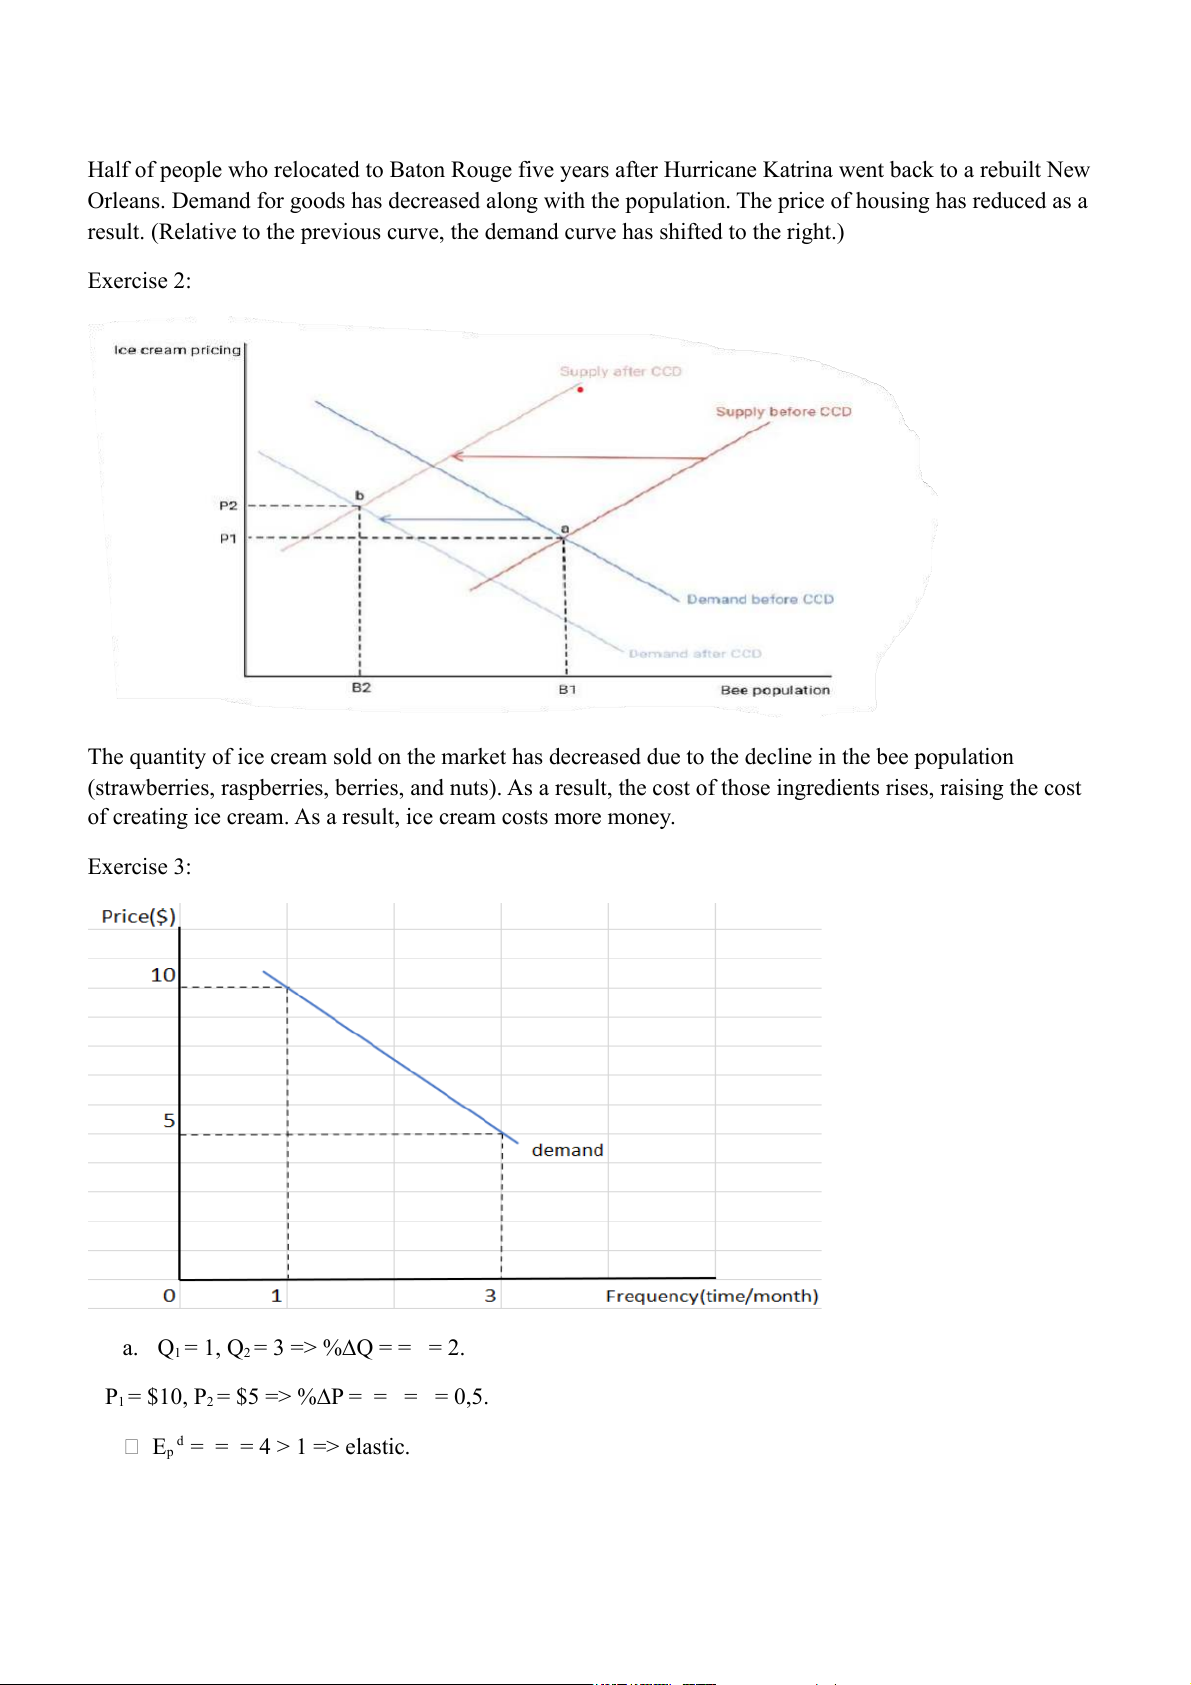
Half of people who relocated to Baton Rouge five years after Hurricane Katrina went back to a rebuilt New
Orleans. Demand for goods has decreased along with the population. The price of housing has reduced as a
result. (Relative to the previous curve, the demand curve has shifted to the right.) Exercise 2:
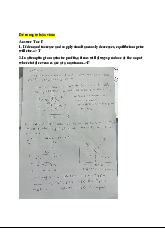
The quantity of ice cream sold on the market has decreased due to the decline in the bee population
(strawberries, raspberries, berries, and nuts). As a result, the cost of those ingredients rises, raising the cost
of creating ice cream. As a result, ice cream costs more money. Exercise 3:
a. Q1 = 1, Q = 3 => %∆Q = = = 2. 2 P = $10, P 1 = $5 => %∆P 2 = = = = 0,5. E d
p = = = 4 > 1 => elastic.
b. With the promotional vouchers, the Binh’s monthly expenditure on meals at this restaurant
increases from 1 meal per month to 3 meals per month.
Tài liệu liên quan:
-
Tự Luận Vimo: Phân Tích Cung, Cầu và Thị Trường Cạnh Tranh| Microeconomics | Trường Đại học Quốc tế, Đại học Quốc gia Thành phố Hồ Chí Minh
5 3 -
Review Questions: Thinking Like an Economist | Microeconomics | Trường Đại học Quốc tế, Đại học Quốc gia Thành phố Hồ Chí Minh
5 3 -
Final Exam Quizlet Questions & Answers | Microeconomics | Trường Đại học Quốc tế, Đại học Quốc gia Thành phố Hồ Chí Minh
5 3 -
Đề thi giữa kỳ II | Microeconomics | Trường Đại học Quốc tế, Đại học Quốc gia Thành phố Hồ Chí Minh
5 3 -

Final Group Project_ The Beer Industry | Microeconomics | Trường Đại học Quốc tế, Đại học Quốc gia Thành phố Hồ Chí Minh
4 2