Assignment 5: Term-Frequency and Kappa Analysis | Môn Data Mining - Trường Đại học Quốc tế, Đại học Quốc gia Thành phố Hồ Chí Minh
Assignment 5: Term-Frequency and Kappa Analysis Môn Data Mining. Tài liệu được sưu tầm gồm 6 trang, giúp bạn ôn tập tốt hơn. Mời các bạn đón xem.
Môn: Data Mining 10 tài liệu
Trường: Trường Đại học Quốc tế, Đại học Quốc gia Thành phố Hồ Chí Minh 2 K tài liệu
Tác giả:


Preview text:
lOMoAR cPSD| 23136115 DATA MINING - ASSIGNMENT 5 ITDSIU21001 - Phan Quoc Anh
Question 1: Term-Frequency Vector Analysis
Your job is to write by yourself a cosine similarity based comparator. To do that,
you need to create Term-Frequency Vectors.
Task: Write a program in any computer language, that:
• Accepts two files with some text as the input (e.g., fragments of the book)
• Tokenizes the texts, and then normalizes the text (remove the punctuation, transform to lowercase)
• Computes term-frequency vectors for both files
• Computes cosine similarity according to the formula given in the beginning
• Outputs the cosine as the output Solution:
Listing 1: Python Code for Term-Frequency Vector Analysis
import string import math from collections import Counter
def read file ( filepath ):
with open( file path , ’ r ’ , encoding=’ utf−8’ ) as file : return file . read ()
def normalize text ( text ):
translator = str . maketrans( ’ ’ , ’ ’ , string . punctuation )
return text . translate ( translator ). lower ()
def compute tf ( text ): words = text . split () return Counter(words)
def cosine similarity (vec1 , vec2 ):
all words = set ( vec1 . keys ()). union ( set ( vec2 . keys ())) vec1 tf = [ vec1
[ word ] for word in all words ] lOMoAR cPSD| 23136115
vec2 tf = [ vec2 [ word ] for word in all words ] dot product = sum(a ∗ b for a , b in zip( vec1 tf ,
vec2 tf )) magnitude1 = math. sqrt (sum(a ∗ a for a in vec1
tf )) magnitude2 = math. sqrt (sum(b ∗ b for b in vec2 tf ))
if not magnitude1 or not magnitude2 : return 0.0
return dot product / (magnitude1 ∗ magnitude2)
def main( file1 path , file2 path ): text1 = read file ( file1 path ) text2 = read file (
file2 path ) norm text1 = normalize text ( text1 ) norm text2 = normalize text
( text2 ) tf vector1 = compute tf ( norm text1 ) tf vector2 = compute tf ( norm
text2 ) similarity = cosine similarity ( tf vector1 , tf vector2 ) print( f ’ Cosine
Similarity : { similarity } ’ )
file1 path = ’/path/to/ f i r s t f i l e . txt ’ file2 path =
’/path/to/ second file . txt ’ main( file1 path , file2 path )
Question 2: Analysis of the Confusion Matrix Task:
Your task is to analyze the results of three different classifiers that have
classified data into four classes. Based on the given confusion matrices, calculate
the kappa statistic for each classifier to evaluate their performance.
1. Based on the given confusion matrices, calculate the kappa statistic
foreach of the three classifiers.
2. Show all calculation steps.
3. Compare the kappa statistic results for all classifiers and analyze
whichclassifier is the most efficient Solution: Classifier A Confusion Matrix: |
| Class 1 | Class 2 | Class 3 | Class 4 |
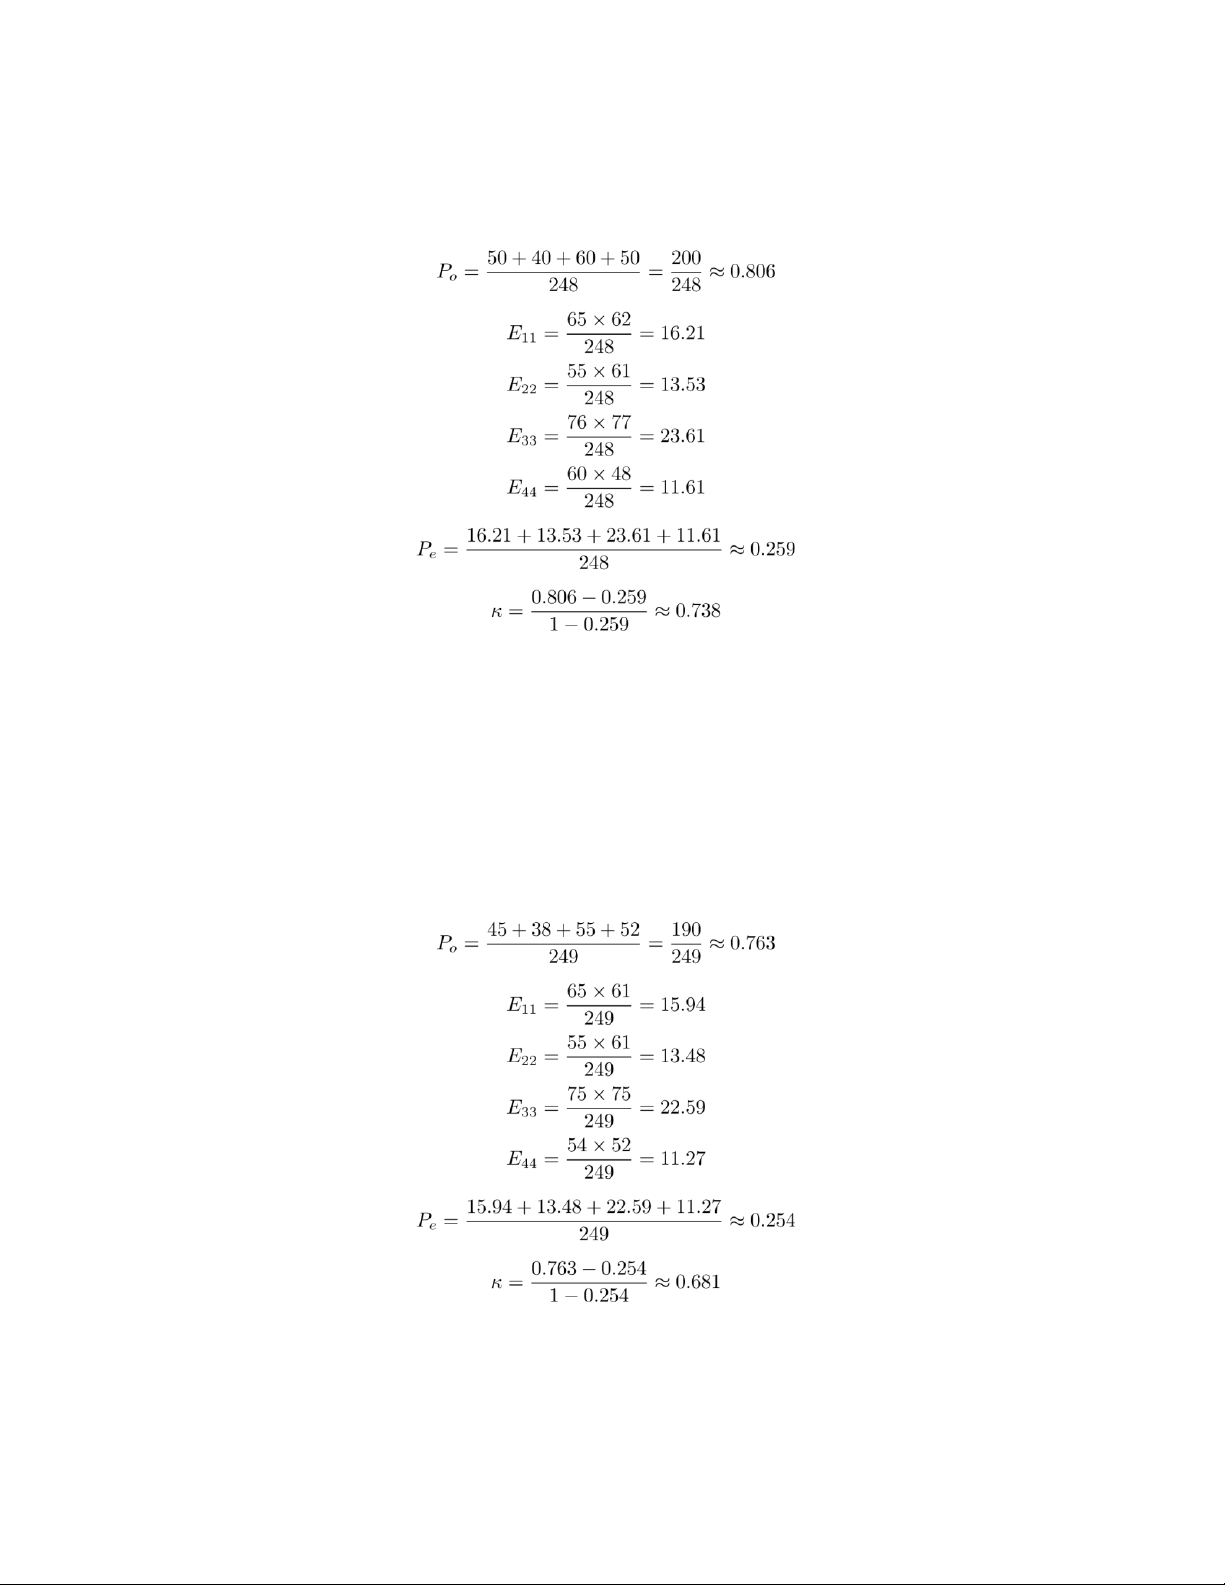
|---------|---------|---------|---------|---------| | Class 1 | 50 | 10 | 5 | 0 | | Class 2 | 8 | 40 | 5 | 2 | | Class 3 | 4 | 8 | 60 | 4 | | Class 4 | 0 | 3 | 7 | 50 | Total samples: 248 lOMoAR cPSD| 23136115 Classifier B Confusion Matrix: |
| Class 1 | Class 2 | Class 3 | Class 4 |
|---------|---------|---------|---------|---------| | Class 1 | 45 | 12 | 8 | 0 | | Class 2 | 10 | 38 | 7 | 0 | | Class 3 | 6 | 9 | 55 | 5 | | Class 4 | 0 | 2 | 5 | 52 | Total samples: 249 lOMoAR cPSD| 23136115 Classifier C Confusion Matrix: |
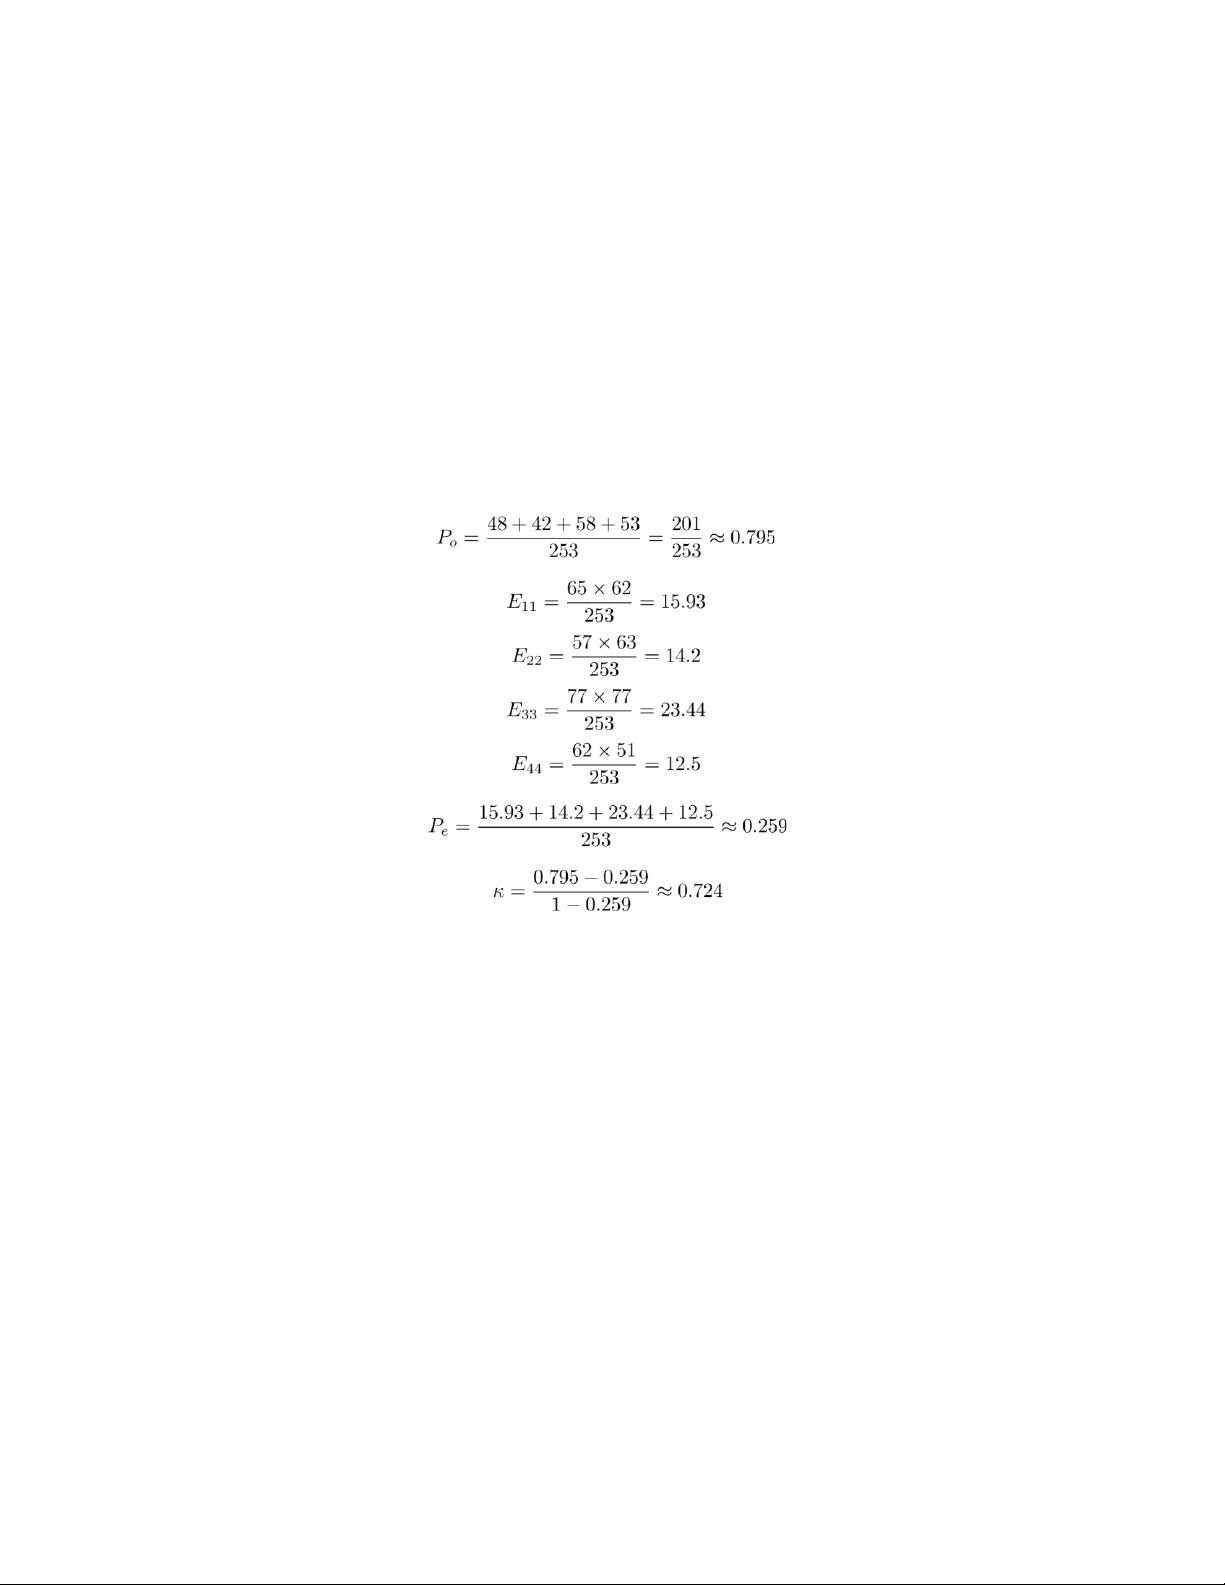
| Class 1 | Class 2 | Class 3 | Class 4 |
|---------|---------|---------|---------|---------| | Class 1 | 48 | 10 | 7 | 0 | | Class 2 | 9 | 42 | 6 | 0 | | Class 3 | 5 | 8 | 58 | 6 | | Class 4 | 0 | 3 | 6 | 53 | Total samples: 253 Comparison • Classifier A Kappa: 0.738
• Classifier B Kappa: 0.681 • Classifier C Kappa: 0.724
Conclusion: Classifier A is the most efficient with the highest Kappa statistic of 0.738.
Question 3: Playing with Rules and Decision Trees
Task: Design and implementation of algorithm for converting classification rules to decision trees.
Your job is to develop an algorithm that converts a set of classification rules
into a decision tree structure. You are asked to design, implement, and test an
algorithm that transforms a set of classification rules into a decision tree. The
algorithm should optimize the conversion process, especially handling repeated sub-trees efficiently. lOMoAR cPSD| 23136115 -
You should specify how you encode classification rules (e.g. - IF
condition1 AND condition2 THEN class1 - IF (condition3 XOR condition4) AND Attr3 ¿ 0 THEN class2) -
You can implement the solution in any programming language you are
comfortable with (e.g. Java, Python). -
Decide, what to do if rules are inconsistent -
Visualize a tree using some visualization solution, e.g. DOT language within Grpahiviz
Expected input: set of classification rules which follow propositional logic
constraints, Expected output: an image showing the tree. Solution:
Listing 2: Python Code for Converting Classification Rules to Decision Trees from
graphviz import Digraph class Node: def i n i t ( self , name, children=None ):
s e l f .name = name s e l f . children = children if children is not None else {}
def add rule ( tree , rule ): current node =
tree for condition in rule [: −1]:
if condition not in current node . children :
current node . children [ condition ] = Node( condition )
current node = current node . children [ condition ]
current node . children [ ’ class ’ ] = rule [−1]
def print tree (node , graph , parent=None ): graph . node(node .name) if parent :
graph . edge ( parent .name, node .name)
for child in node . children . values ():
if isinstance ( child , Node ): print tree ( child , graph , node) rules = [ [ ’ condition1 ’ , ’AND’ , ’ condition2 ’ , ’THEN’ , ’ class1 ’ ] , [ ’ condition3 ’ , ’XOR’ , ’ condition4 ’ , ’AND’ , ’ Attr3 > 0 ’ , ’THEN’ , ’ class2 ’ ] ]
tree = Node( ’ root ’ ) for rule in rules : add rule ( tree , rule ) graph = Digraph () lOMoAR cPSD| 23136115 print tree ( tree , graph)
graph . render ( ’ decision tree ’ , format=’png ’ , view=True)
Note: Make sure you have Graphviz installed and the Python graphviz package
installed to run this code. You can install it using: pip install graphviz
Tài liệu liên quan:
-
Notes: Key Concepts and Techniques | Môn Data Mining - Trường Đại học Quốc tế, Đại học Quốc gia Thành phố Hồ Chí Minh
104 52 -
Lecture 6: Decision Tree & Bayesian Classification | Môn Data Mining - Trường Đại học Quốc tế, Đại học Quốc gia Thành phố Hồ Chí Minh
124 62 -
Lab 5: Integrating Processes and Ethics | Môn Data Mining - Trường Đại học Quốc tế, Đại học Quốc gia Thành phố Hồ Chí Minh
111 56 -
Lecture 4: Knowledge Representation | Môn Data Mining - Trường Đại học Quốc tế, Đại học Quốc gia Thành phố Hồ Chí Minh
107 54 -

Lecture 3: Data Preprocessing Overview and Techniques | Môn Data Mining - Trường Đại học Quốc tế, Đại học Quốc gia Thành phố Hồ Chí Minh
116 58