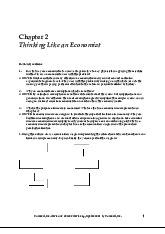
Assignment Presentation 1: Analyzing Opportunity Costs in Economics | Microeconomics | Trường Đại học Quốc tế, Đại học Quốc gia Thành phố Hồ Chí Minh
Graph the data in t h e ta b l e. A r e the r e c o nstan t or increasing opportunity costs for the production of missiles? There are increasing opportunity costs in the production of missiles because the production of cars pretends to fall at a higher rate as the larger number of missiles are produce. Tài liệu được sưu tầm và soạn thảo dưới dạng file PDF để gửi tới các bạn cùng tham khảo, ôn tập đầy đủ kiến thức, chuẩn bị cho các buổi học thật tốt. Mời bạn đọc đón xem!
Môn: Microeconomics 613 tài liệu
Trường: Trường Đại học Quốc tế, Đại học Quốc gia Thành phố Hồ Chí Minh 1.9 K tài liệu
Tác giả:
Preview text:
Group Exercise 1.
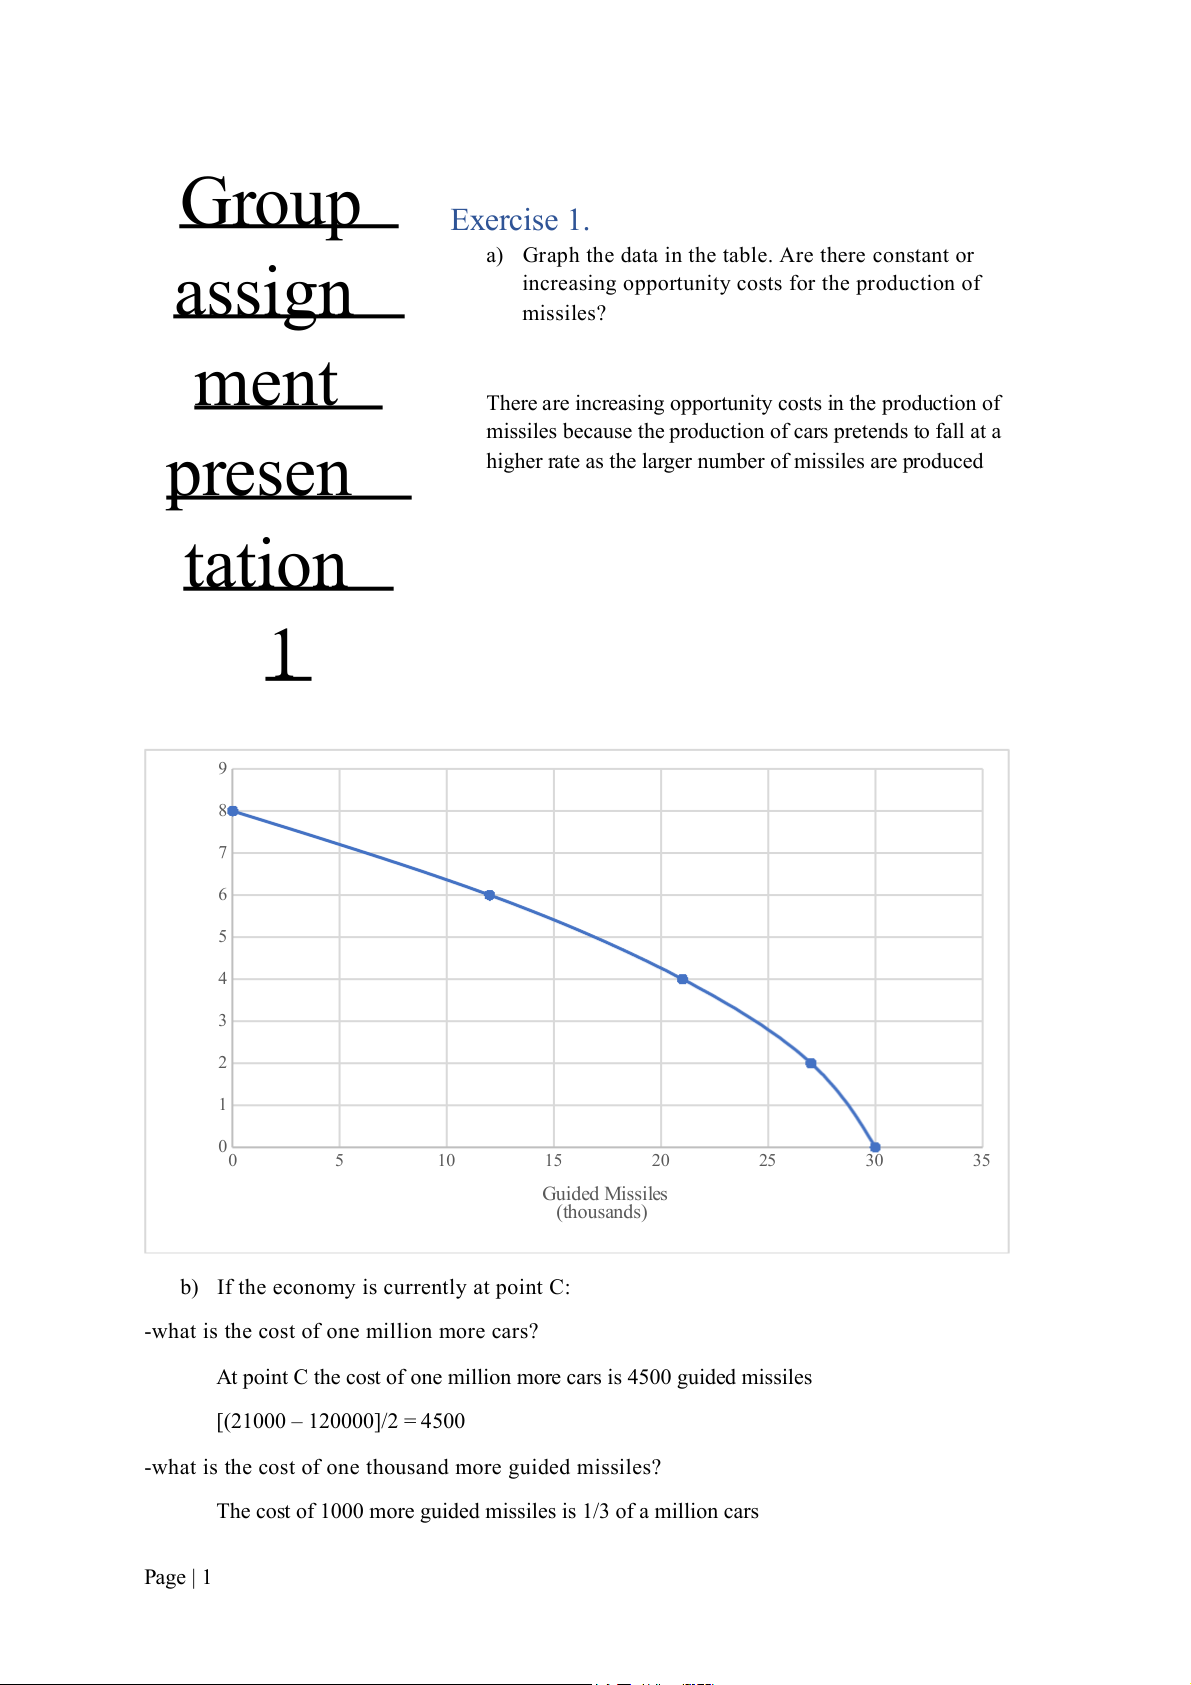
a) Graph the data in the table. Are there constant or
increasing opportunity costs for the production of assign missiles? ment
There are increasing opportunity costs in the production of
missiles because the production of cars pretends to fall at a
higher rate as the larger number of missiles are produced presen tation 1 9 8 7 6 5 illions) (m 4 rs Ca 3 2 1 00 5 10 15 20 25 30 35 Guided Missiles (thousands)
b) If the economy is currently at point C:
-what is the cost of one million more cars?
At point C the cost of one million more cars is 4500 guided missiles [(21000 – 120000]/2 = 4500
-what is the cost of one thousand more guided missiles?
The cost of 1000 more guided missiles is 1/3 of a million cars Page | 1
= [(4 million – 2 million)/6]
c) Label a point G inside the curve in question 3. What does it indicate?
Point G indicates inefficient resource use in the economy
d) Label a point H that lies outside the PPF curve of question 3. - What does this point indicate?
Point H shows an impossible point in this economy because of limited resources -
What must occur before the economy can attain the level of production indicated by point H?
Economic growth is the must-have factor to attain the level of point H. This can be
improved through better technology. Therefore, inputs will increase, and more
production will be deployed to attain point H.
e) Suppose improvement occurs in the technology of producing guided missiles but not in the production of cars -
Draw the PPF curve on the graph you created
P1 represents an improvement in technology of producing guided missiles but not in cars -
Now draw a curve that reflects technological improvement in the production of both products.
P3 represents an improvement in the technology of producing both cars and guided missiles Exercise 2.
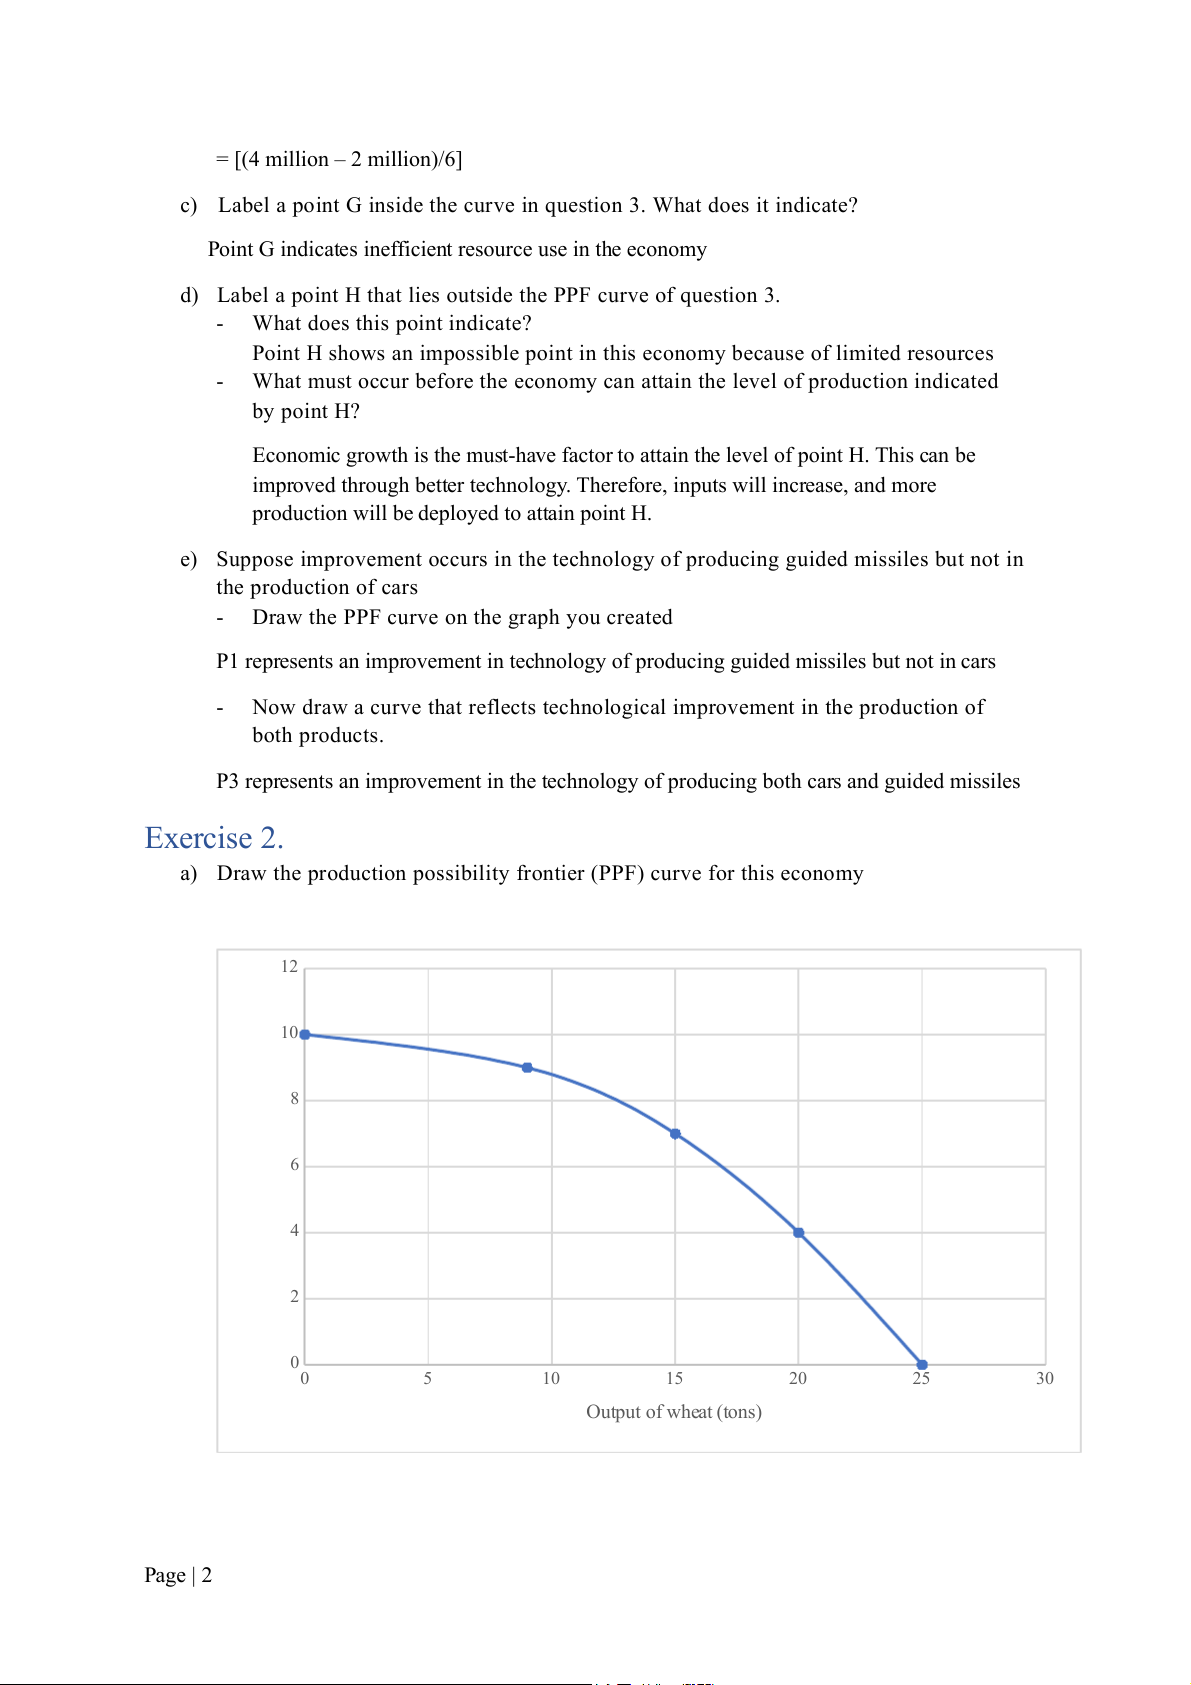
a) Draw the production possibility frontier (PPF) curve for this economy 12 10 t) se 8 00 hs (10 6 lot of c 4 Output 2 00 5 10 15 20 25 30 Output of wheat (tons) Page | 2
b) If the output of wheat and cloth is 9 tons of wheat and 4000 sets of cloth, what do you
think about the productive efficiency of this economy?
This economy’s productive efficiency is ineffective, wasting resources because the point
F that represented this assumption is inside the curve. When 9 tons of wheat are
produced, we have 9000 sets of clothes. On another side, when 4000 sets are produced, we have 20 tons of wheat.
c) Can this economy produce 20 tons of wheat and 10000 sets of clothes?
This economy can’t produce that amount of wheat and clothes. As point G indicates this
condition is outside the curve, which means impossible or unattainable.
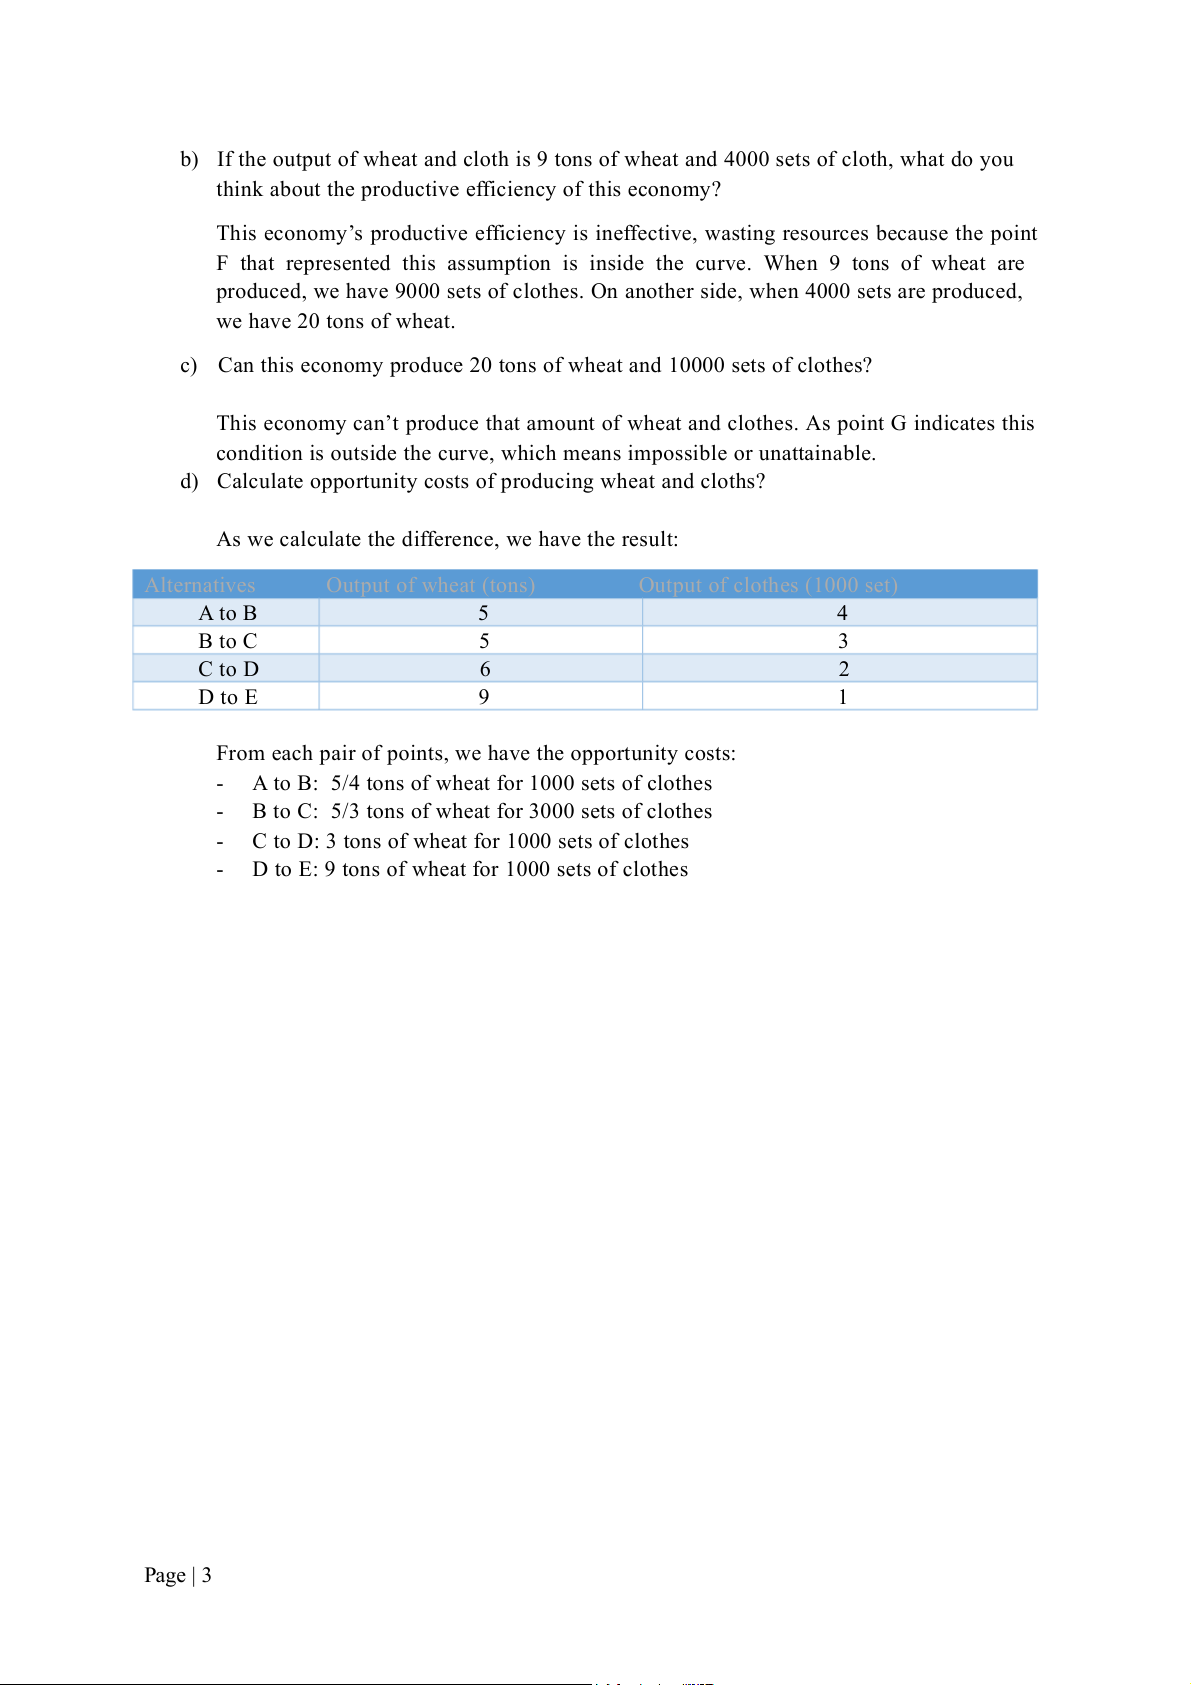
d) Calculate opportunity costs of producing wheat and cloths?
As we calculate the difference, we have the result: Alternatives Output of wheat (tons) Output of clothes (1000 set) A to B 5 4 B to C 5 3 C to D 6 2 D to E 9 1
From each pair of points, we have the opportunity costs: -
A to B: 5/4 tons of wheat for 1000 sets of clothes -
B to C: 5/3 tons of wheat for 3000 sets of clothes -
C to D: 3 tons of wheat for 1000 sets of clothes -
D to E: 9 tons of wheat for 1000 sets of clothes Page | 3
Tài liệu liên quan:
-
Tự Luận Vimo: Phân Tích Cung, Cầu và Thị Trường Cạnh Tranh| Microeconomics | Trường Đại học Quốc tế, Đại học Quốc gia Thành phố Hồ Chí Minh
5 3 -
Review Questions: Thinking Like an Economist | Microeconomics | Trường Đại học Quốc tế, Đại học Quốc gia Thành phố Hồ Chí Minh
5 3 -
Final Exam Quizlet Questions & Answers | Microeconomics | Trường Đại học Quốc tế, Đại học Quốc gia Thành phố Hồ Chí Minh
5 3 -
Đề thi giữa kỳ II | Microeconomics | Trường Đại học Quốc tế, Đại học Quốc gia Thành phố Hồ Chí Minh
5 3 -
Final Group Project_ The Beer Industry | Microeconomics | Trường Đại học Quốc tế, Đại học Quốc gia Thành phố Hồ Chí Minh
4 2