Assignment Presentation 3: Housing Demand After Hurricane Katrina | Microeconomics | Trường Đại học Quốc tế, Đại học Quốc gia Thành phố Hồ Chí Minh
In the late summer of 2015, Hurricane Katrina caused a storm surge and levee breaks that flooded much of New Orleans and destroyed a large fraction of the city’s housing. Hundreds of thousands of residents were displaced, and about 250,000 relocated to nearby Baton Rouge. The increase in population was so large that Baton Rouge became the largest city in the state, and many people started calling the city “New Baton Rouge” . Tài liệu được sưu tầm và soạn thảo dưới dạng file PDF để gửi tới các bạn cùng tham khảo, ôn tập đầy đủ kiến thức, chuẩn bị cho các buổi học thật tốt. Mời bạn đọc đón xem!
Môn: Microeconomics 613 tài liệu
Trường: Trường Đại học Quốc tế, Đại học Quốc gia Thành phố Hồ Chí Minh 1.9 K tài liệu
Tác giả:
Preview text:
Group assignment presentation 3 1. Case 1
In the late summer of 2015, Hurricane Katrina caused a storm surge and levee
breaks that flooded much of New Orleans and destroyed a large fraction of the
city’s housing. Hundreds of thousands of residents were displaced, and about
250,000 relocated to nearby Baton Rouge. The increase in population was so
large that Baton Rouge became the largest city in the state, and many people
started calling the city “New Baton Rouge”.
Before Katrina, the average price of a single-family home was $130,000. The
increase in the city’s population shifted the demand curve to the right, causing
excess demand for housing at the original price. Just before the hurricane, there
were 3,600 homes listed for sale in the city, but a week after the storm, there
were only 500. The excess demand caused fierce competition among buyers for
the limited supply of homes, increasing the price. Six months later, the average price had risen to $ 156,000 Questions
a. Explain the effects of Hurricane Katrina to demand for housing in Baton
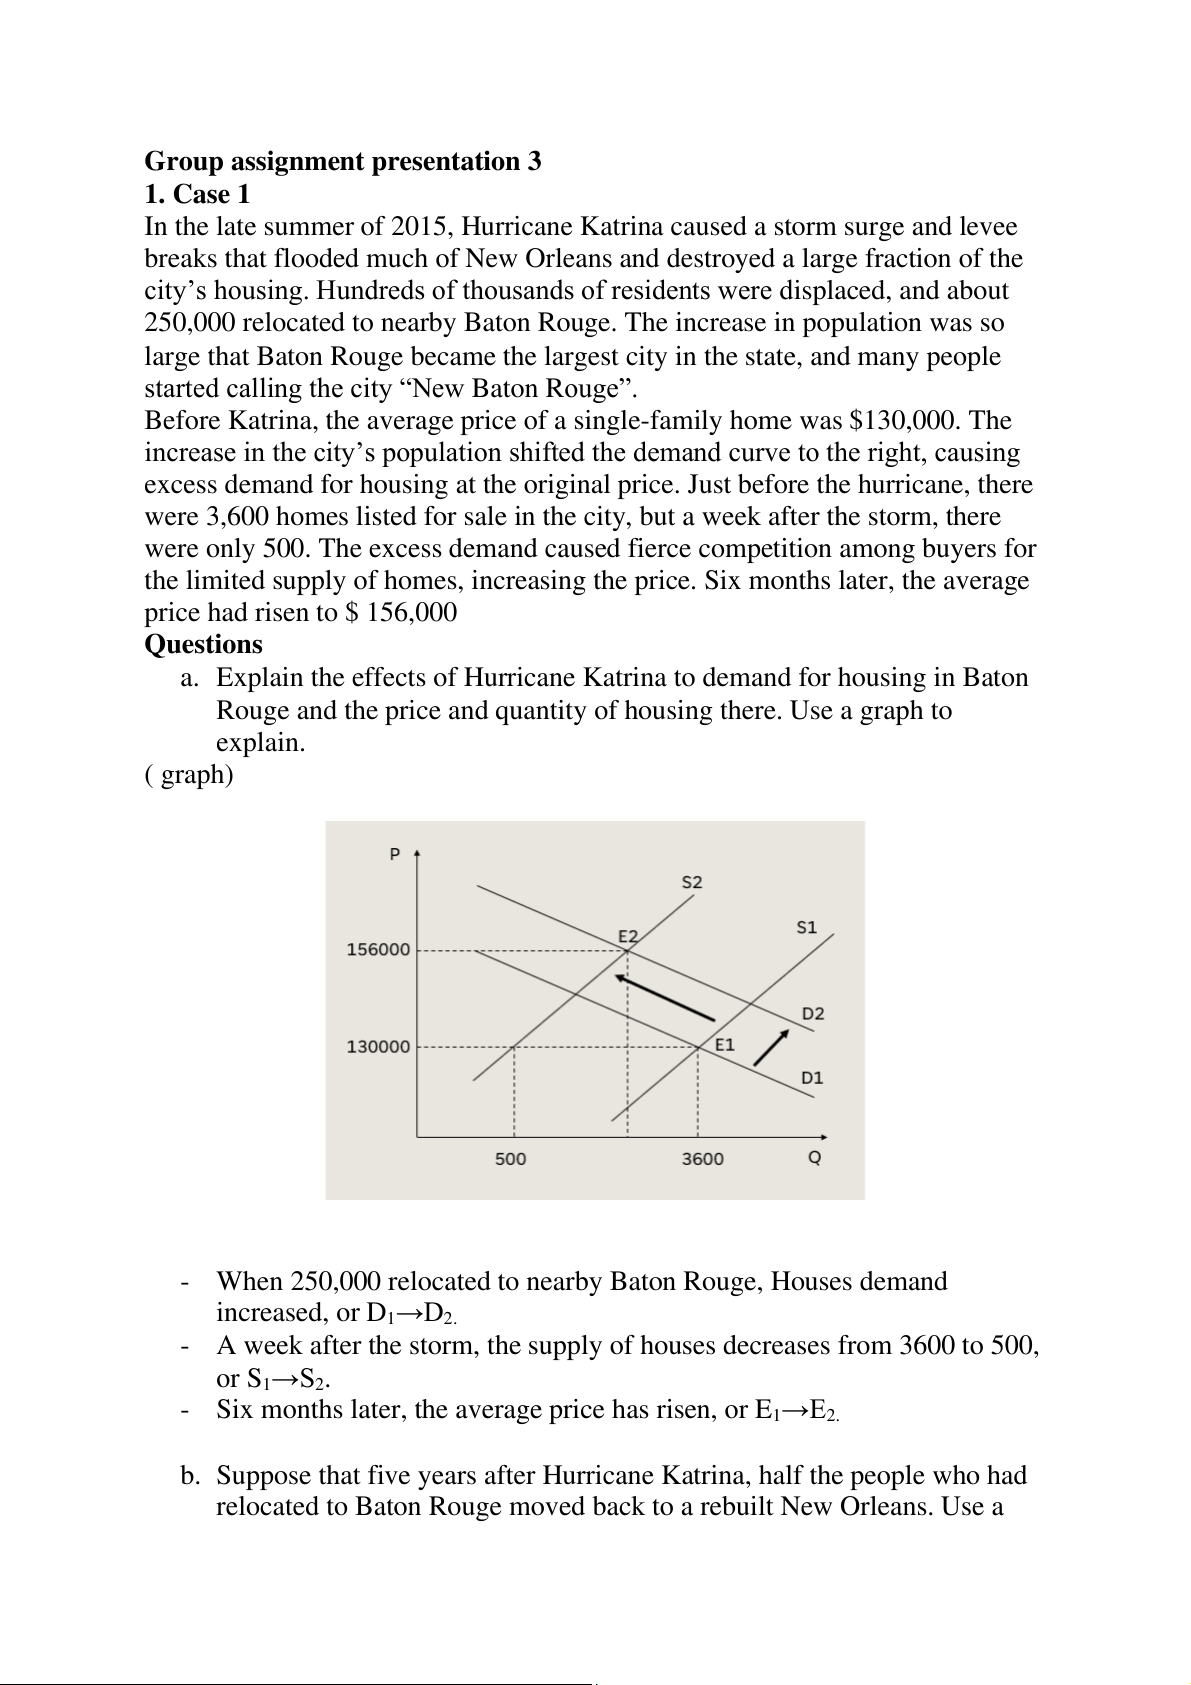
Rouge and the price and quantity of housing there. Use a graph to explain. ( graph)
- When 250,000 relocated to nearby Baton Rouge, Houses demand increased, or D1→D2.
- A week after the storm, the supply of houses decreases from 3600 to 500, or S1→S2.
- Six months later, the average price has risen, or E1→E 2.
b. Suppose that five years after Hurricane Katrina, half the people who had
relocated to Baton Rouge moved back to a rebuilt New Orleans. Use a
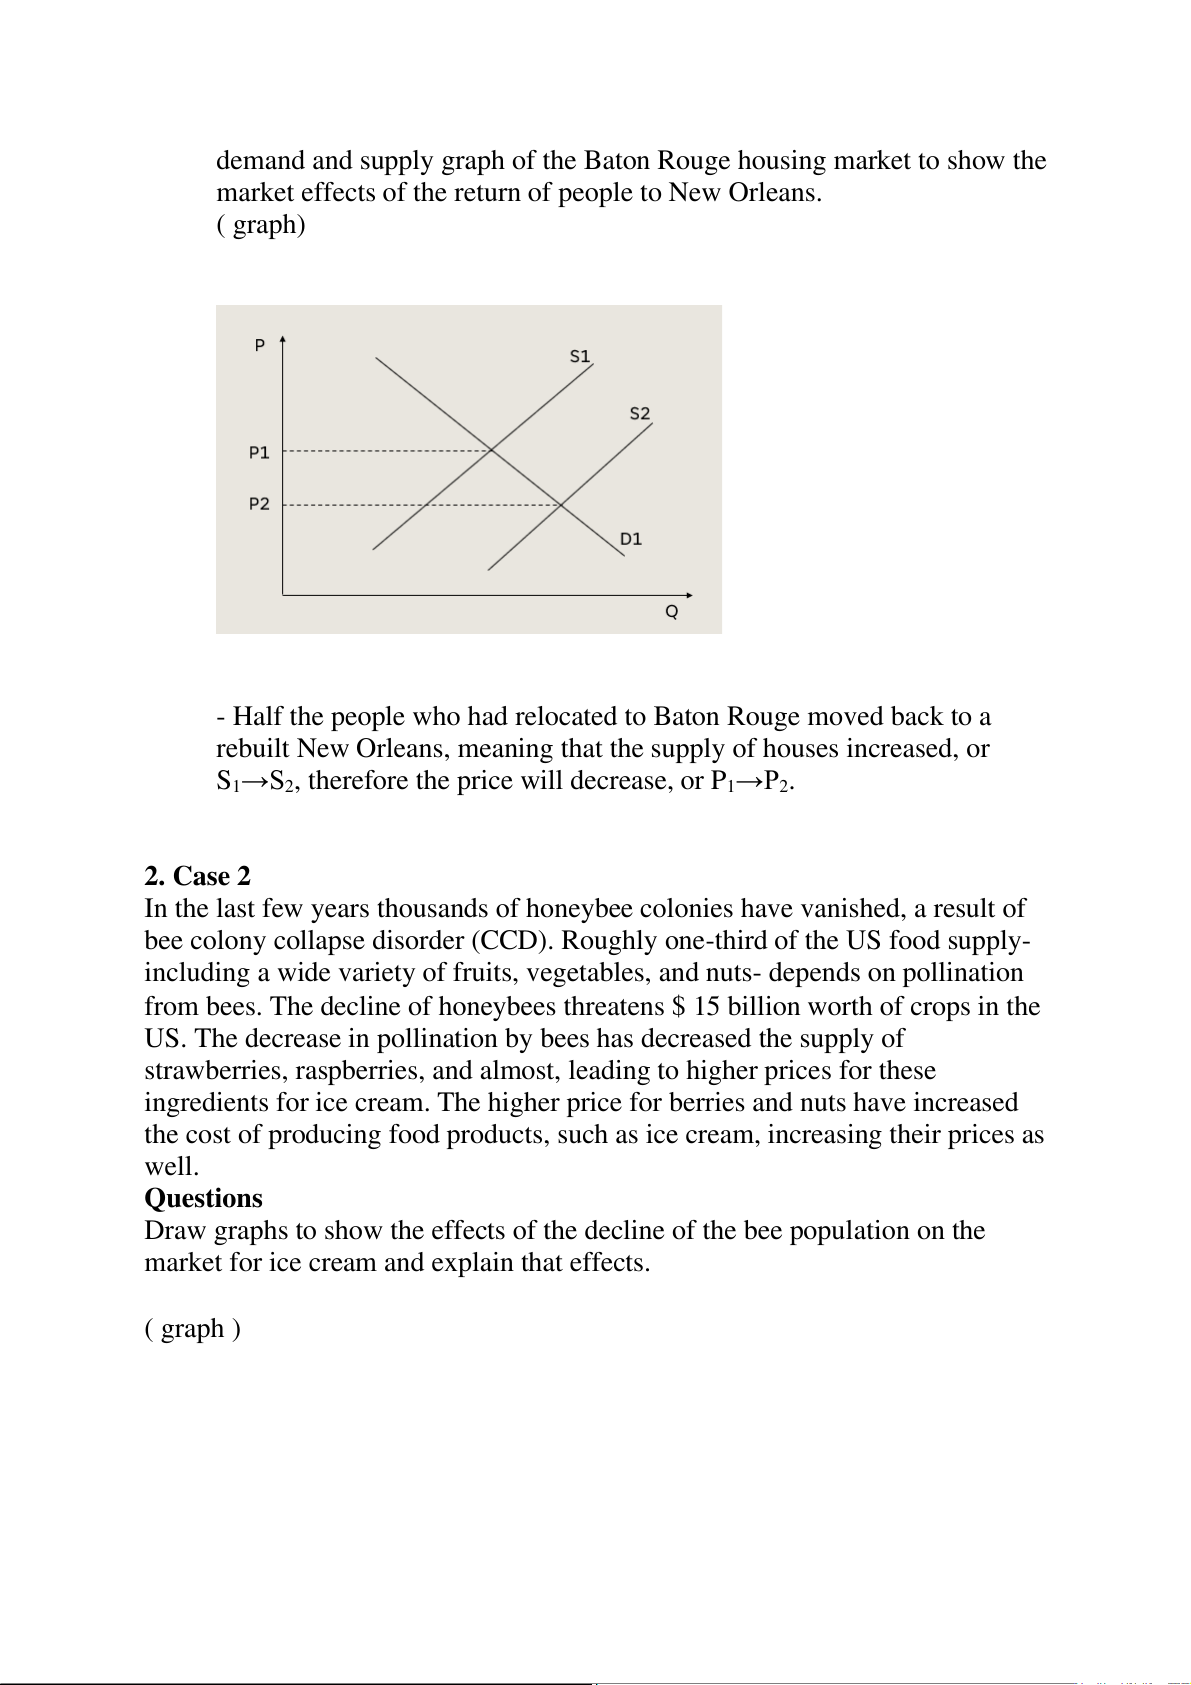
demand and supply graph of the Baton Rouge housing market to show the
market effects of the return of people to New Orleans. ( graph)
- Half the people who had relocated to Baton Rouge moved back to a
rebuilt New Orleans, meaning that the supply of houses increased, or
S1→S2, therefore the price will decrease, or P1→P2. 2. Case 2
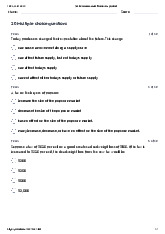
In the last few years thousands of honeybee colonies have vanished, a result of
bee colony collapse disorder (CCD). Roughly one-third of the US food supply-
including a wide variety of fruits, vegetables, and nuts- depends on pollination
from bees. The decline of honeybees threatens $ 15 billion worth of crops in the
US. The decrease in pollination by bees has decreased the supply of
strawberries, raspberries, and almost, leading to higher prices for these
ingredients for ice cream. The higher price for berries and nuts have increased
the cost of producing food products, such as ice cream, increasing their prices as well. Questions
Draw graphs to show the effects of the decline of the bee population on the
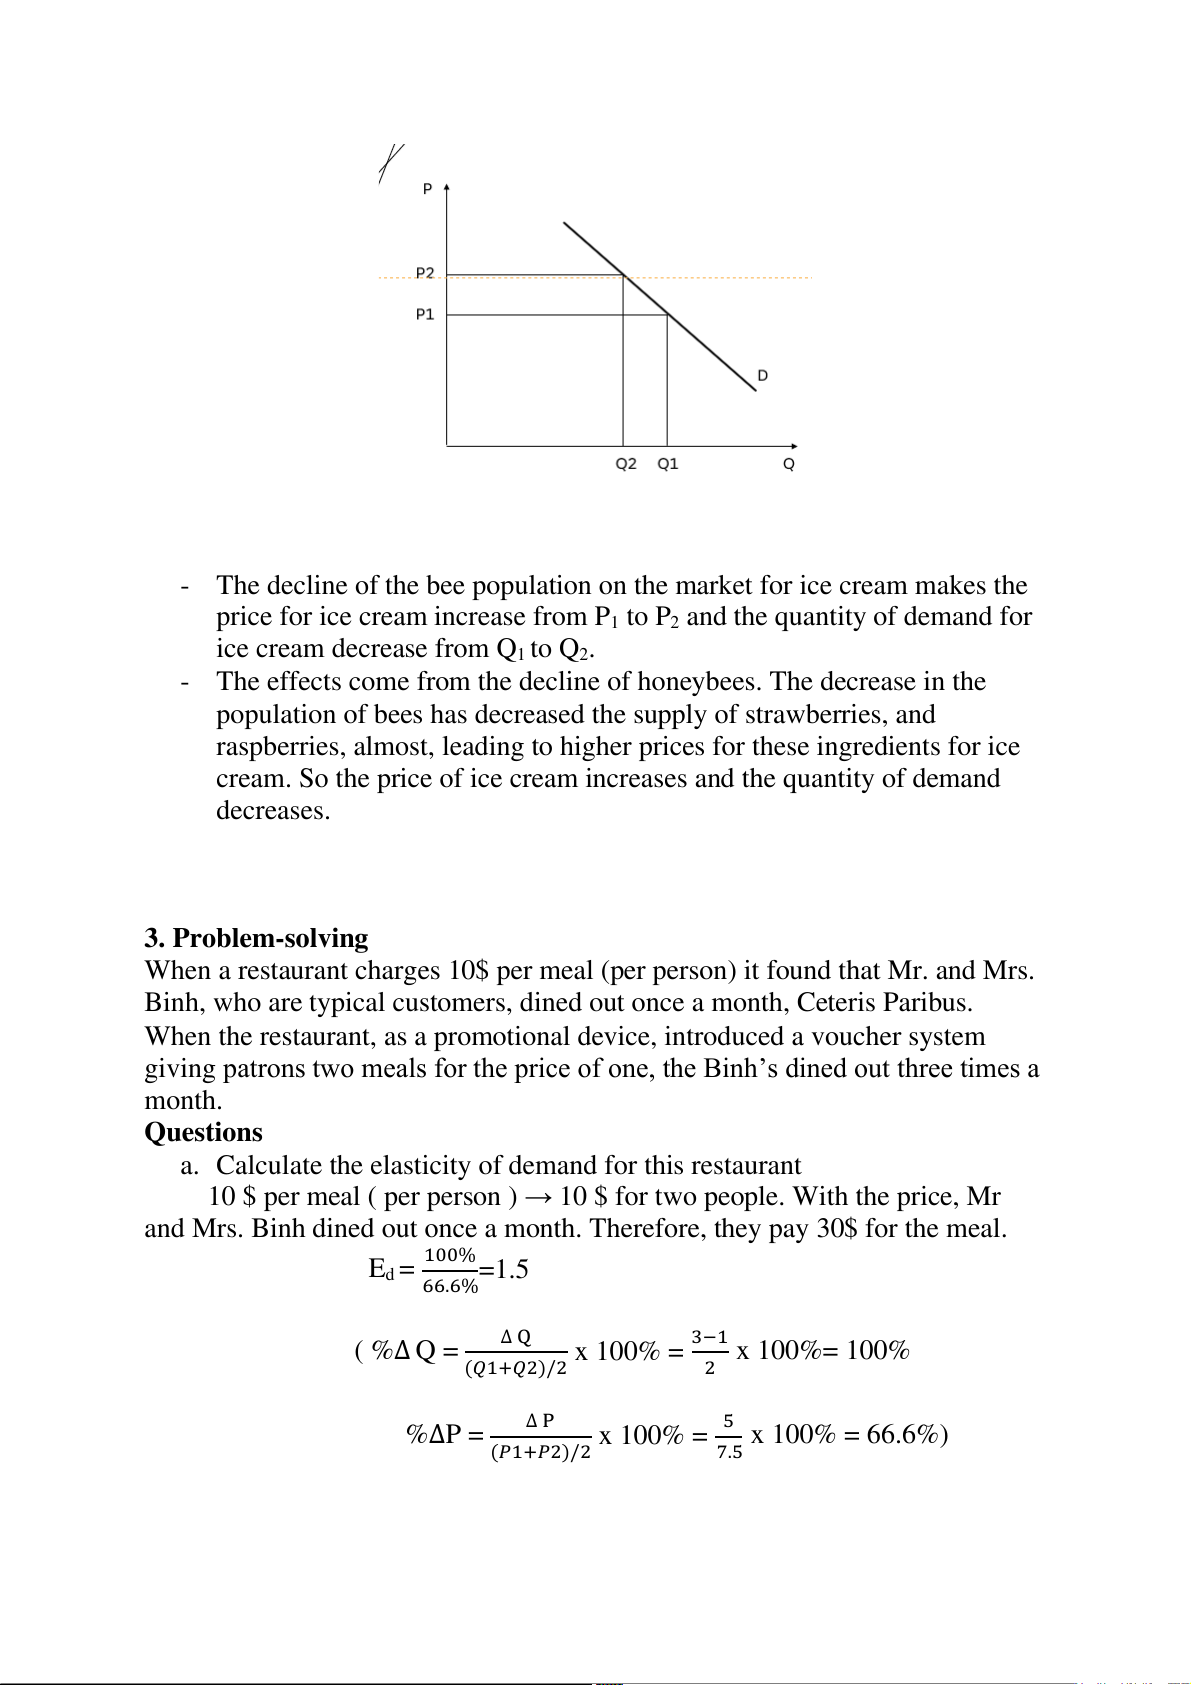
market for ice cream and explain that effects. ( graph )
- The decline of the bee population on the market for ice cream makes the
price for ice cream increase from P1 to P2 and the quantity of demand for ice cream decrease from Q t 1 o Q2.
- The effects come from the decline of honeybees. The decrease in the
population of bees has decreased the supply of strawberries, and
raspberries, almost, leading to higher prices for these ingredients for ice
cream. So the price of ice cream increases and the quantity of demand decreases. 3. Problem-solving
When a restaurant charges 10$ per meal (per person) it found that Mr. and Mrs.
Binh, who are typical customers, dined out once a month, Ceteris Paribus.
When the restaurant, as a promotional device, introduced a voucher system
giving patrons two meals for the price of one, the Binh’s dined out three times a month. Questions
a. Calculate the elasticity of demand for this restaurant
10 $ per meal ( per person ) → 10 $ for two people. With the price, Mr
and Mrs. Binh dined out once a month. Therefore, they pay 30$ for the meal. E 100% d = =1.5 66.6% ( % Δ Q Δ Q = x 100% = 3−1 x 100%= 100% (𝑄1+𝑄2)/2 2 % Δ P ΔP = x 100% = 5 x 100% = 66.6%) (𝑃1+𝑃2)/2 7.5
b. Explain what impact the promotional vouchers had on Binh’s monthly
expenditure on meals at this restaurant. Is the change in total expenditure
consistent with the value of demand you calculate?
Because the restaurant introduces a voucher system giving patrons two meals
for the price of one, the price for meal decreases. This make Binh’s dined out more than before.
- Yes, the change in total expenditure consistent with the value of demand.
Because E dp = 1.5 > 1→ elastic → %Δ Q > %ΔP.
Tài liệu liên quan:
-

Tự Luận Vimo: Phân Tích Cung, Cầu và Thị Trường Cạnh Tranh| Microeconomics | Trường Đại học Quốc tế, Đại học Quốc gia Thành phố Hồ Chí Minh
5 3 -
Review Questions: Thinking Like an Economist | Microeconomics | Trường Đại học Quốc tế, Đại học Quốc gia Thành phố Hồ Chí Minh
5 3 -
Final Exam Quizlet Questions & Answers | Microeconomics | Trường Đại học Quốc tế, Đại học Quốc gia Thành phố Hồ Chí Minh
5 3 -

Đề thi giữa kỳ II | Microeconomics | Trường Đại học Quốc tế, Đại học Quốc gia Thành phố Hồ Chí Minh
5 3 -

Final Group Project_ The Beer Industry | Microeconomics | Trường Đại học Quốc tế, Đại học Quốc gia Thành phố Hồ Chí Minh
4 2